2025/03/21Number of reading(7928)Number of comments(0)
I. Target Audience
Business Owners, Operations
II. Feature Introduction
SellerSpace's WeChat Mobile APP - Sales Overview feature automatically synchronizes your store's sales performance data, with over 40 sales metrics, including: Sales, Advertising, Inventory, Hijack Monitoring, and more.
It has seven sections: Marketplace Sales, Sales Overview, Advertising Overview, Profit Overview, Best-Selling Products, Sales Charts, and Last 7 Days Sales. Through your mobile phone, you can view and analyze the performance of each store in different time periods anytime, anywhere, conveniently and quickly, freeing you from your computer!
III. Use Cases
- Analyze store sales performance on the go via mobile phone;
- Monitor your store on your phone while you are out and about.
IV. Operation Guide
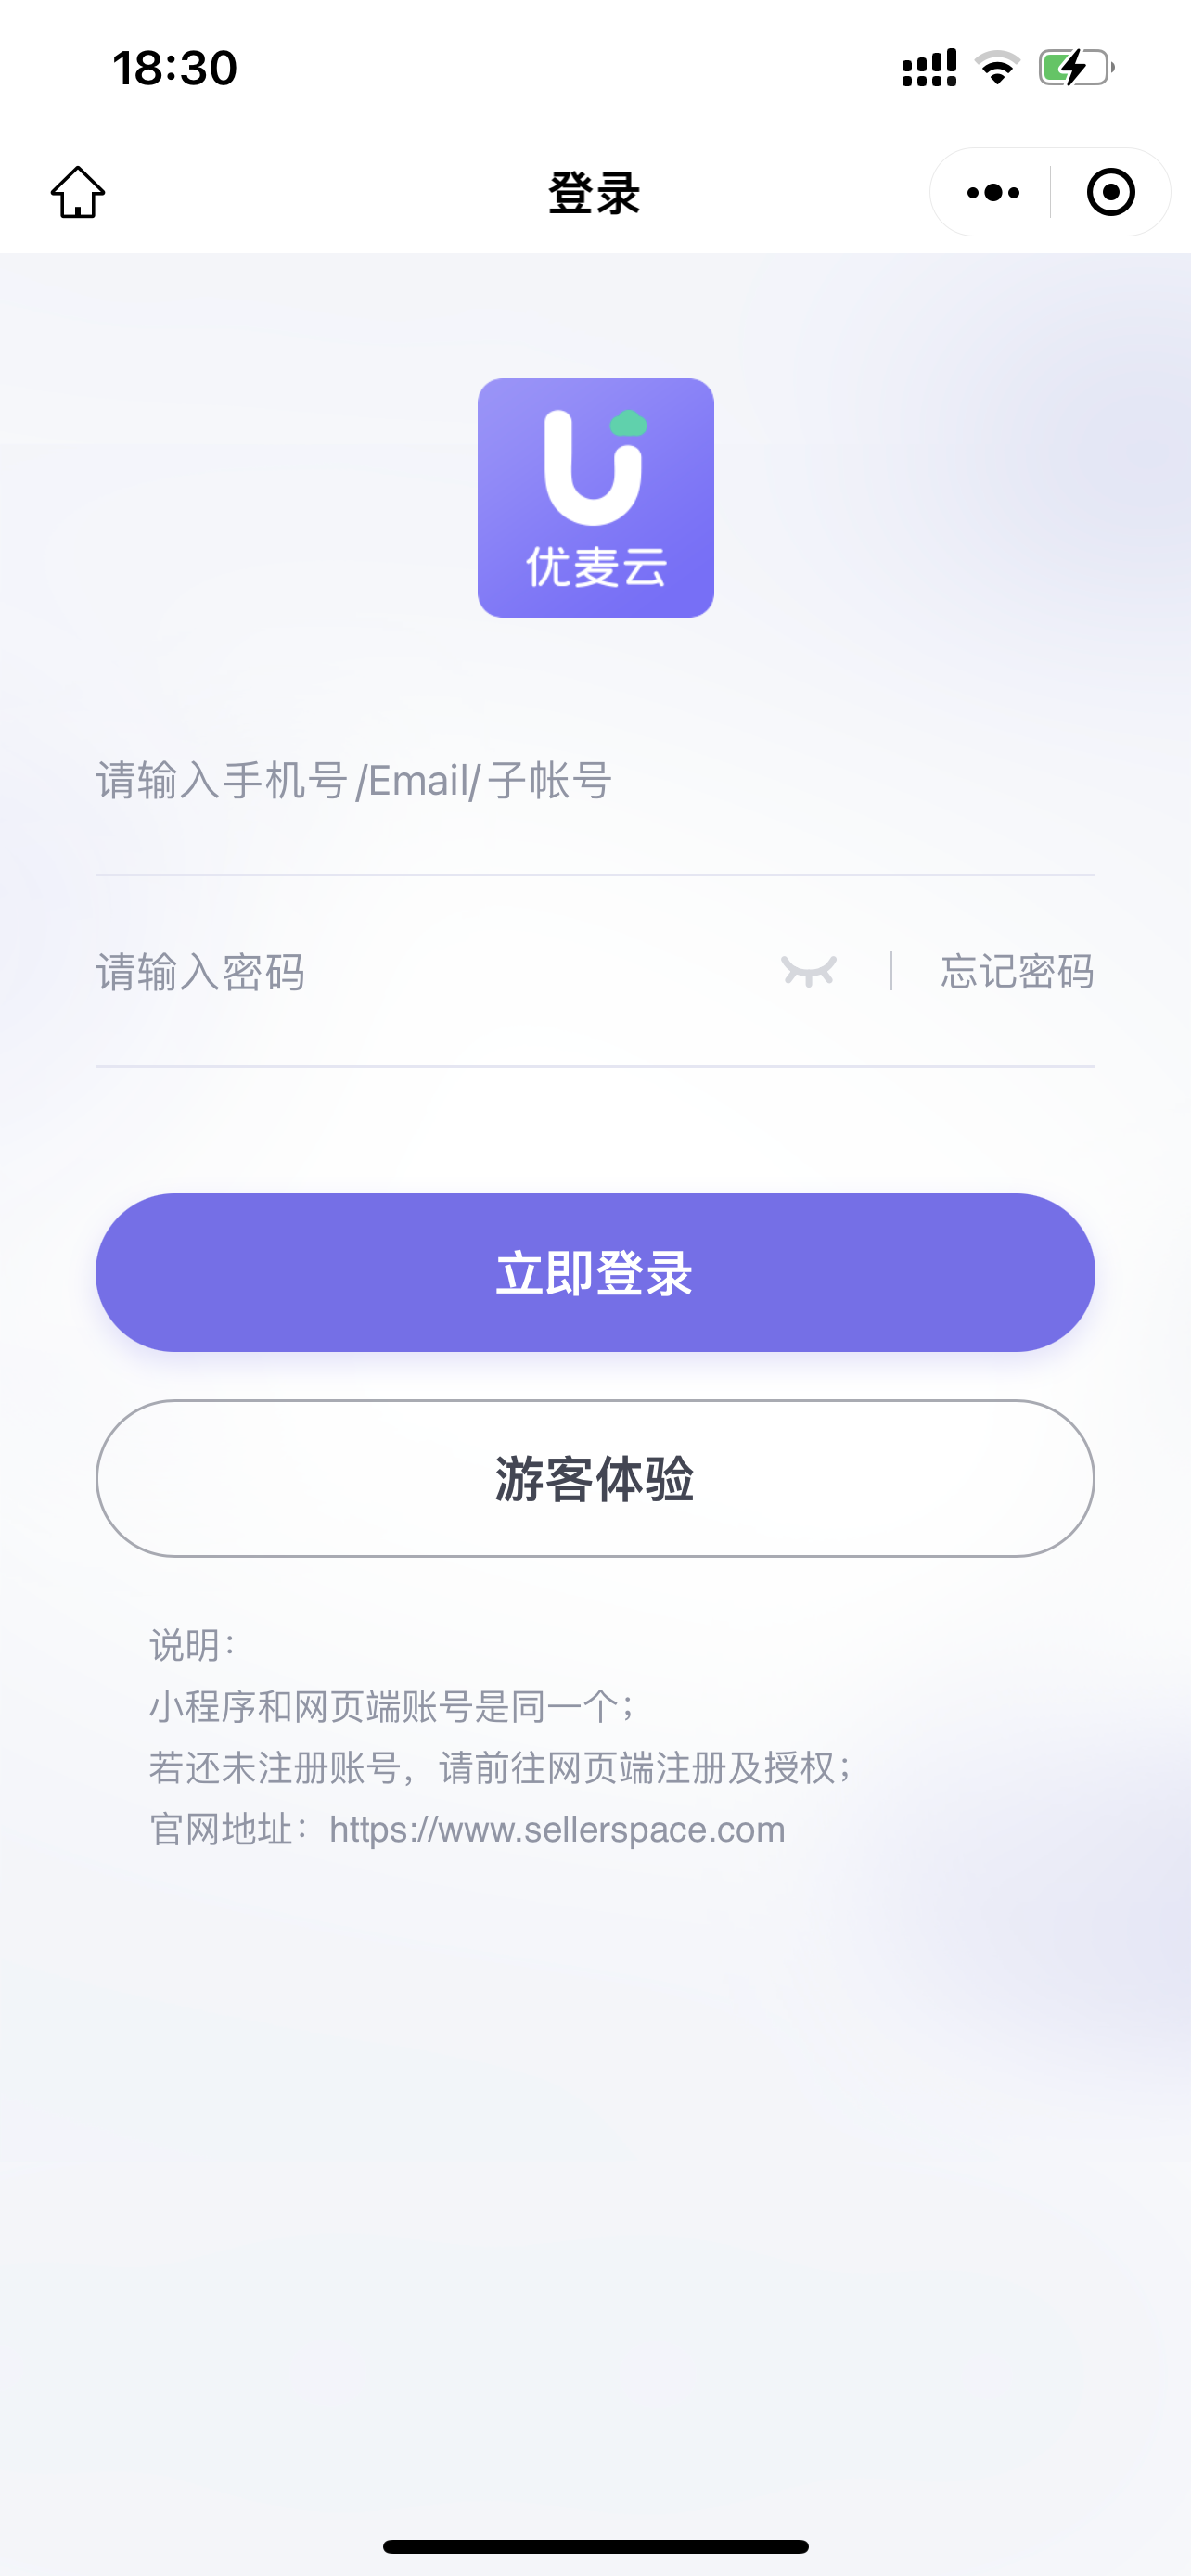
Enter the SellerSpace WeChat Mobile APP on your phone and log in to your account (Special Note: If you have logged in before, you will be automatically logged in next time you enter.)
 +
+
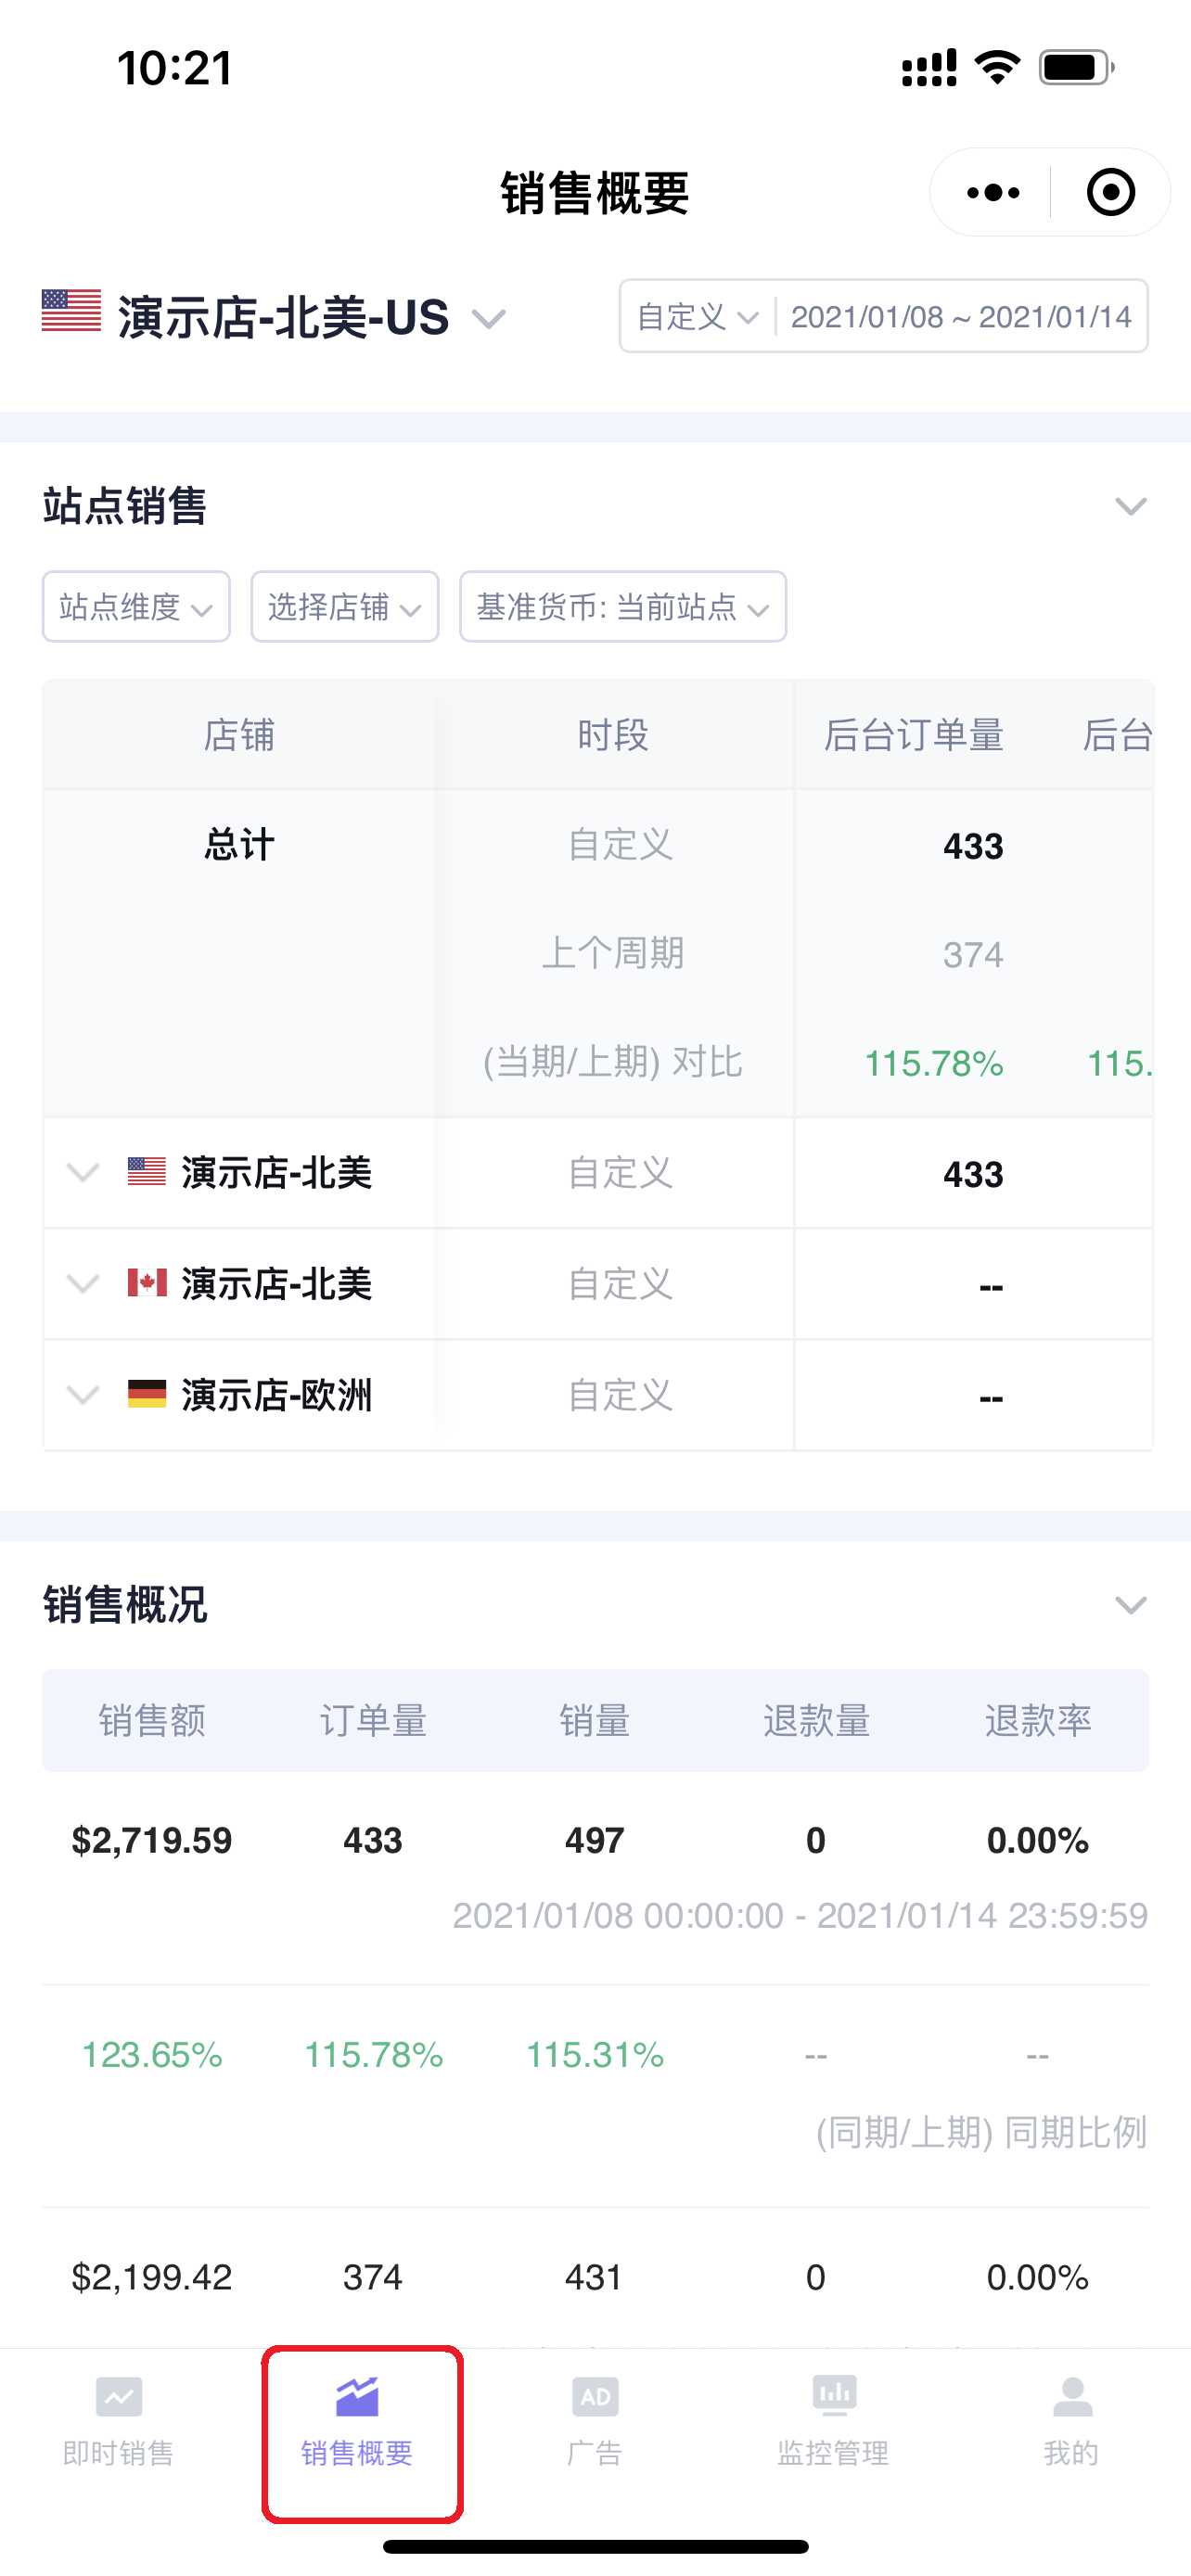
After logging in, select 【Sales Overview】 at the bottom of the page to enter the Sales Overview page;
 +
+
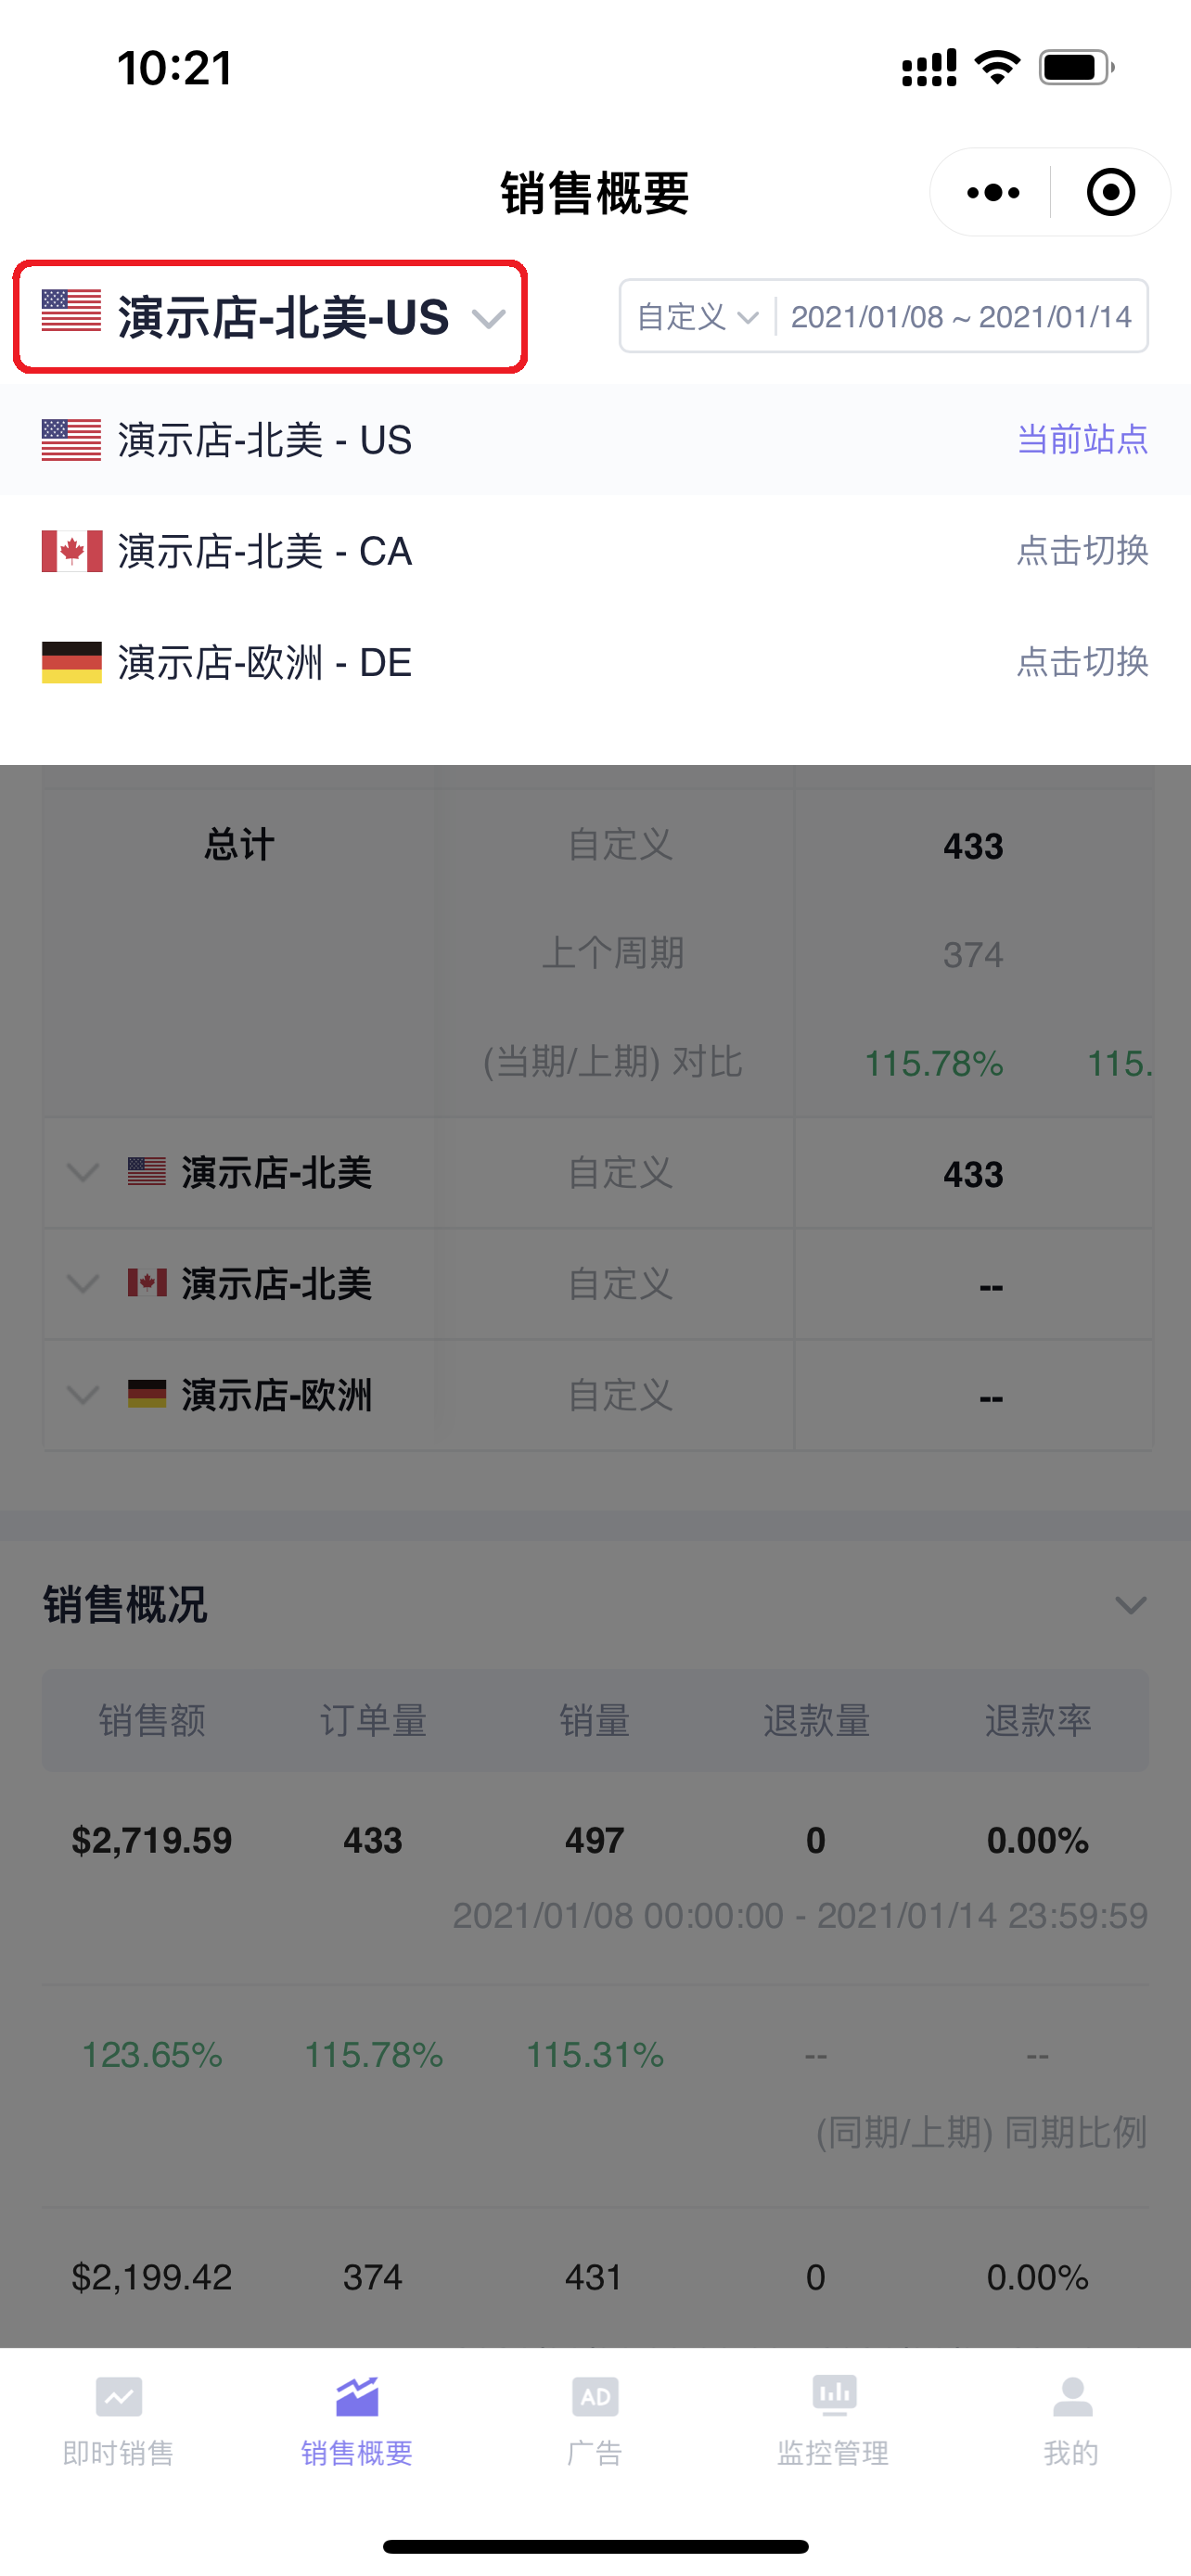
The Mobile APP defaults to displaying data for the default display marketplace store you set. Click the store name in the upper left corner of the page to switch stores and view the real-time sales data of the corresponding store;
 +
+
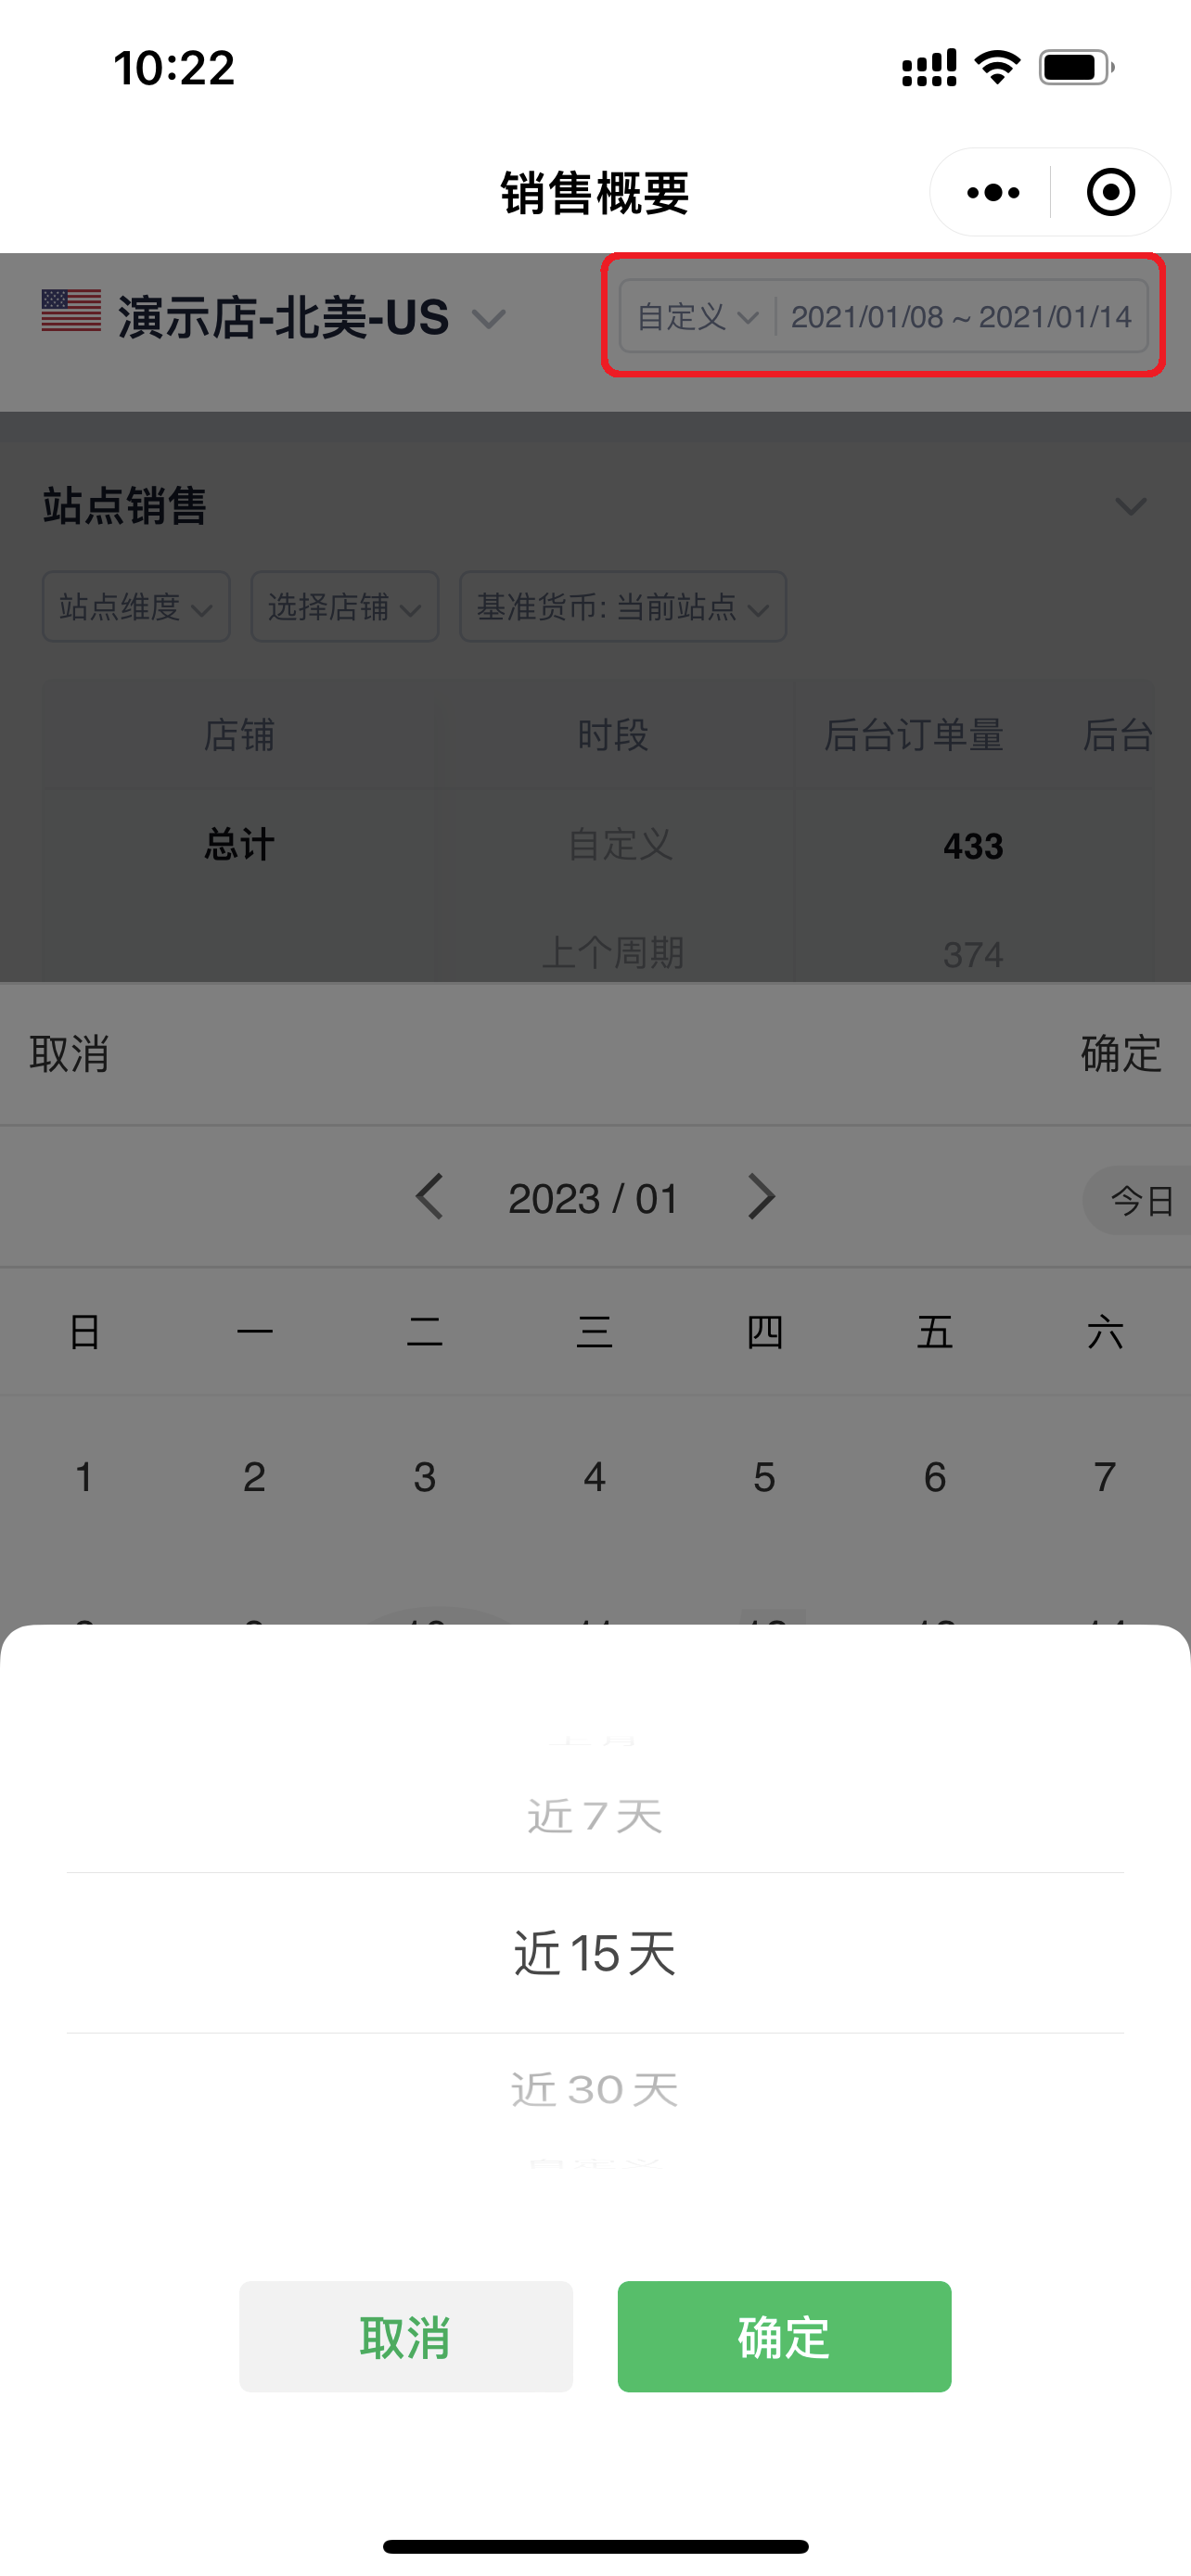
Sales Overview defaults to displaying data for the Last 7 Days. You can also select to view data for other time periods in the upper right corner of the page;
Supports selecting: Today, Yesterday, This Week, This Month, Last Month, Last 7 Days, Last 15 Days, Last 30 Days, or directly customize a time period to view;
 +
+
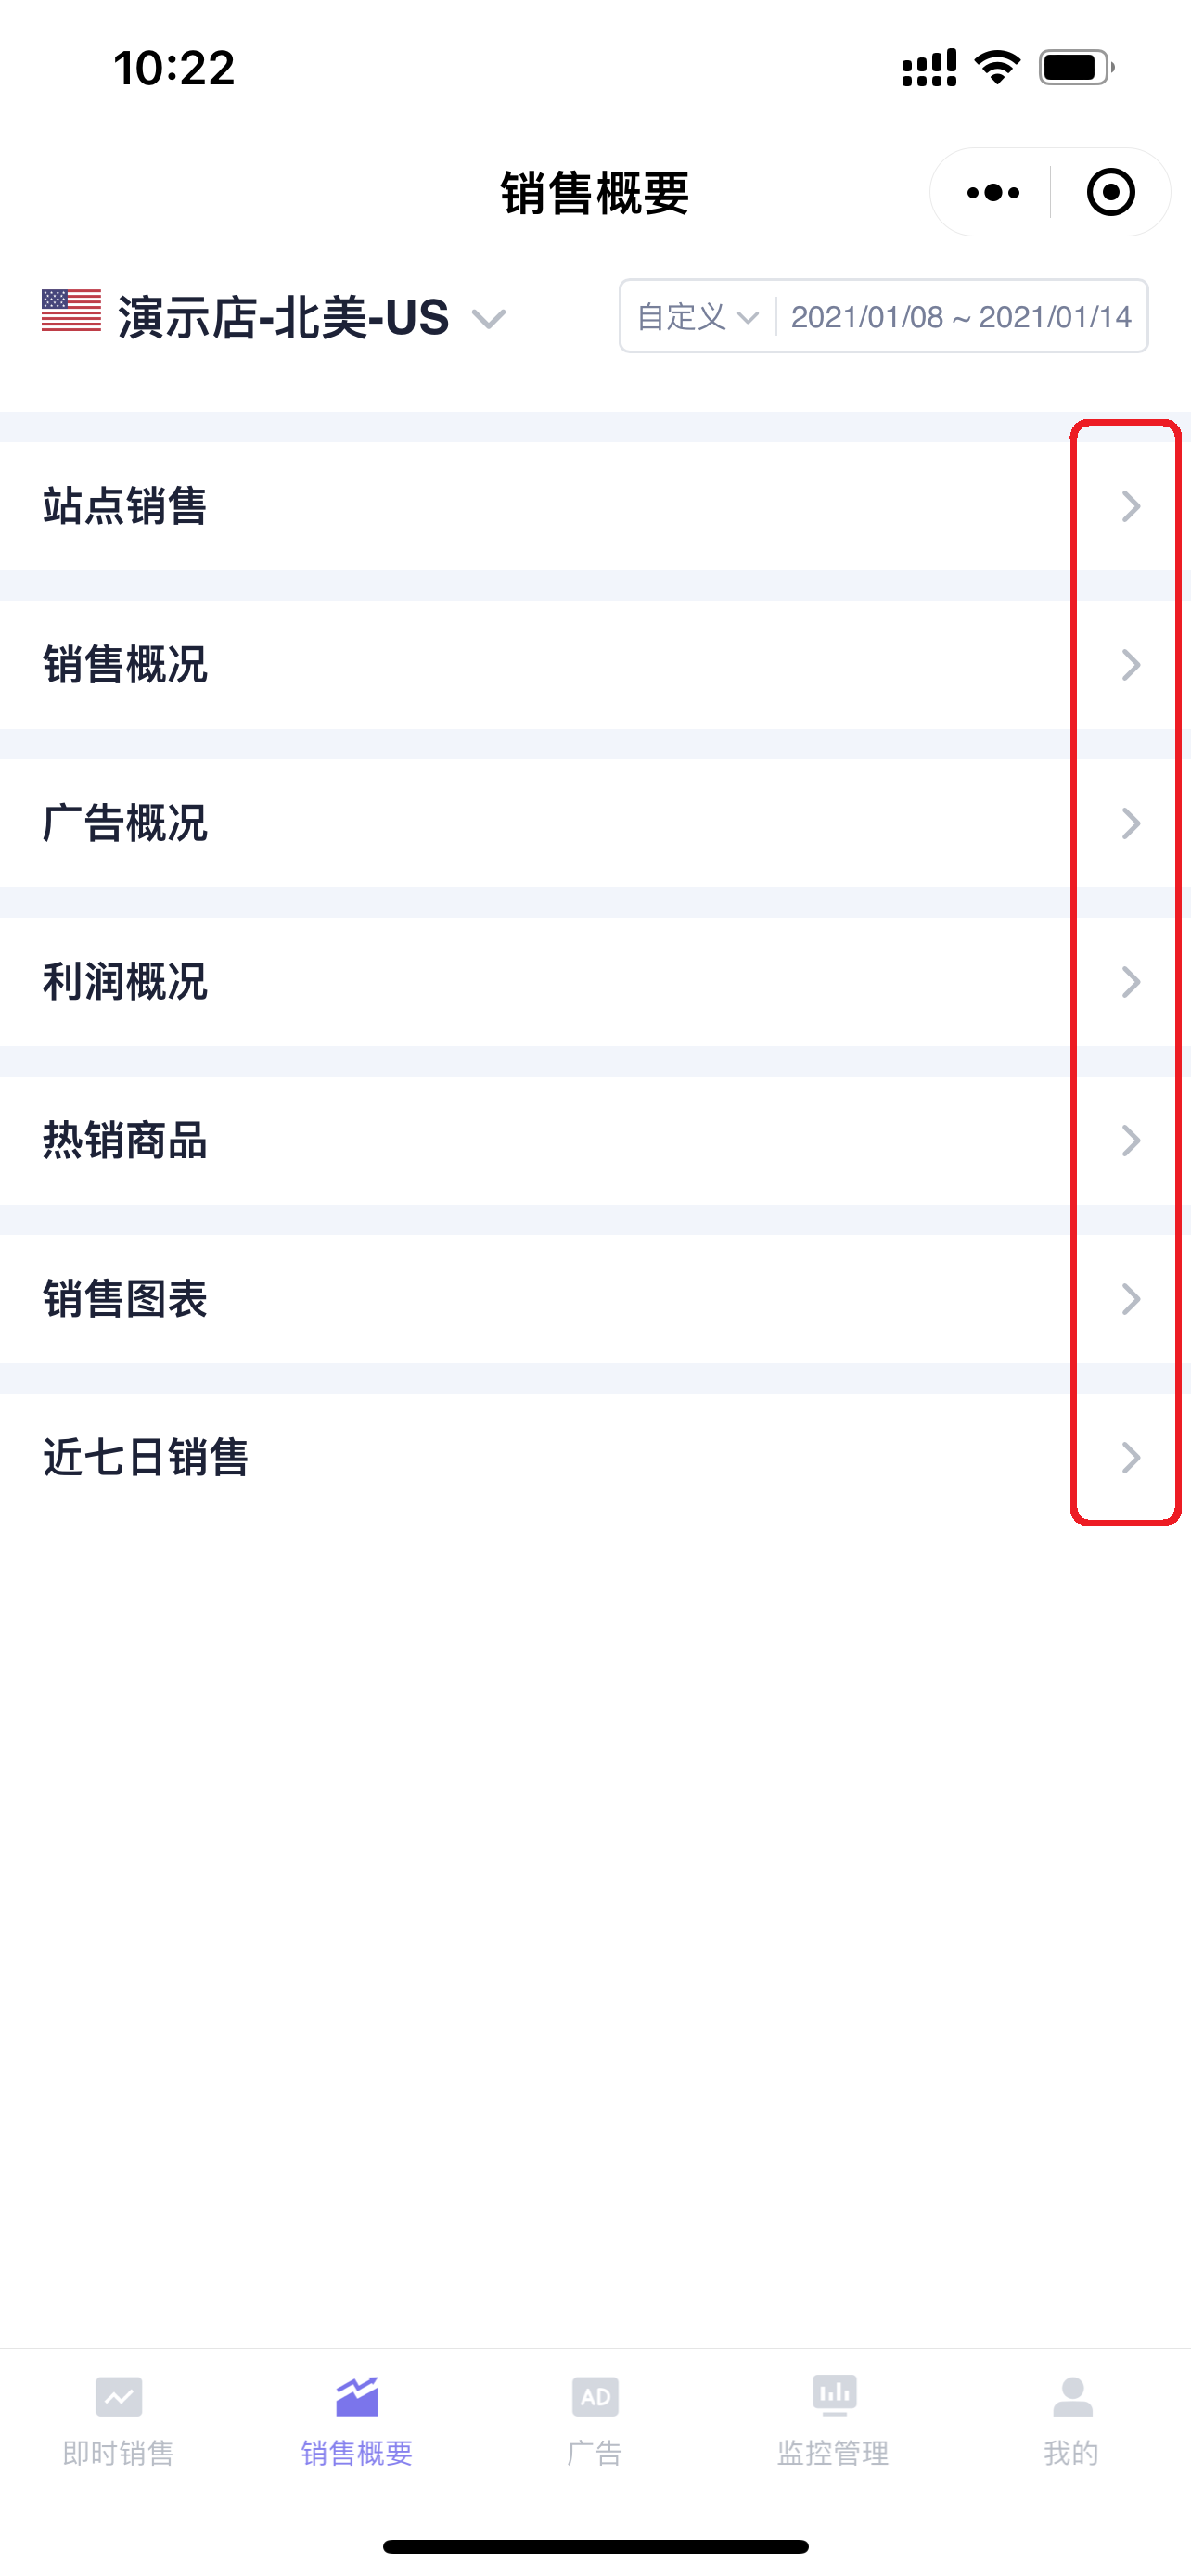
Sales Overview includes 7 major data sections: Marketplace Sales, Sales Overview, Advertising Overview, Profit Overview, Best-Selling Products, Sales Charts, and Last 7 Days Sales.
Click the expand button on the right side of the section to open or collapse the section, making it easy for you to quickly view data.
 +
+
1. Marketplace Sales
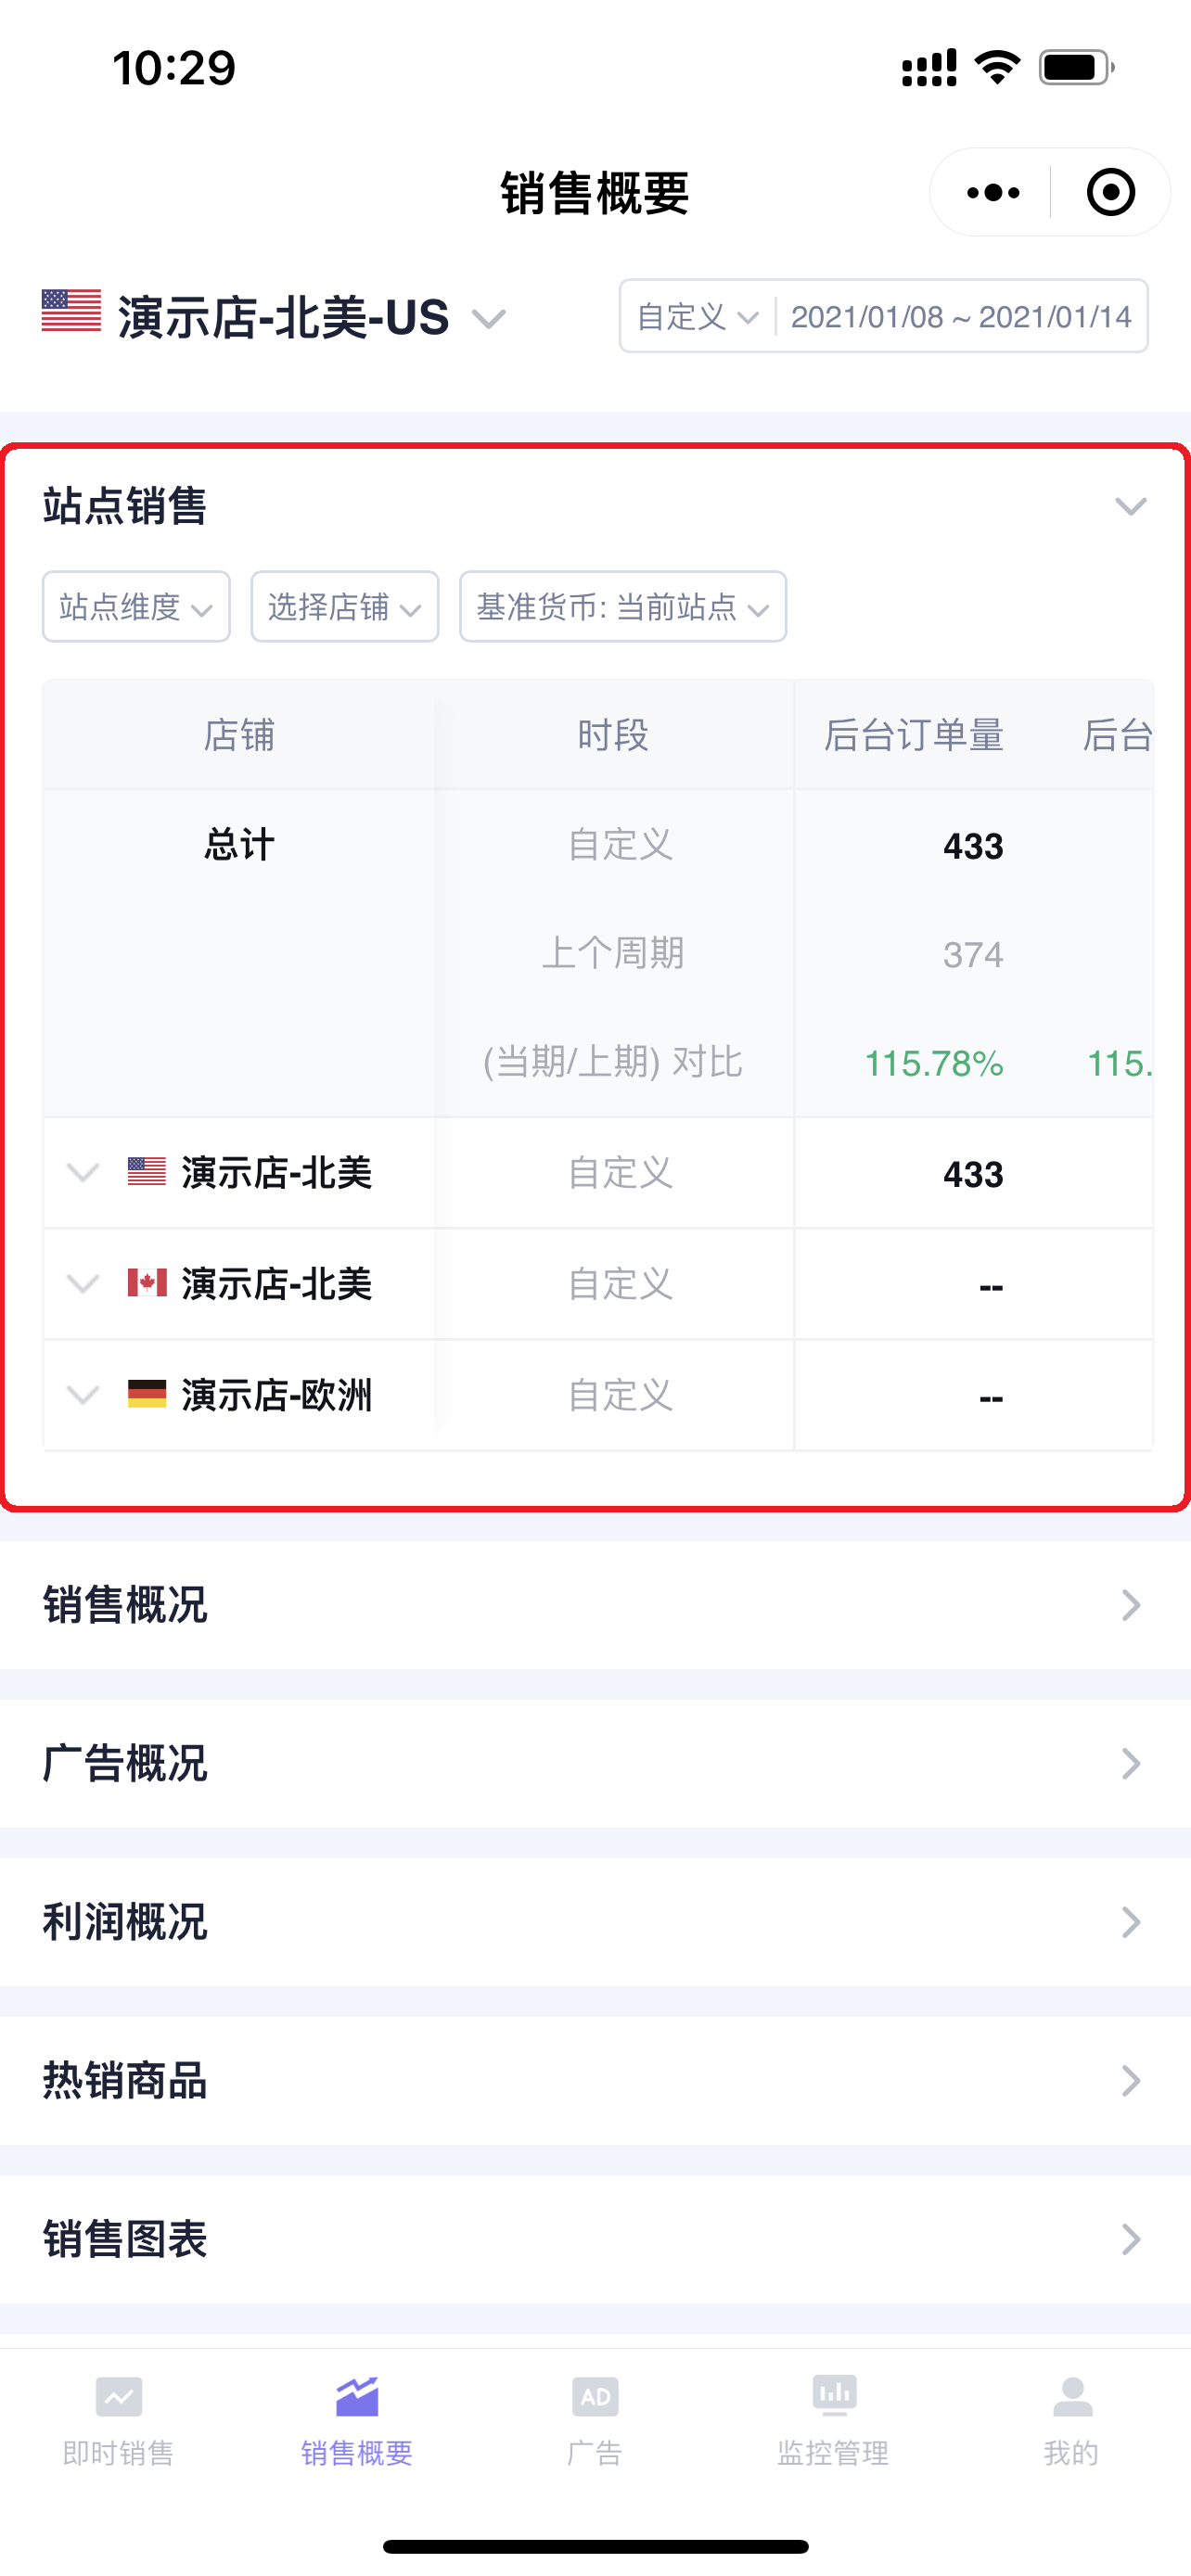
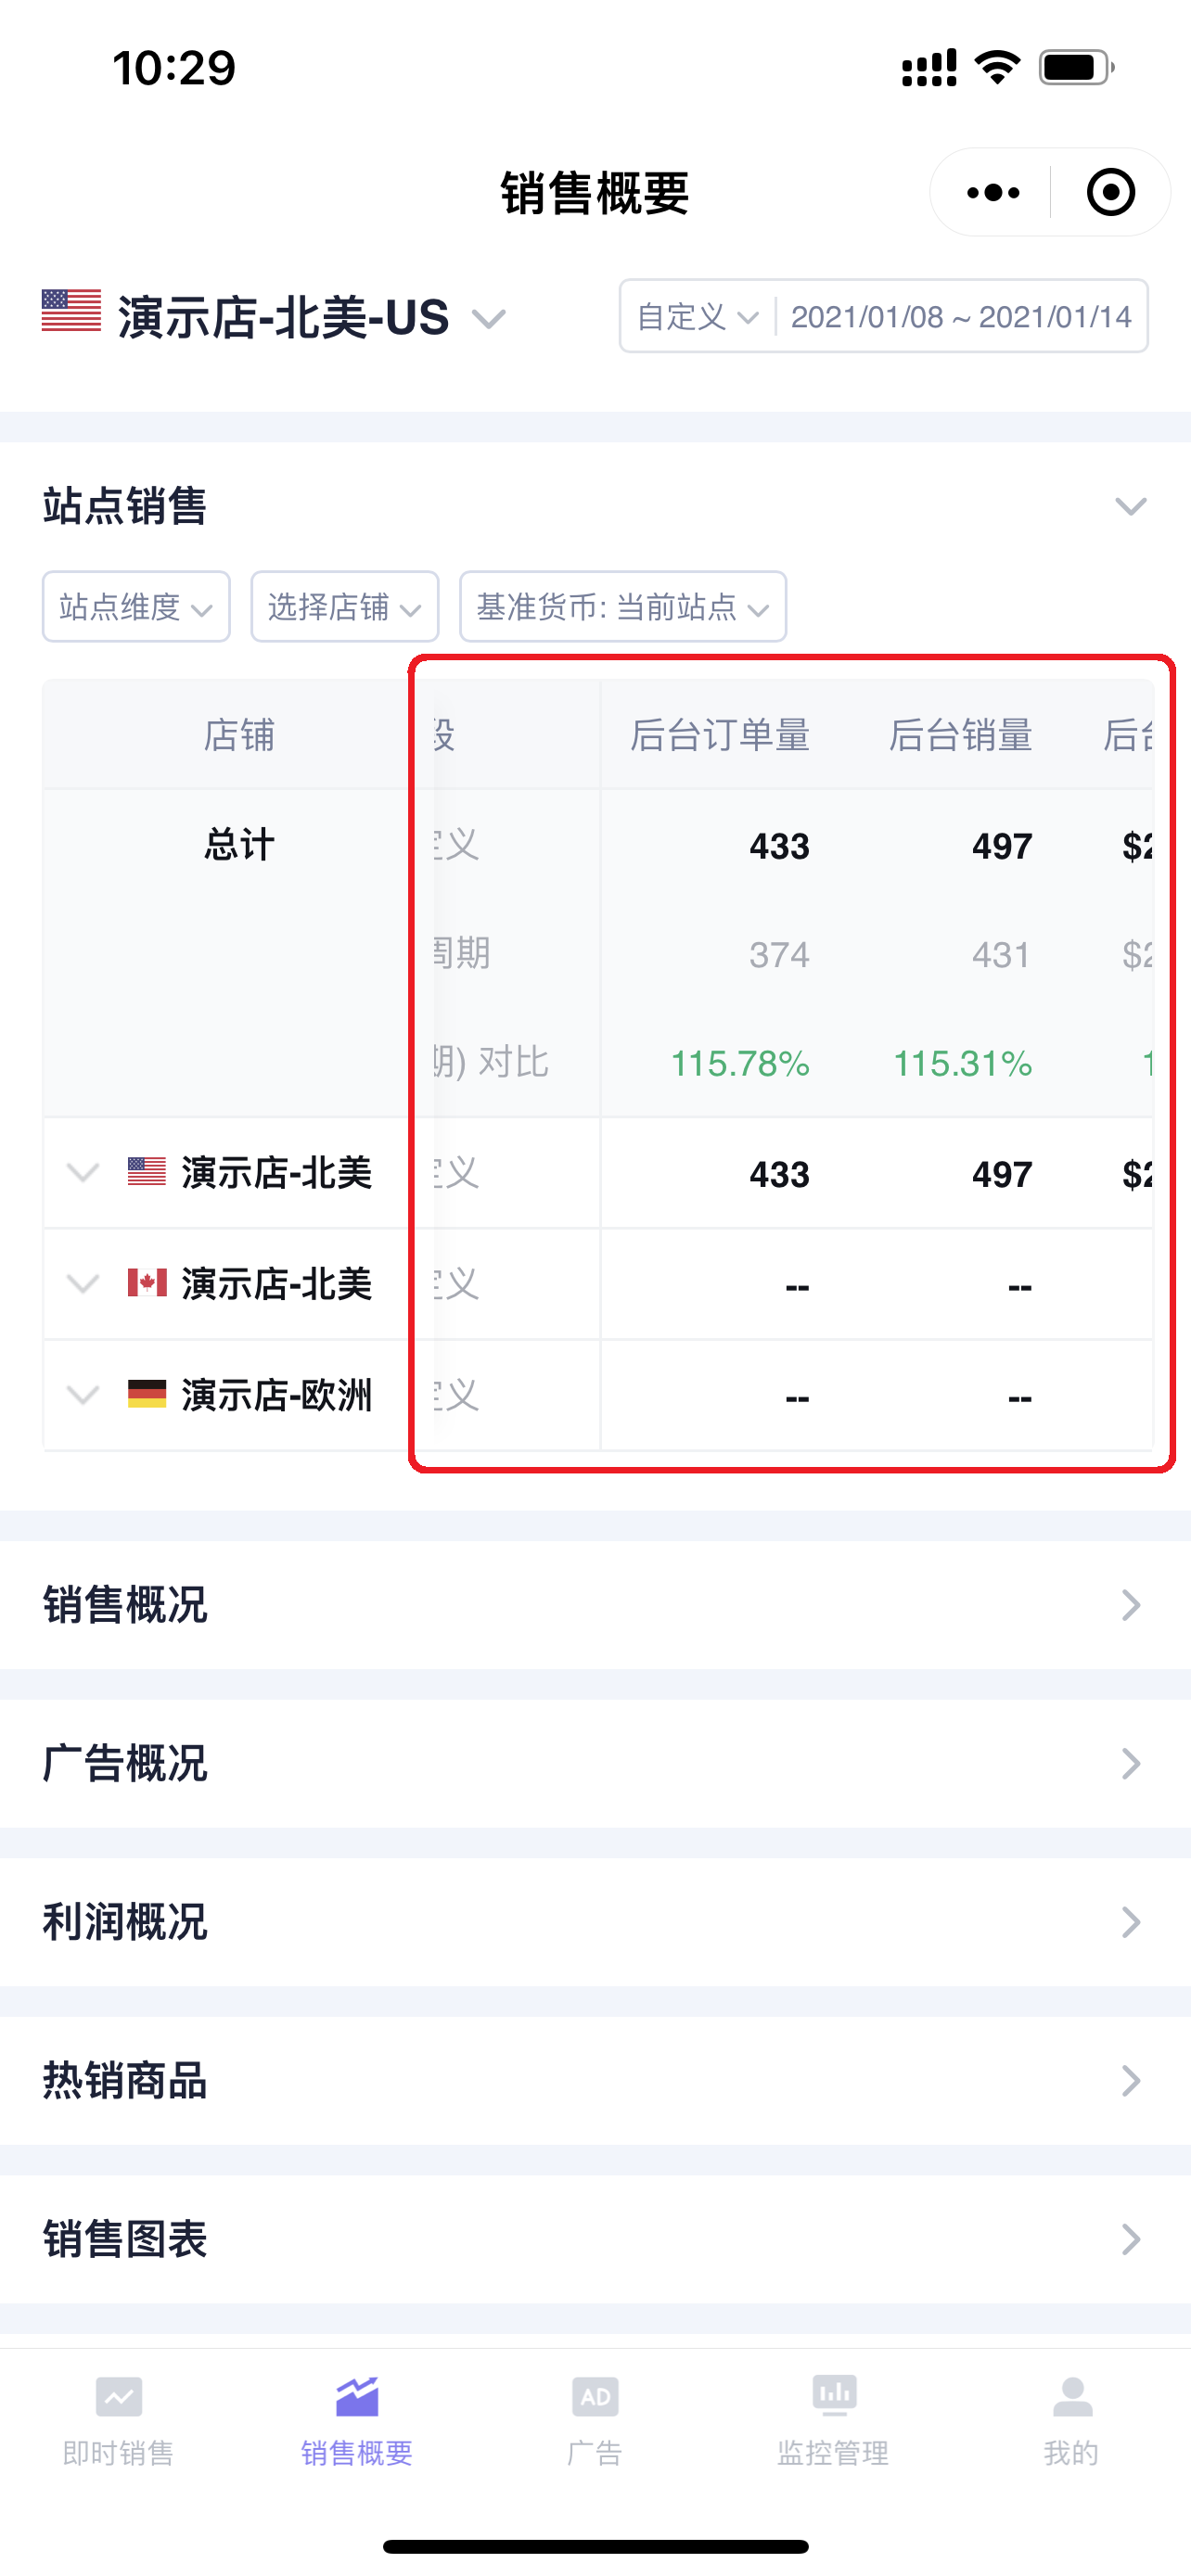
The Marketplace Sales section displays the sales details and summary data of all your authorized stores for the current time period,
including: Sales data, Order data, Refund data, Advertising data, Expenditure data, Product costs, Profit data, Traffic click-through rate data, Inventory data, Review data, Hijack Monitoring data, and other 40+ data points.
 +
+
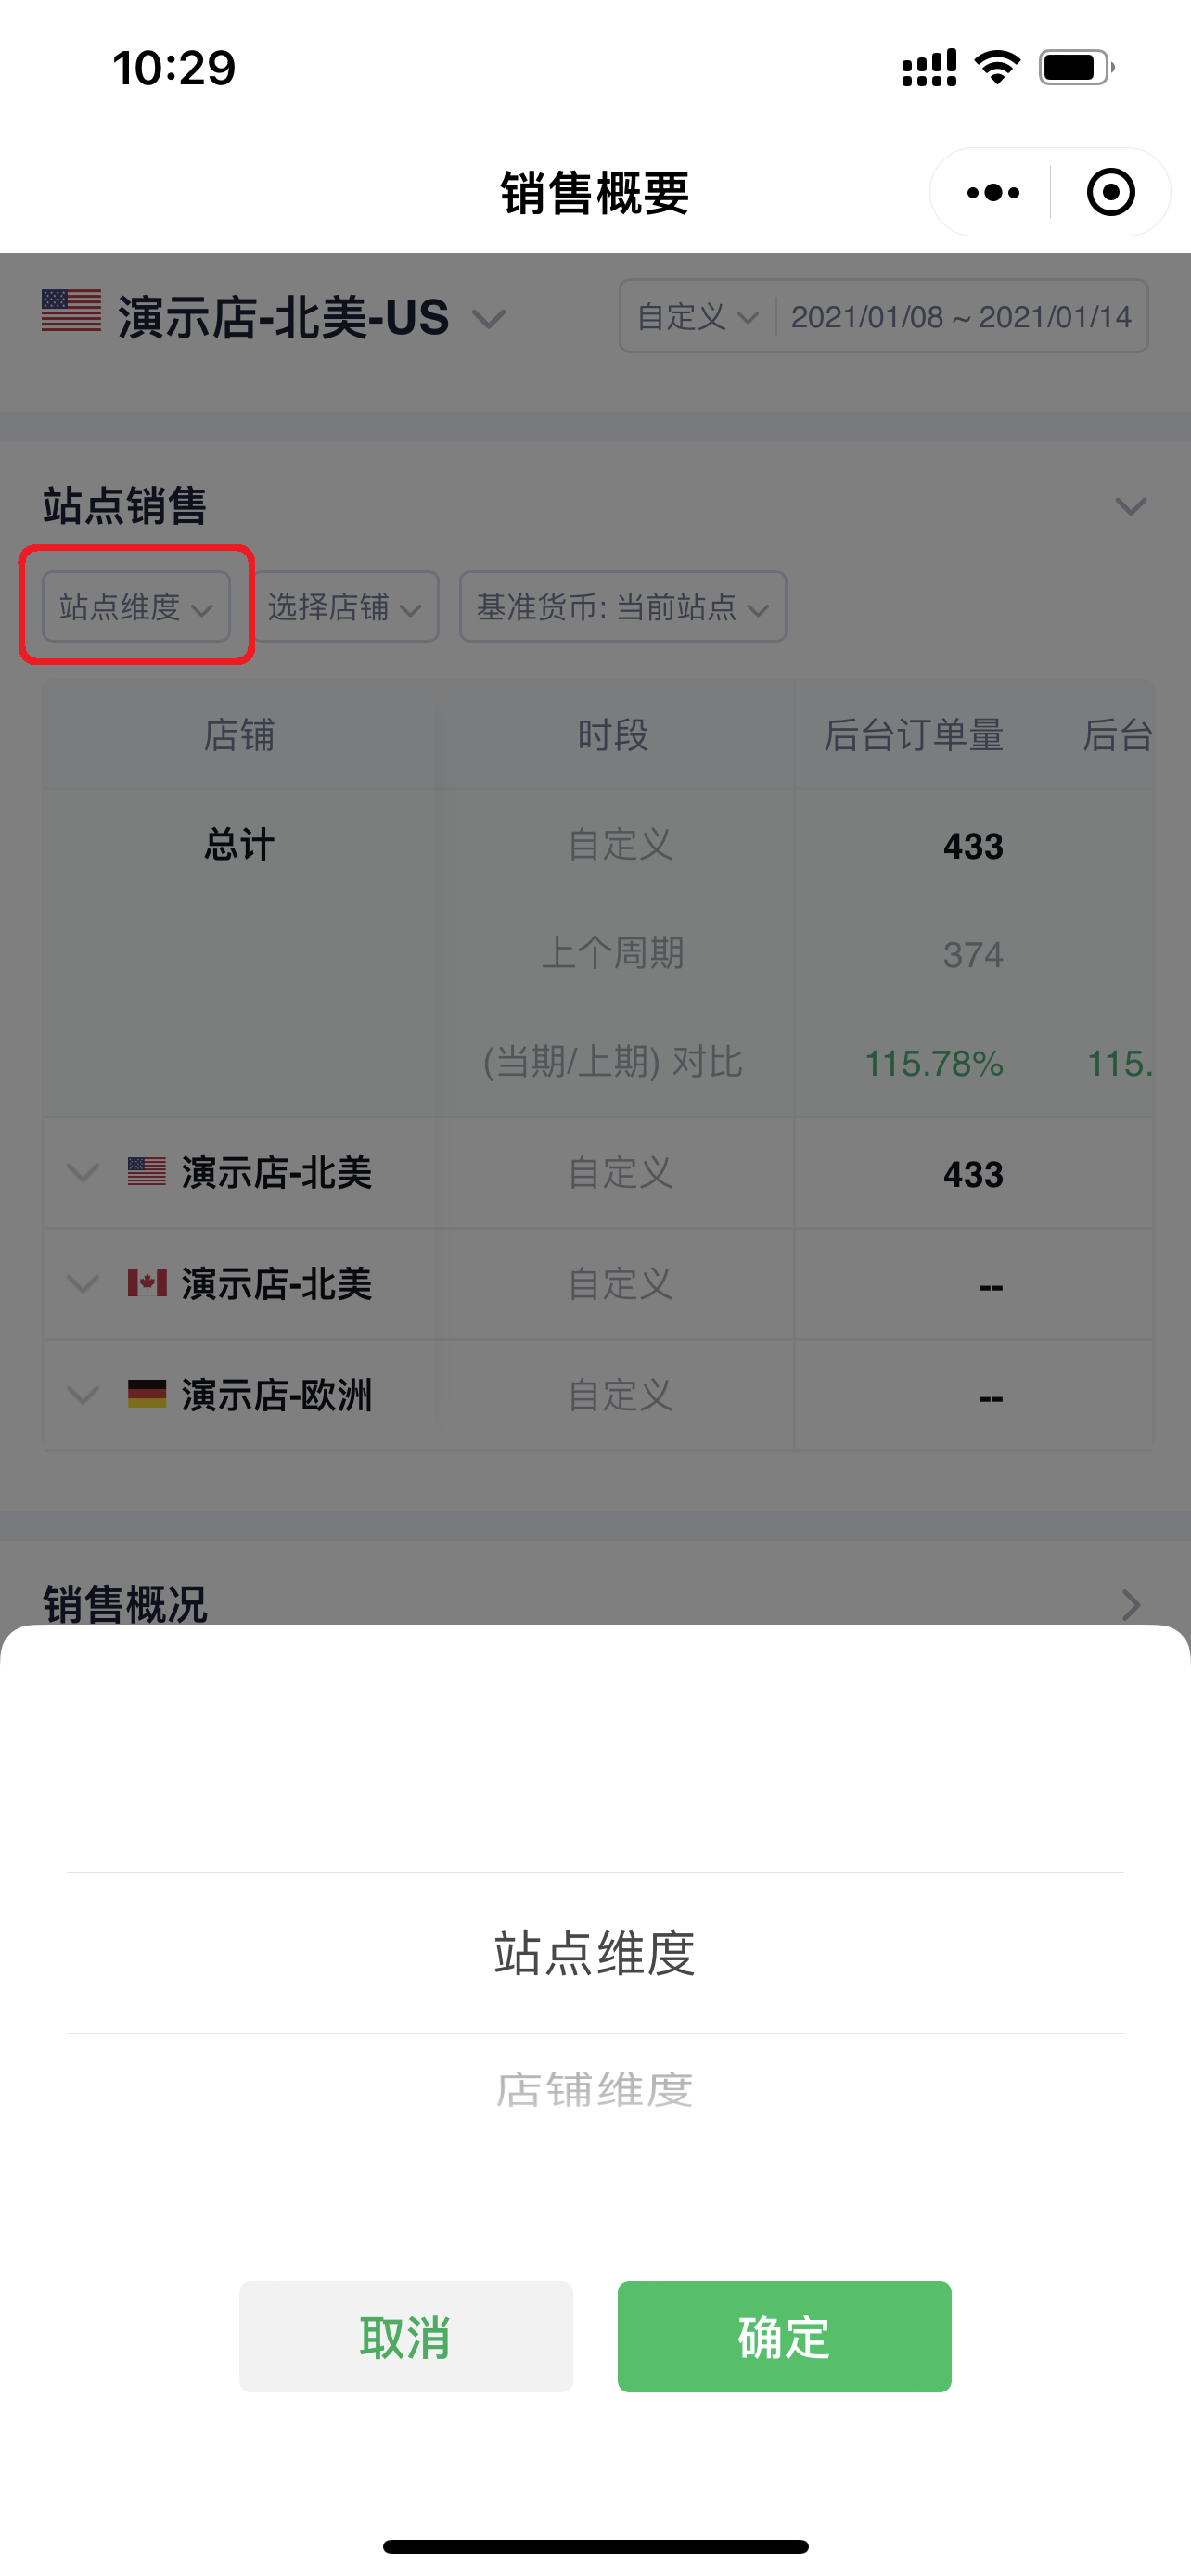
Click 【Marketplace Dimension】 in the upper left corner to switch the viewing dimension: Marketplace/Store;
Note: According to Amazon Global Selling rules, one store (account) can register and open multiple marketplaces. Therefore, you can switch to view and analyze your sales situation by marketplace or store dimension.
 +
+
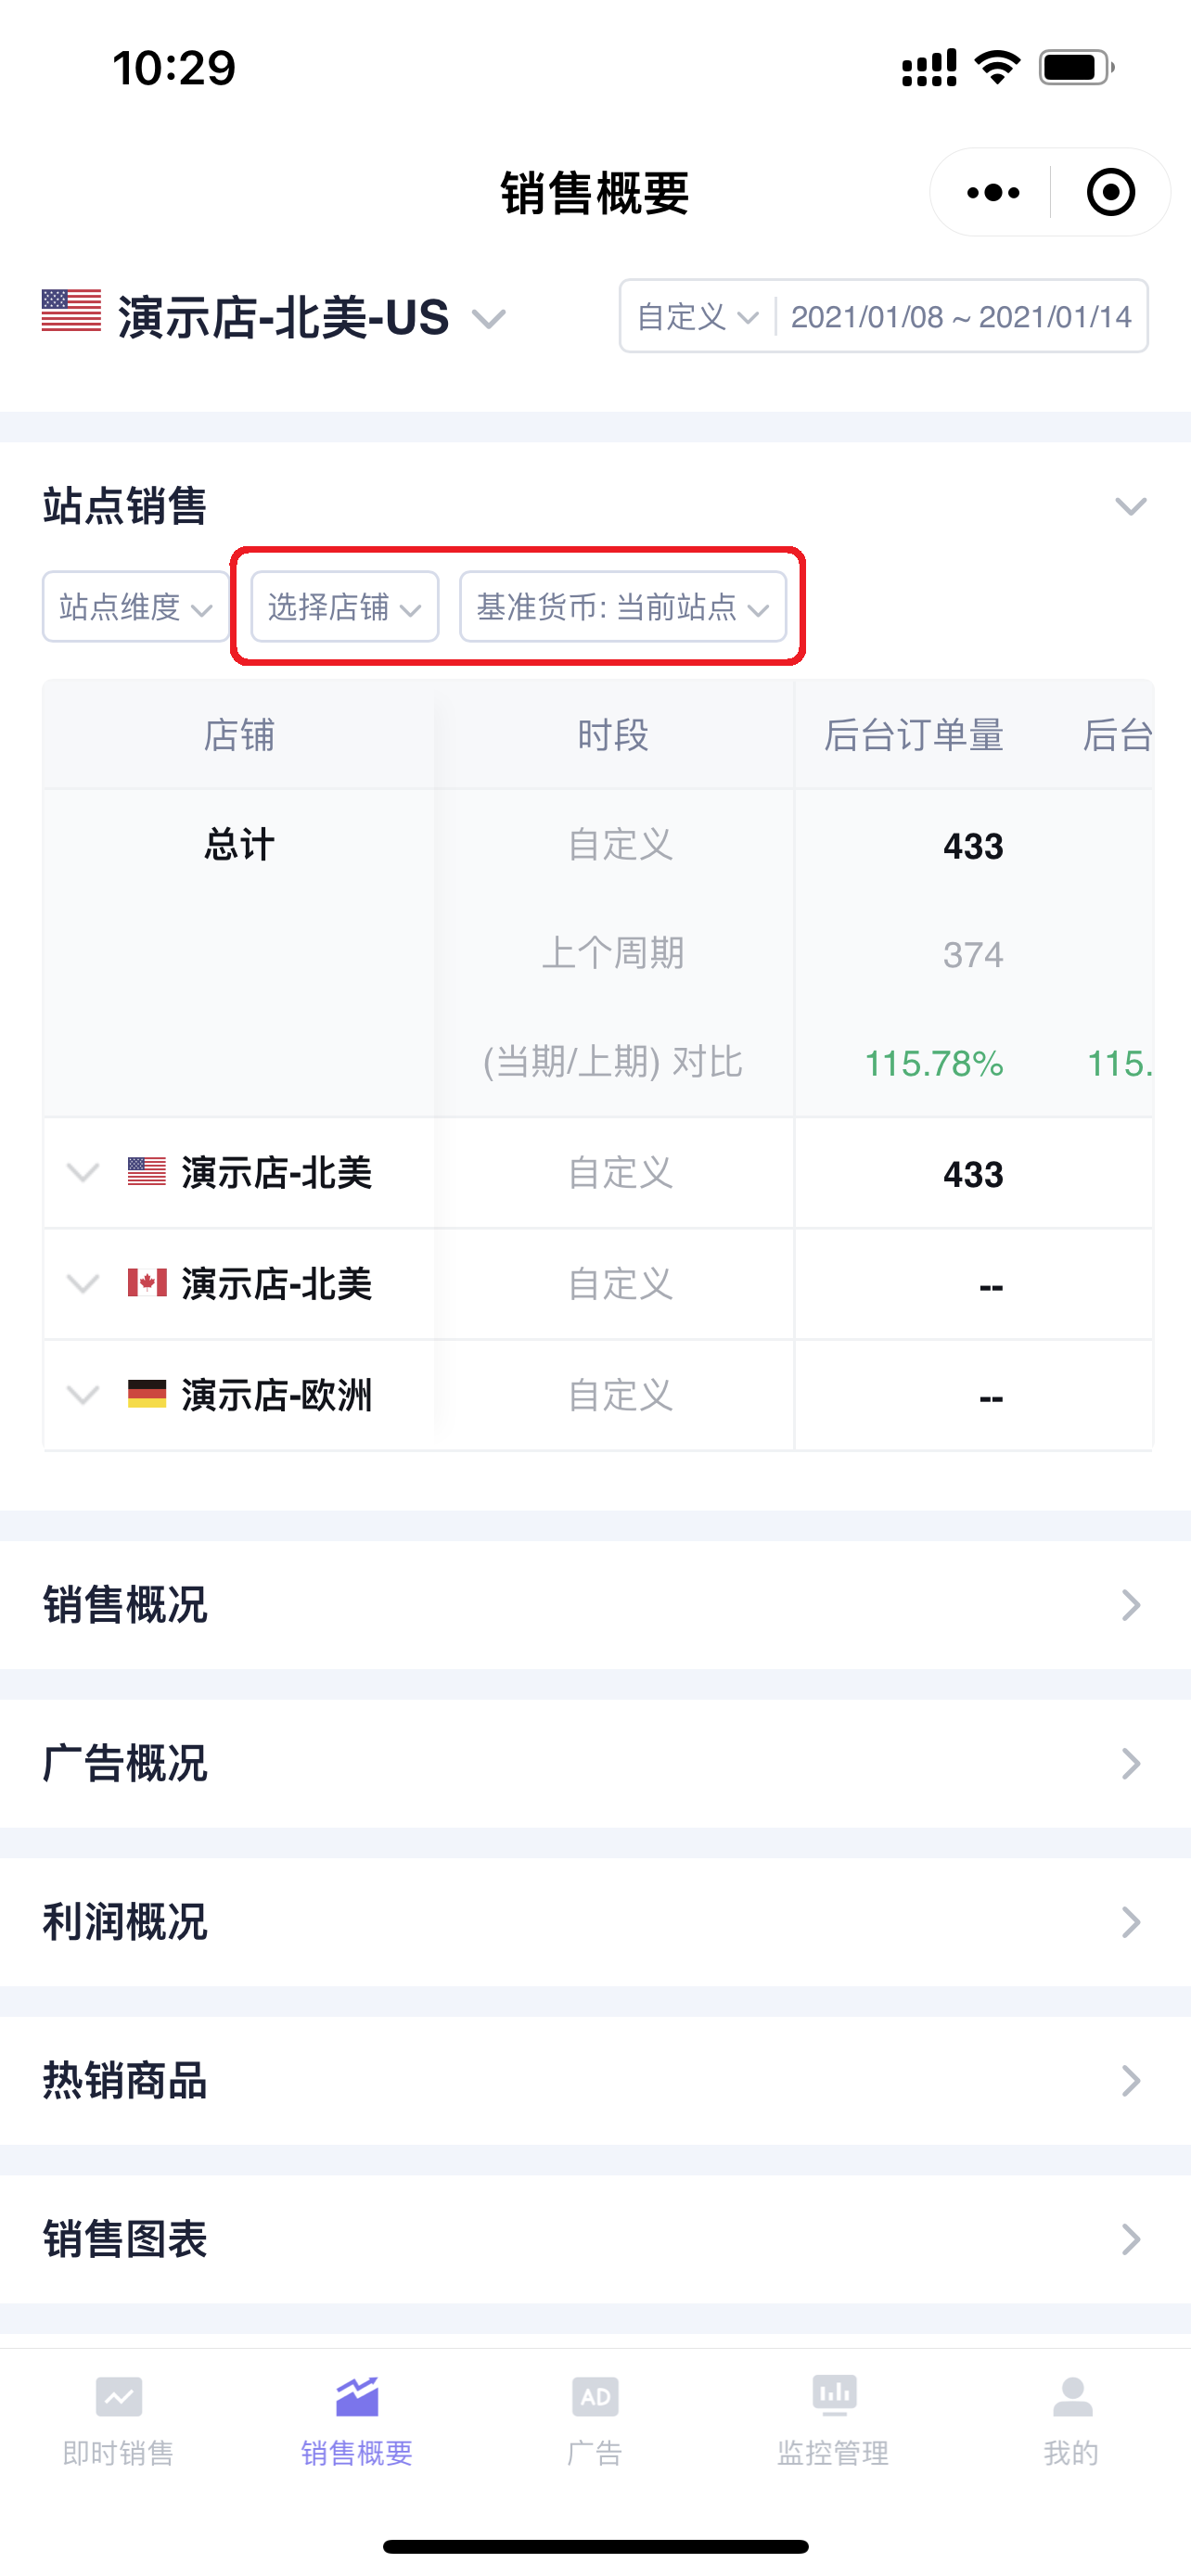
You can select the store you want to view and the base currency for aggregation;
 +
+
Slide the data bar left and right to view all data details;
 +
+
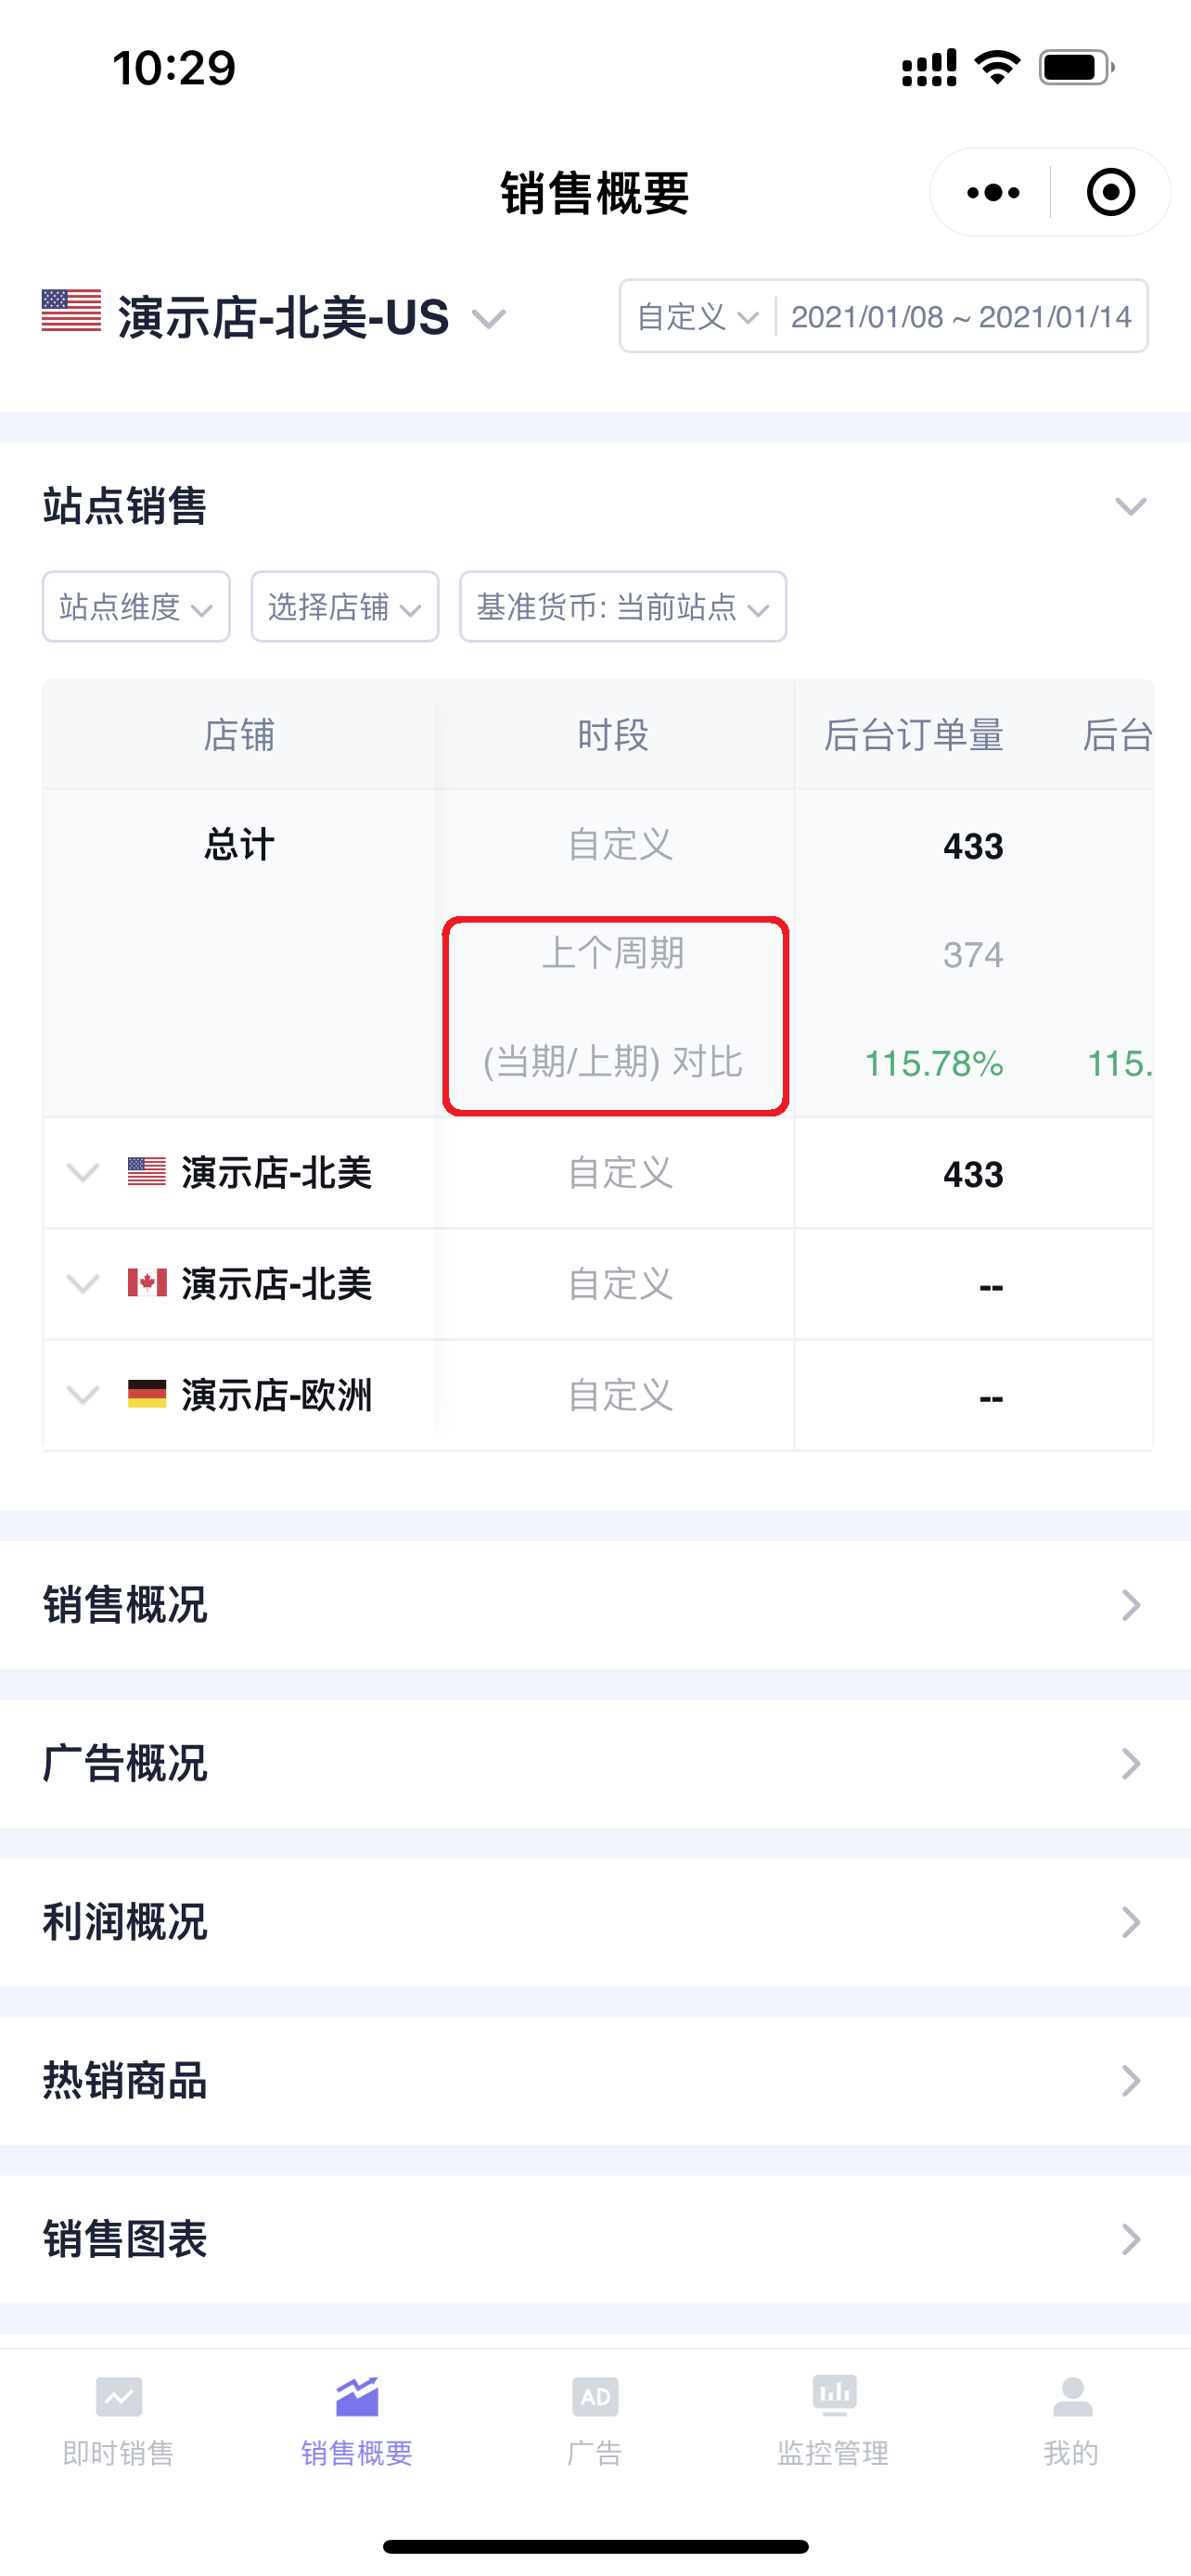
SellerSpace also supports comparing the current period data with the data from the same period last time to analyze sales changes and make timely adjustments.
Click the expand button on the left side of the store to open the same period comparison data.
 +
+
2. Sales Overview
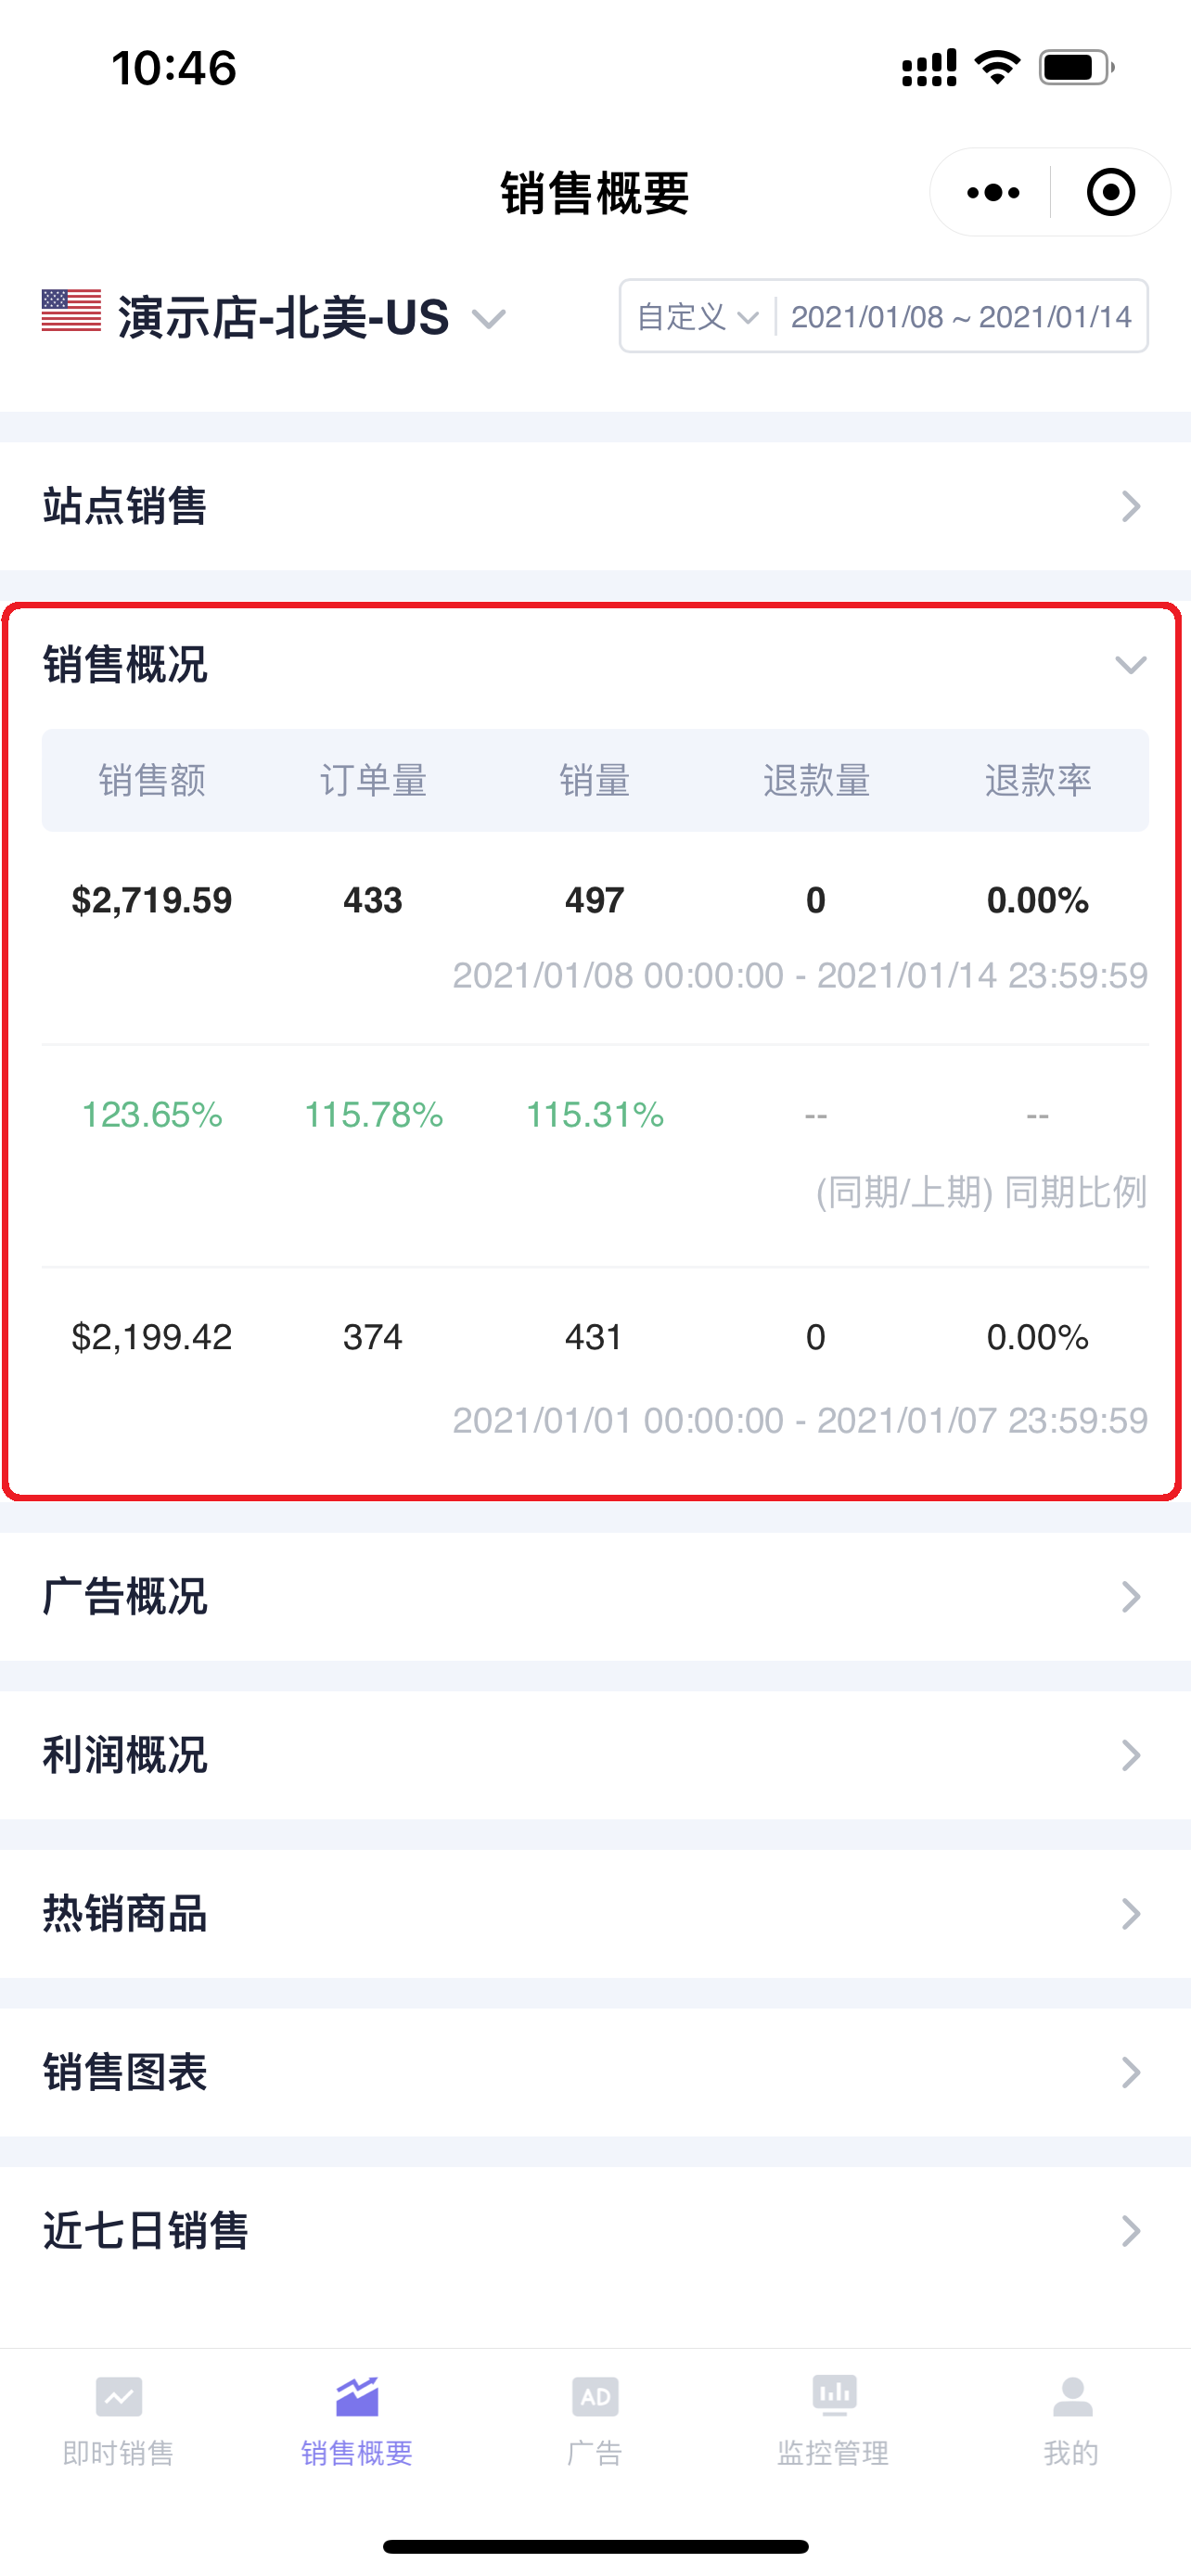
The Sales Overview section displays sales-related data for the current store in the selected time period, including: Sales Revenue, Order Volume, Units Sold, Refunds, Refund Rate.
Sales Overview also supports same-period comparison to help you analyze sales changes.
 +
+
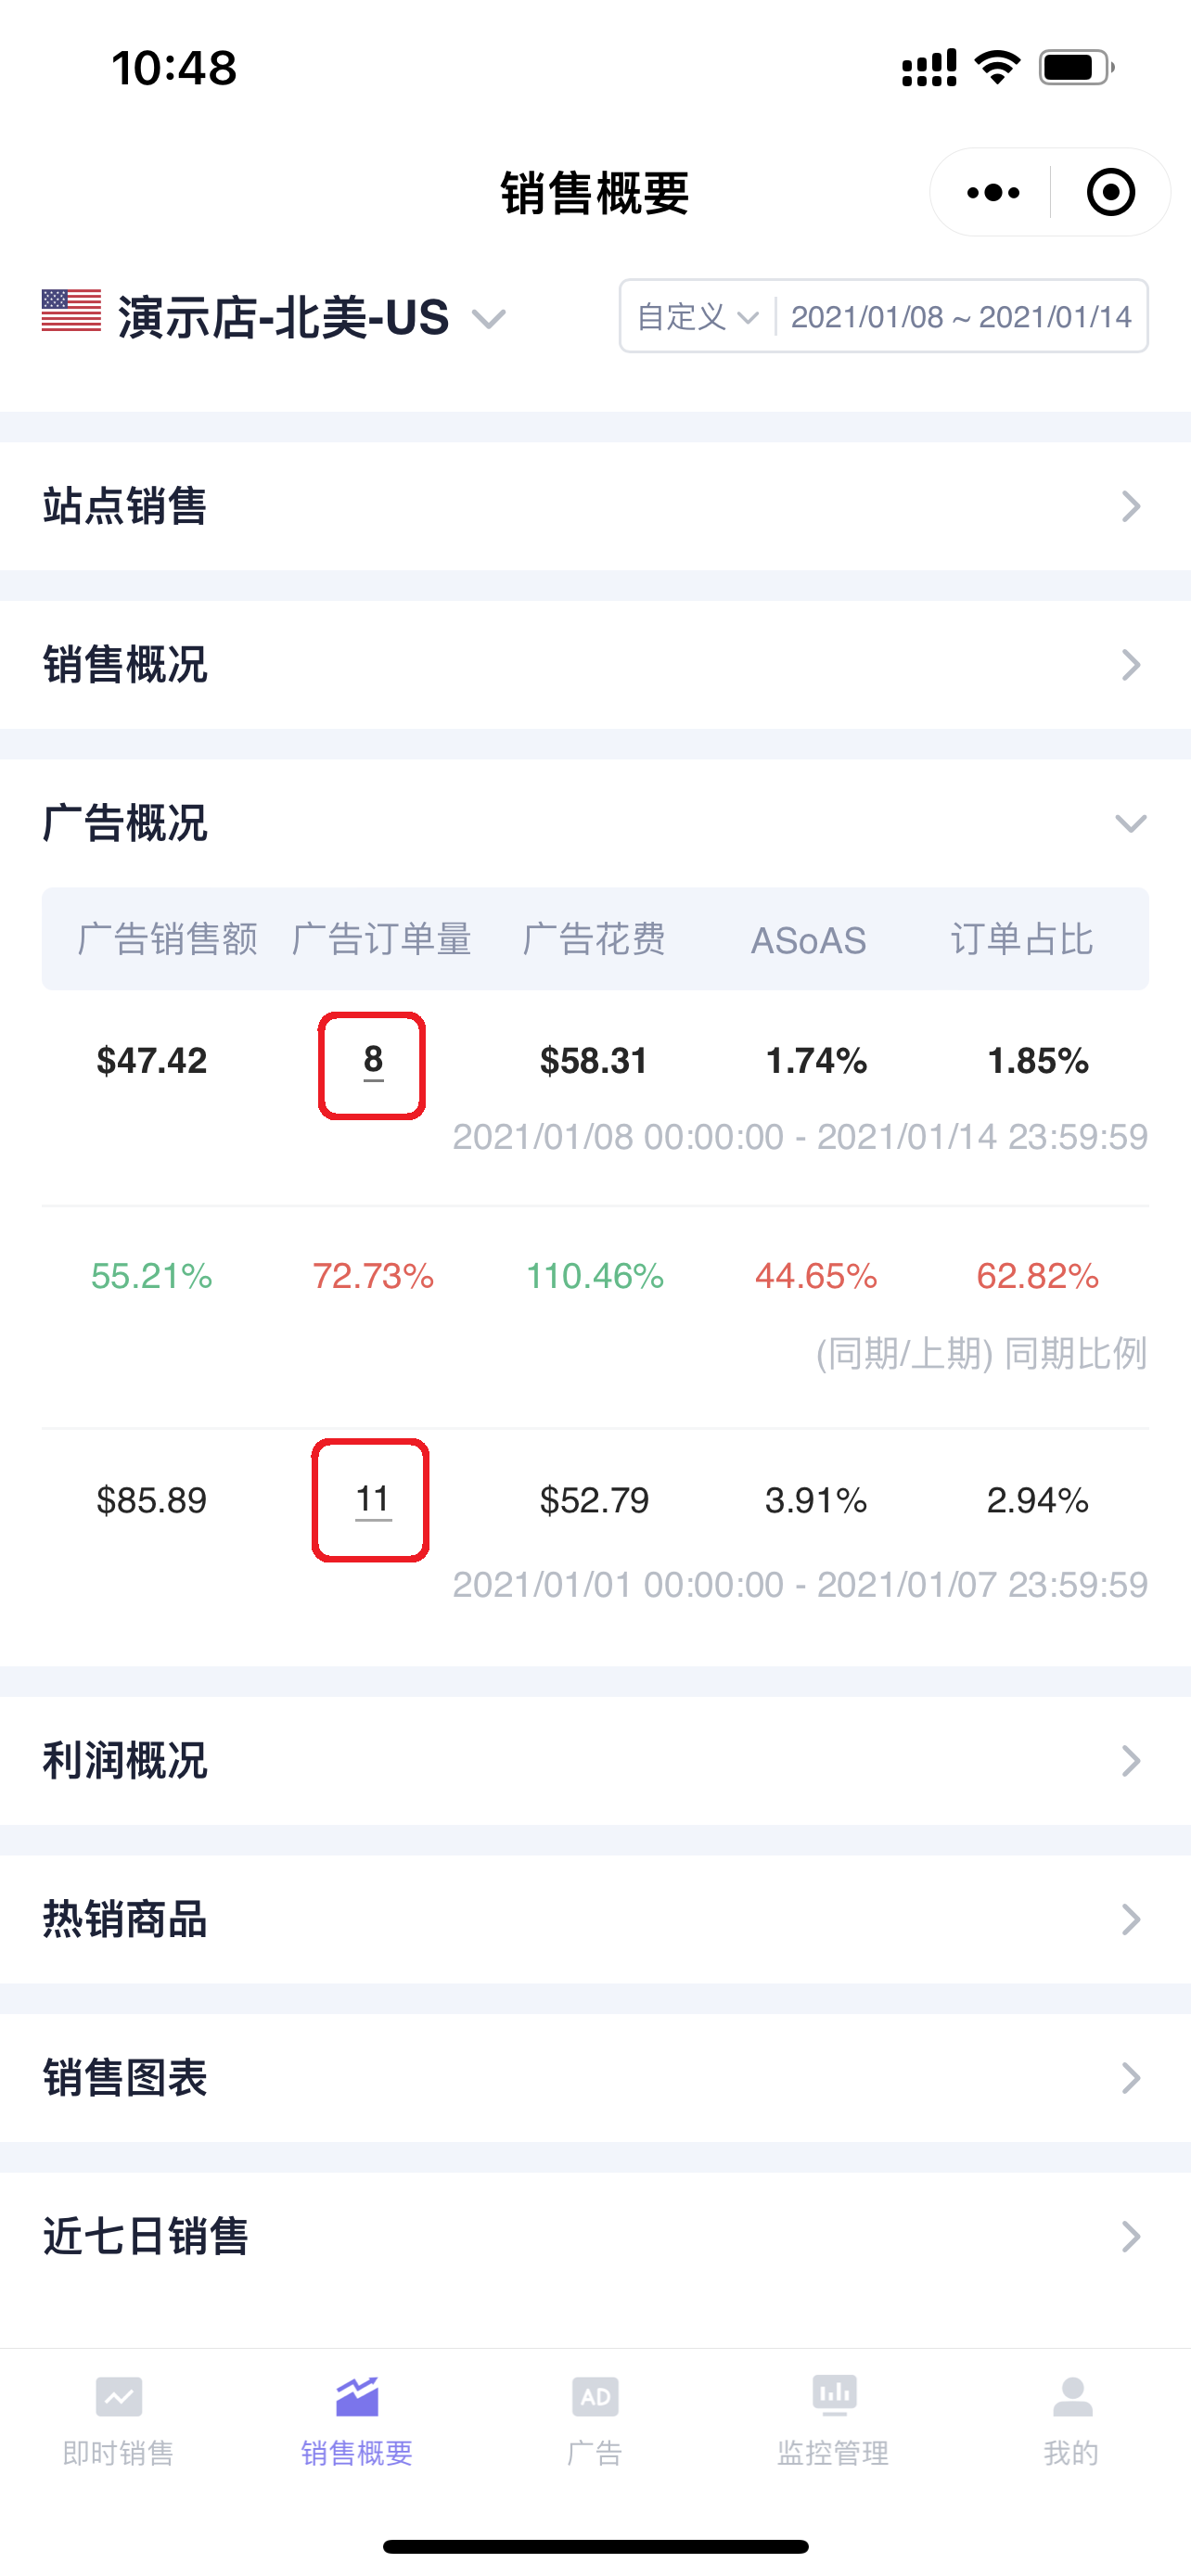
3. Advertising Overview
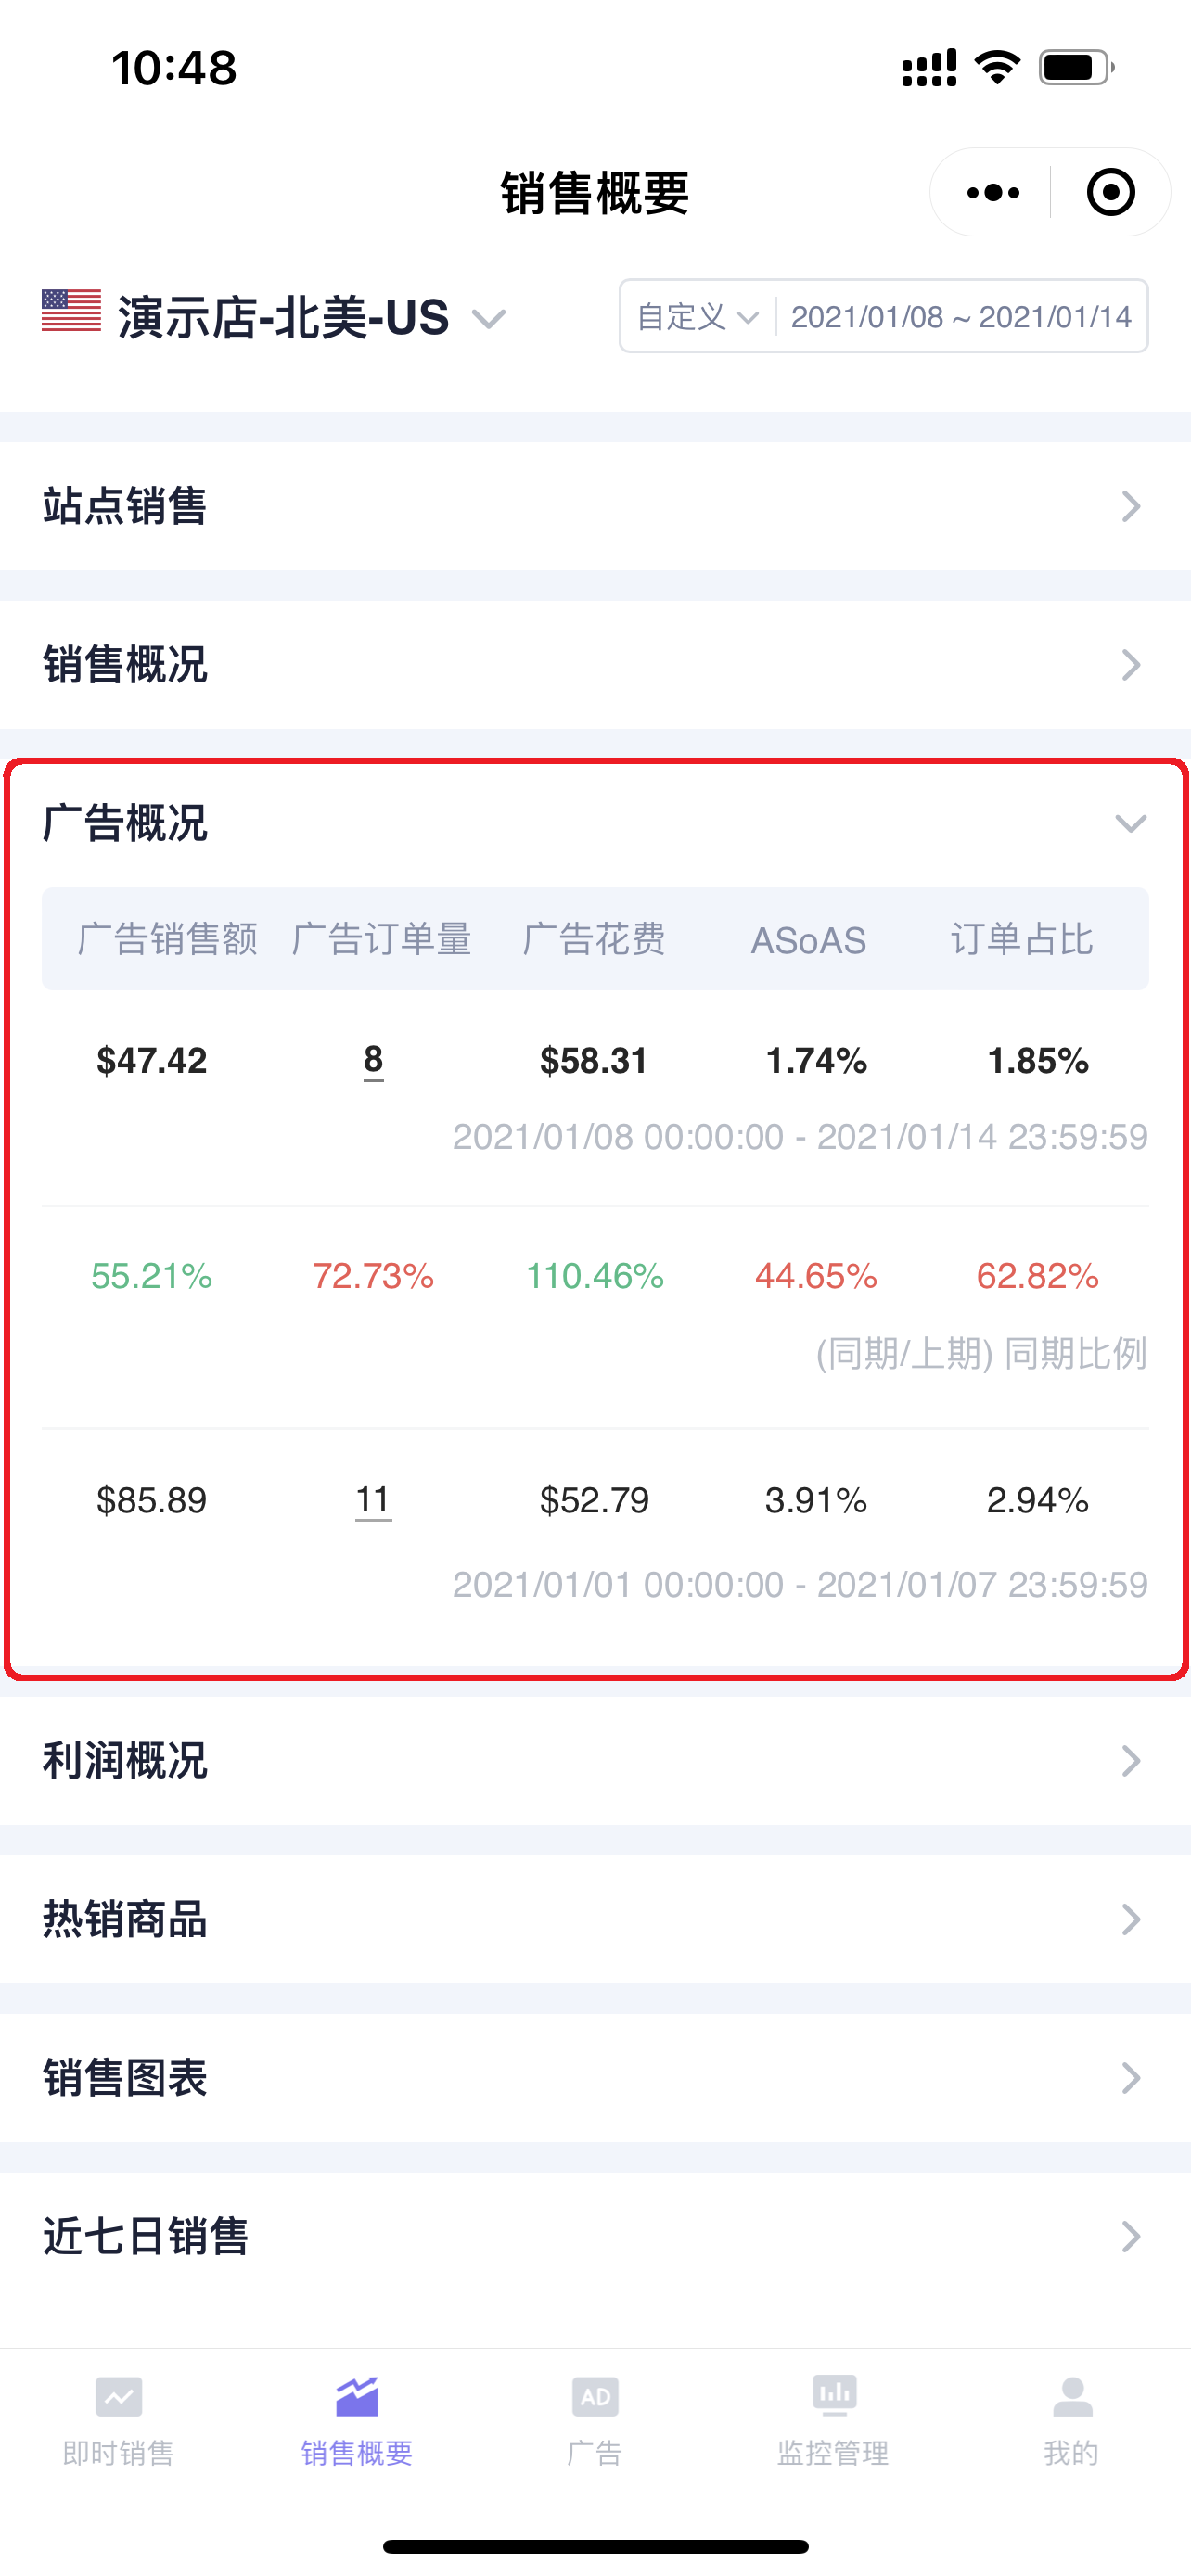
The Advertising Overview section displays advertising overview data for the current store in the selected time period, including: Advertising Sales, Advertising Orders, Advertising Spend, ASoTS (Advertising Sales as a Percentage of Total Sales), Advertising Order Percentage.
Advertising Overview also supports same-period comparison to help you analyze changes in advertising performance.
 +
+
In SellerSpace, all underlined values support clicking to view details or jump to adjust data;
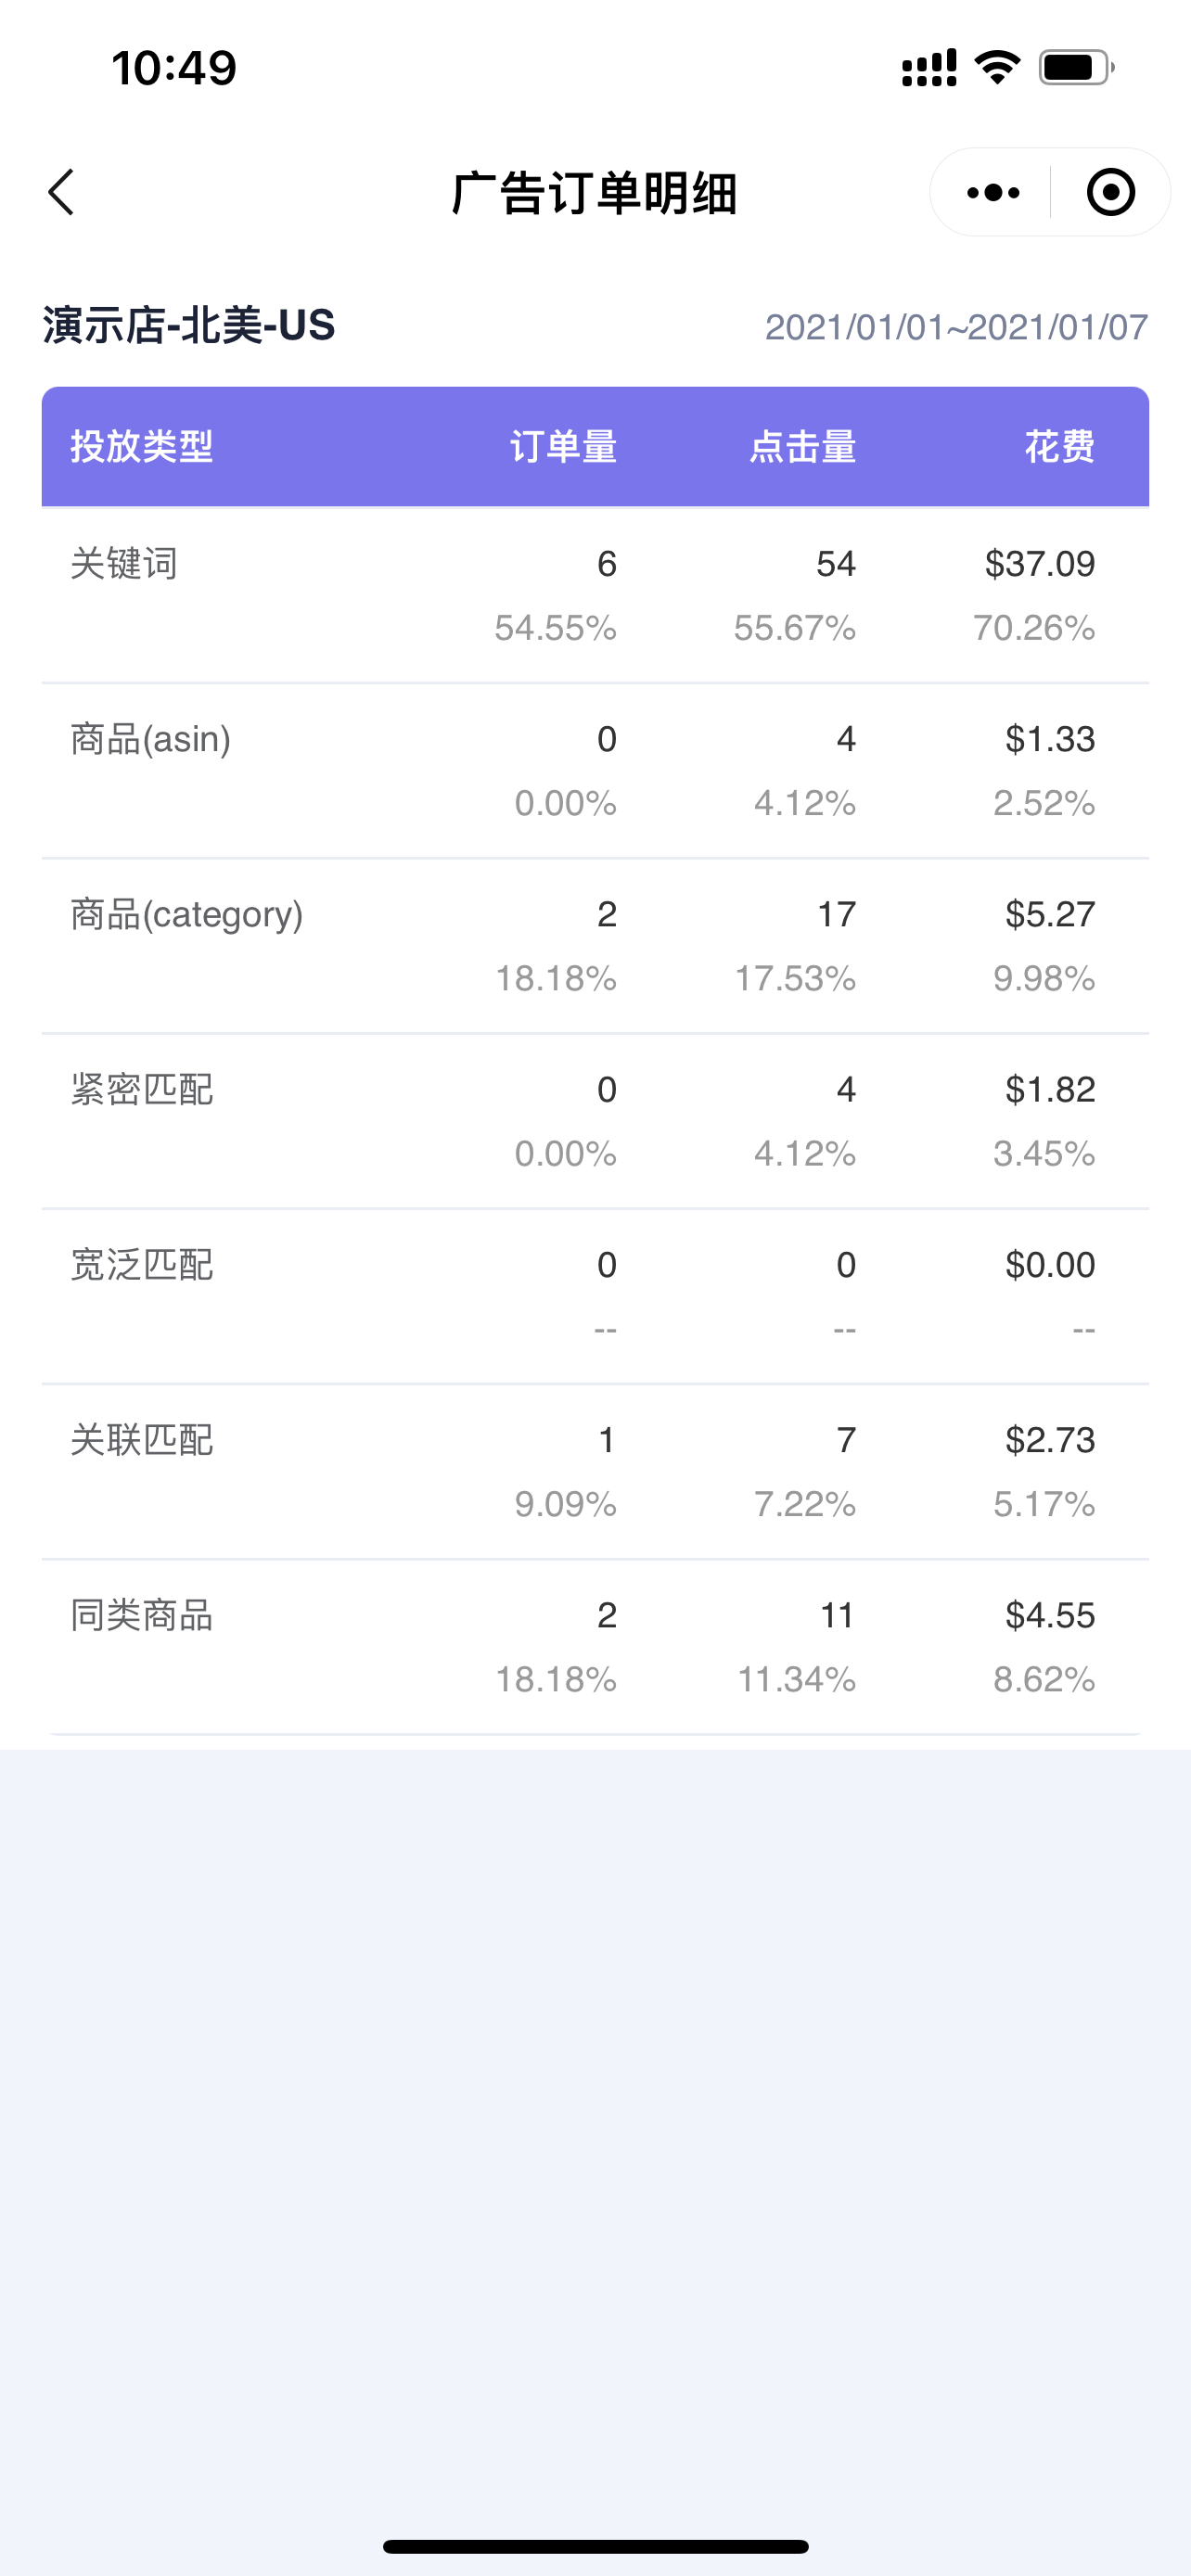
Click Advertising Orders to view advertising order details, such as: sales by campaign type and the percentage of sales from each type;
 +
+
Advertising Order Details:
 +
+
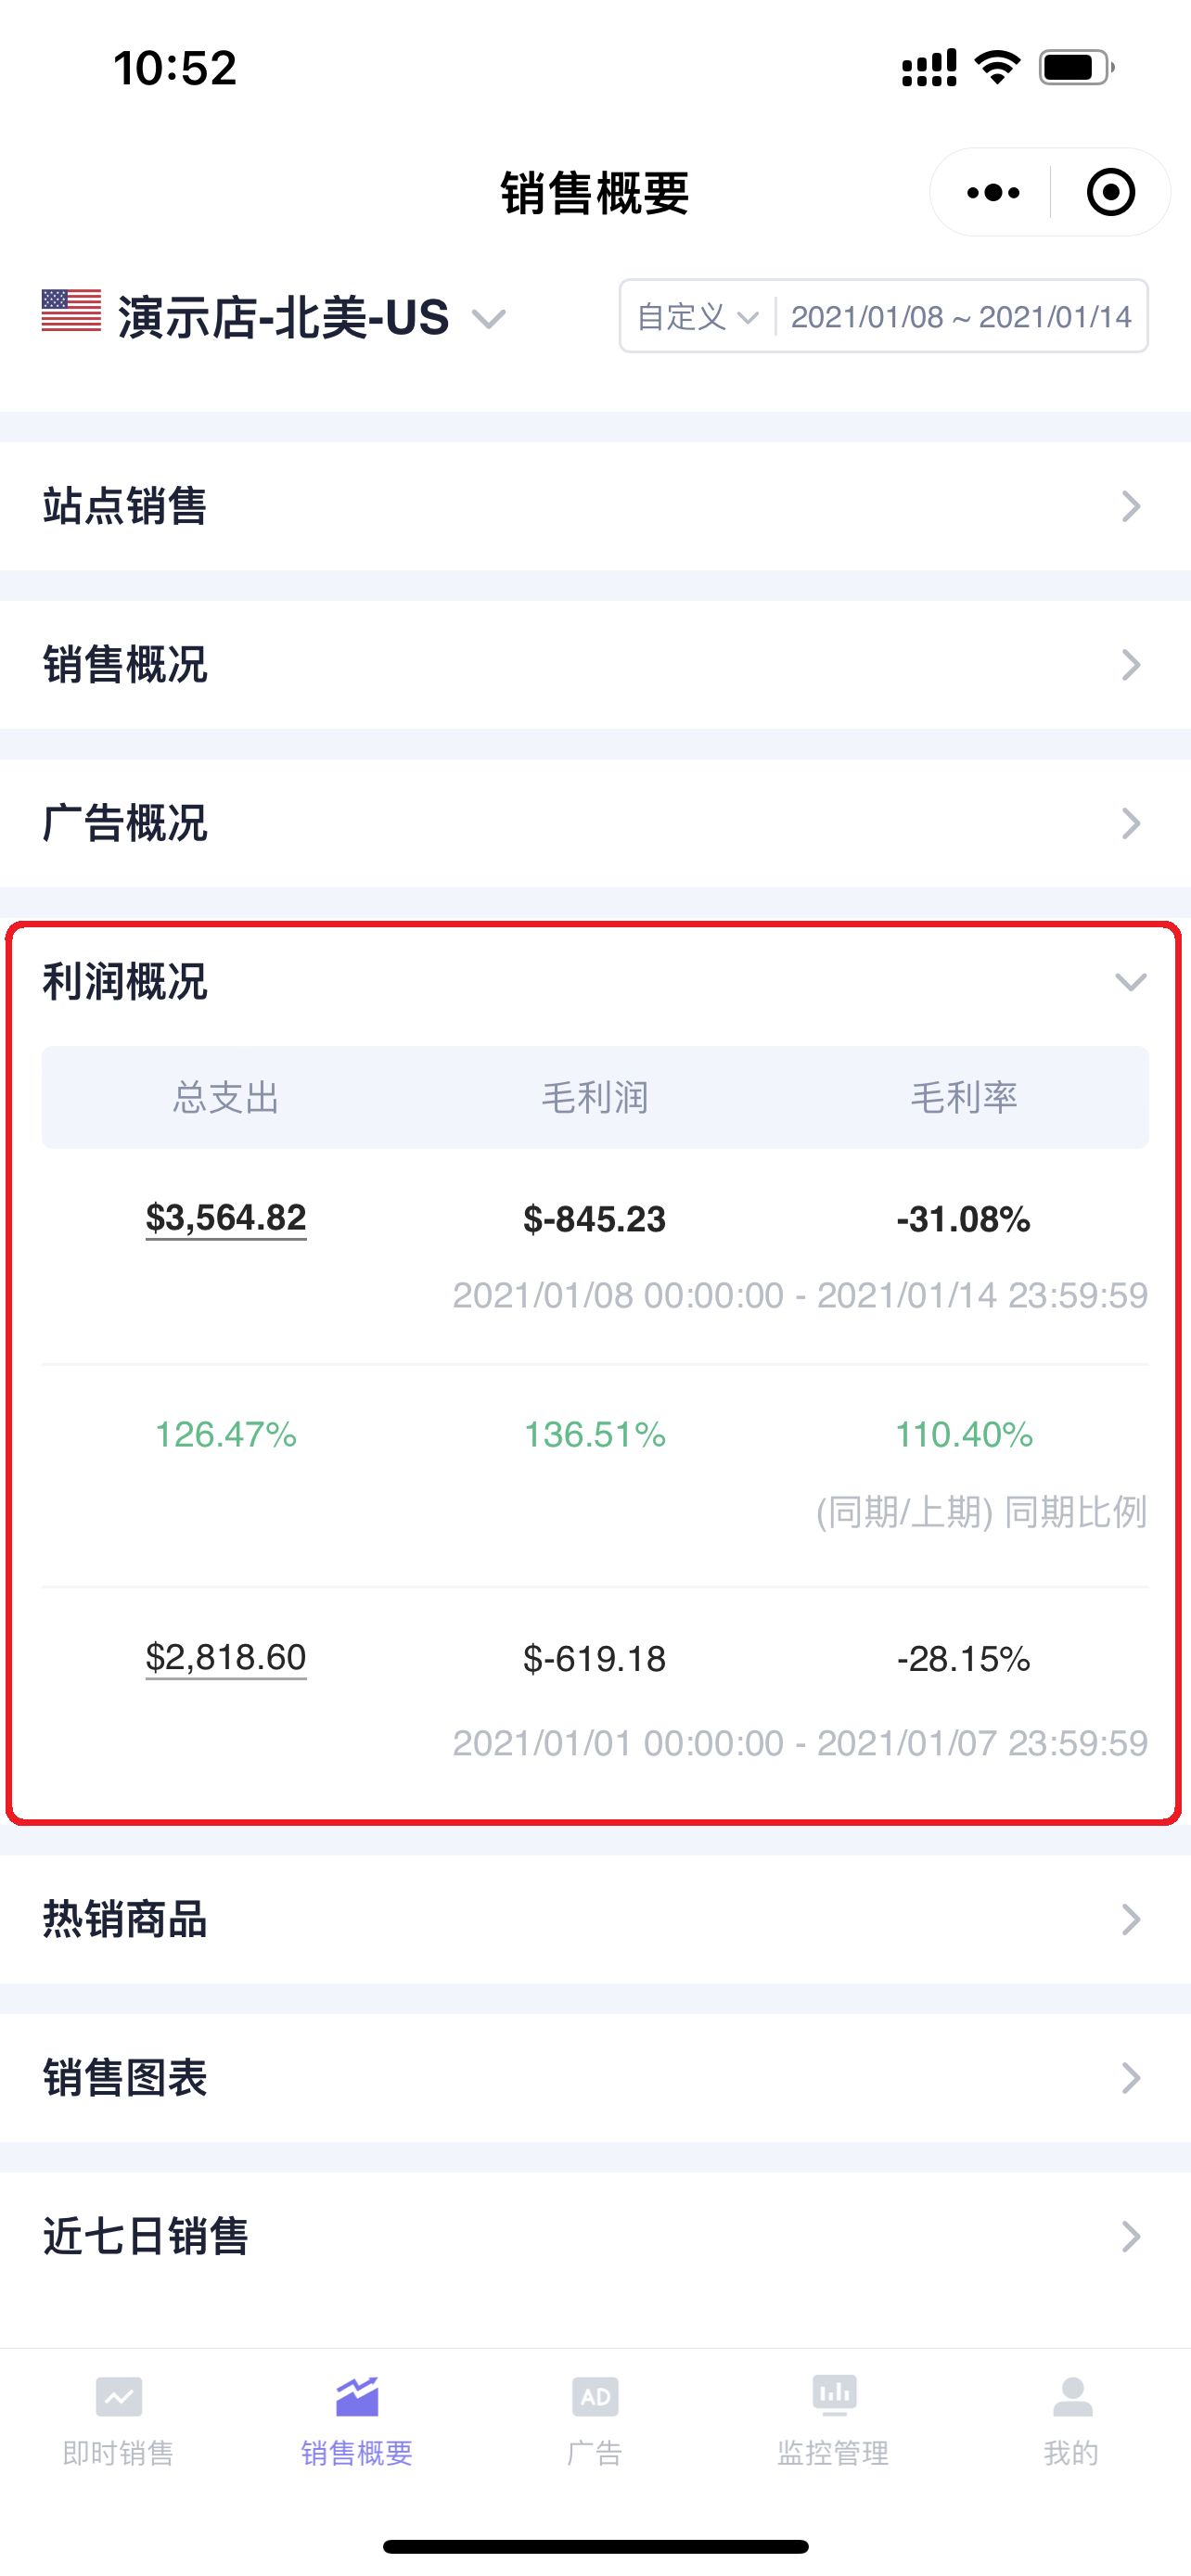
4. Profit Overview
The Profit Overview section displays profit overview data for the current store in the selected time period, including: Total Expenses, Gross Profit, Gross Profit Margin.
Profit Overview also supports same-period comparison to help you analyze profit changes.
 +
+
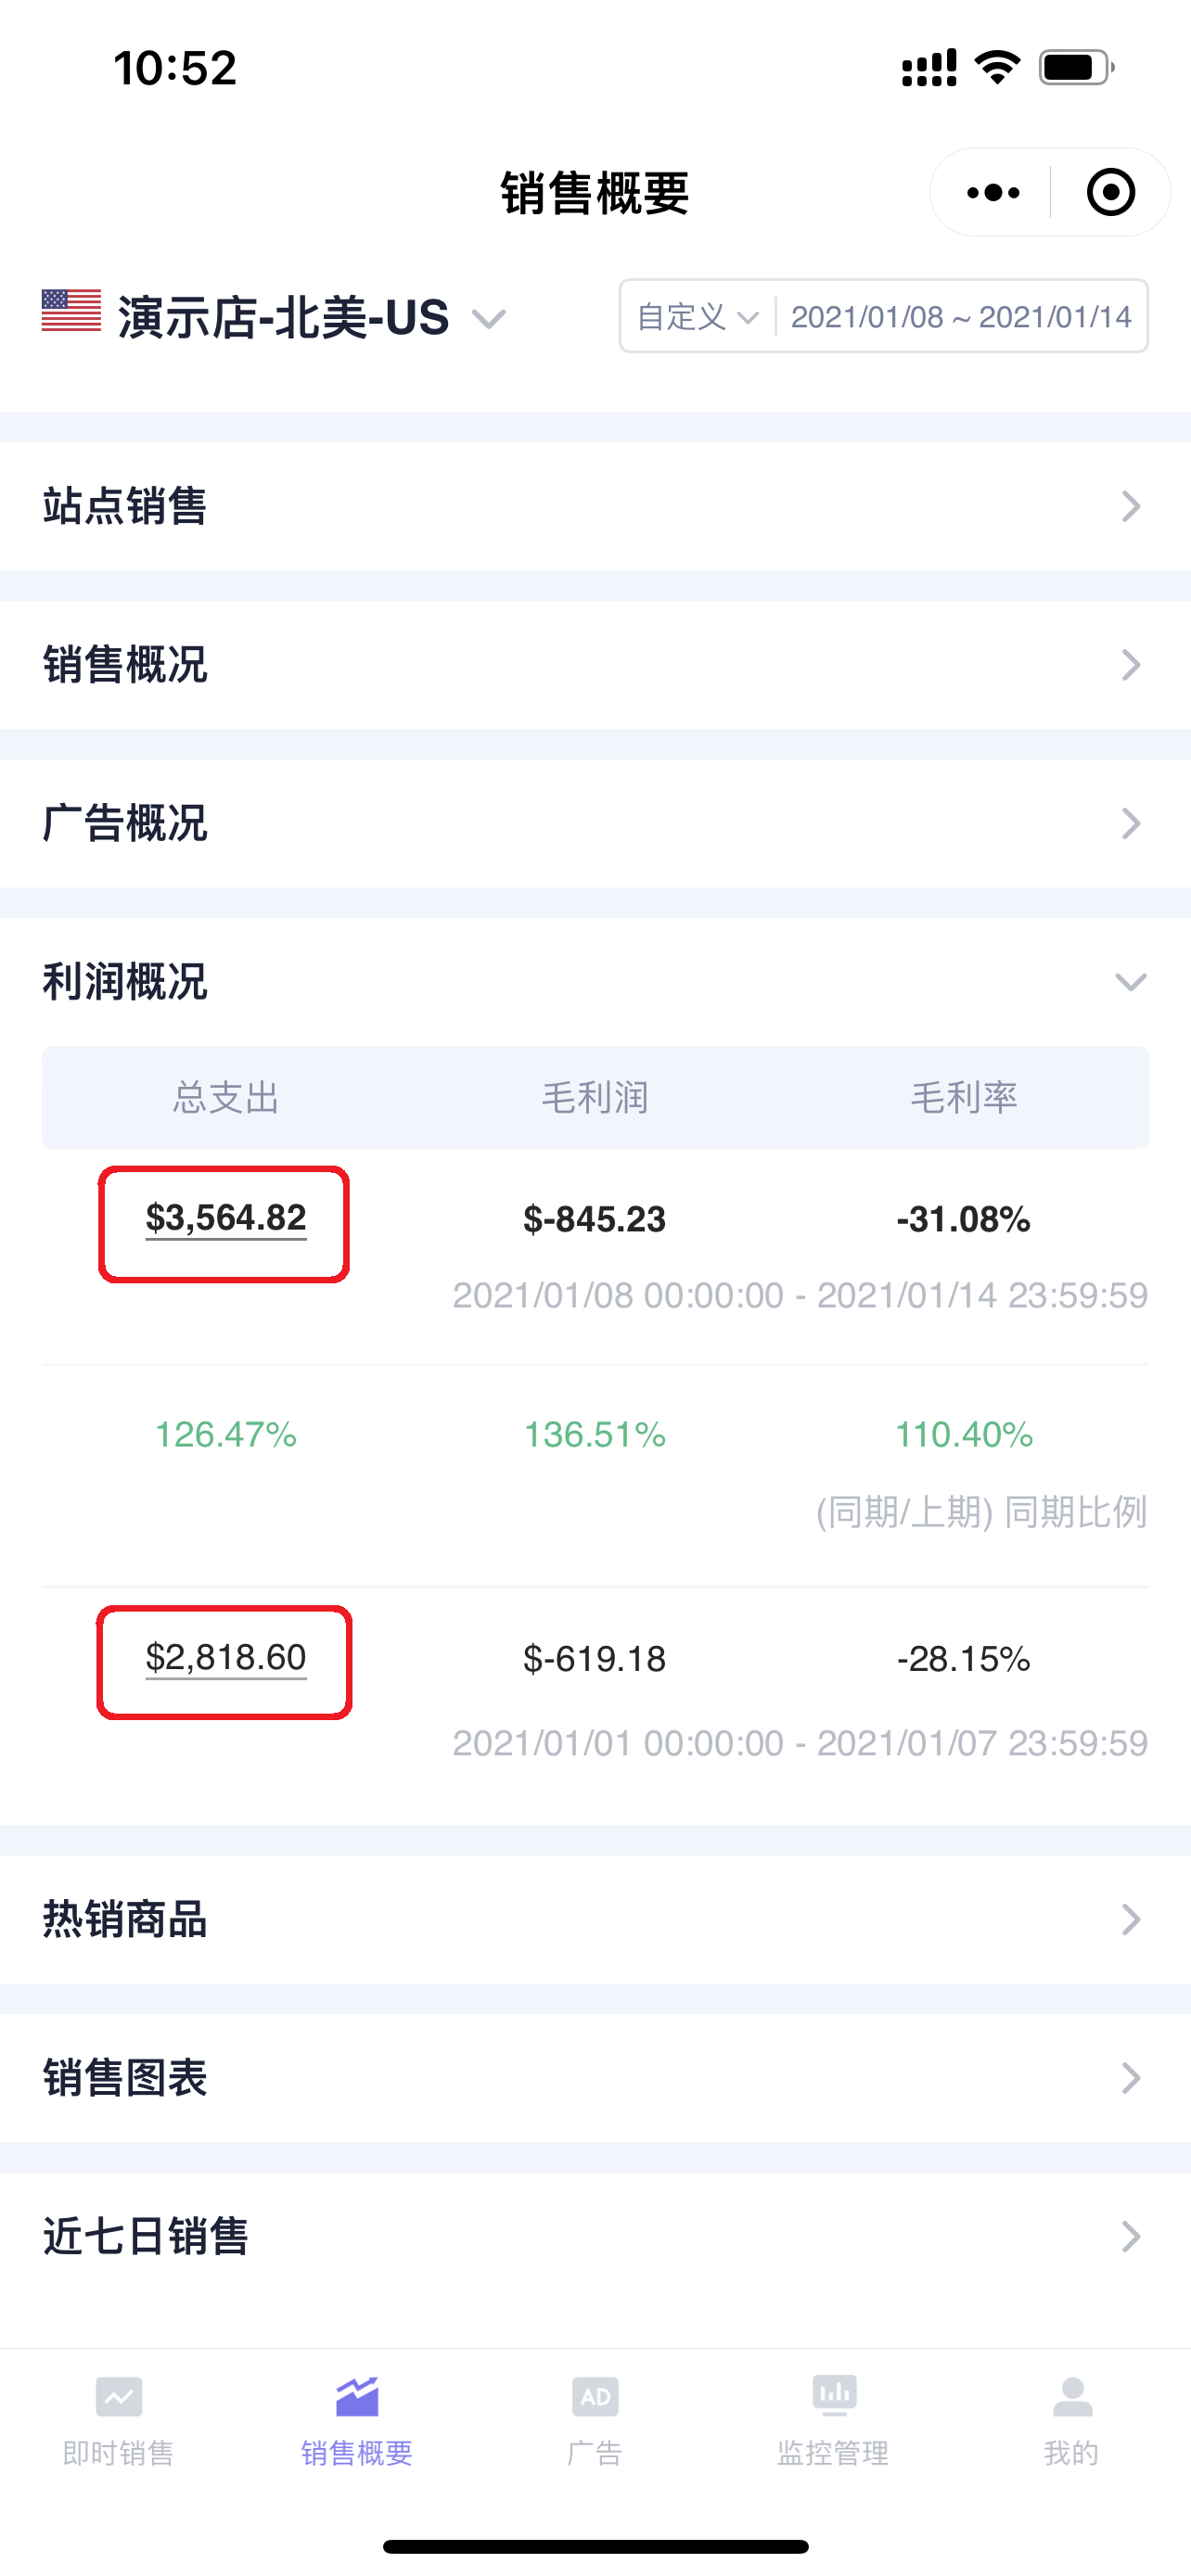
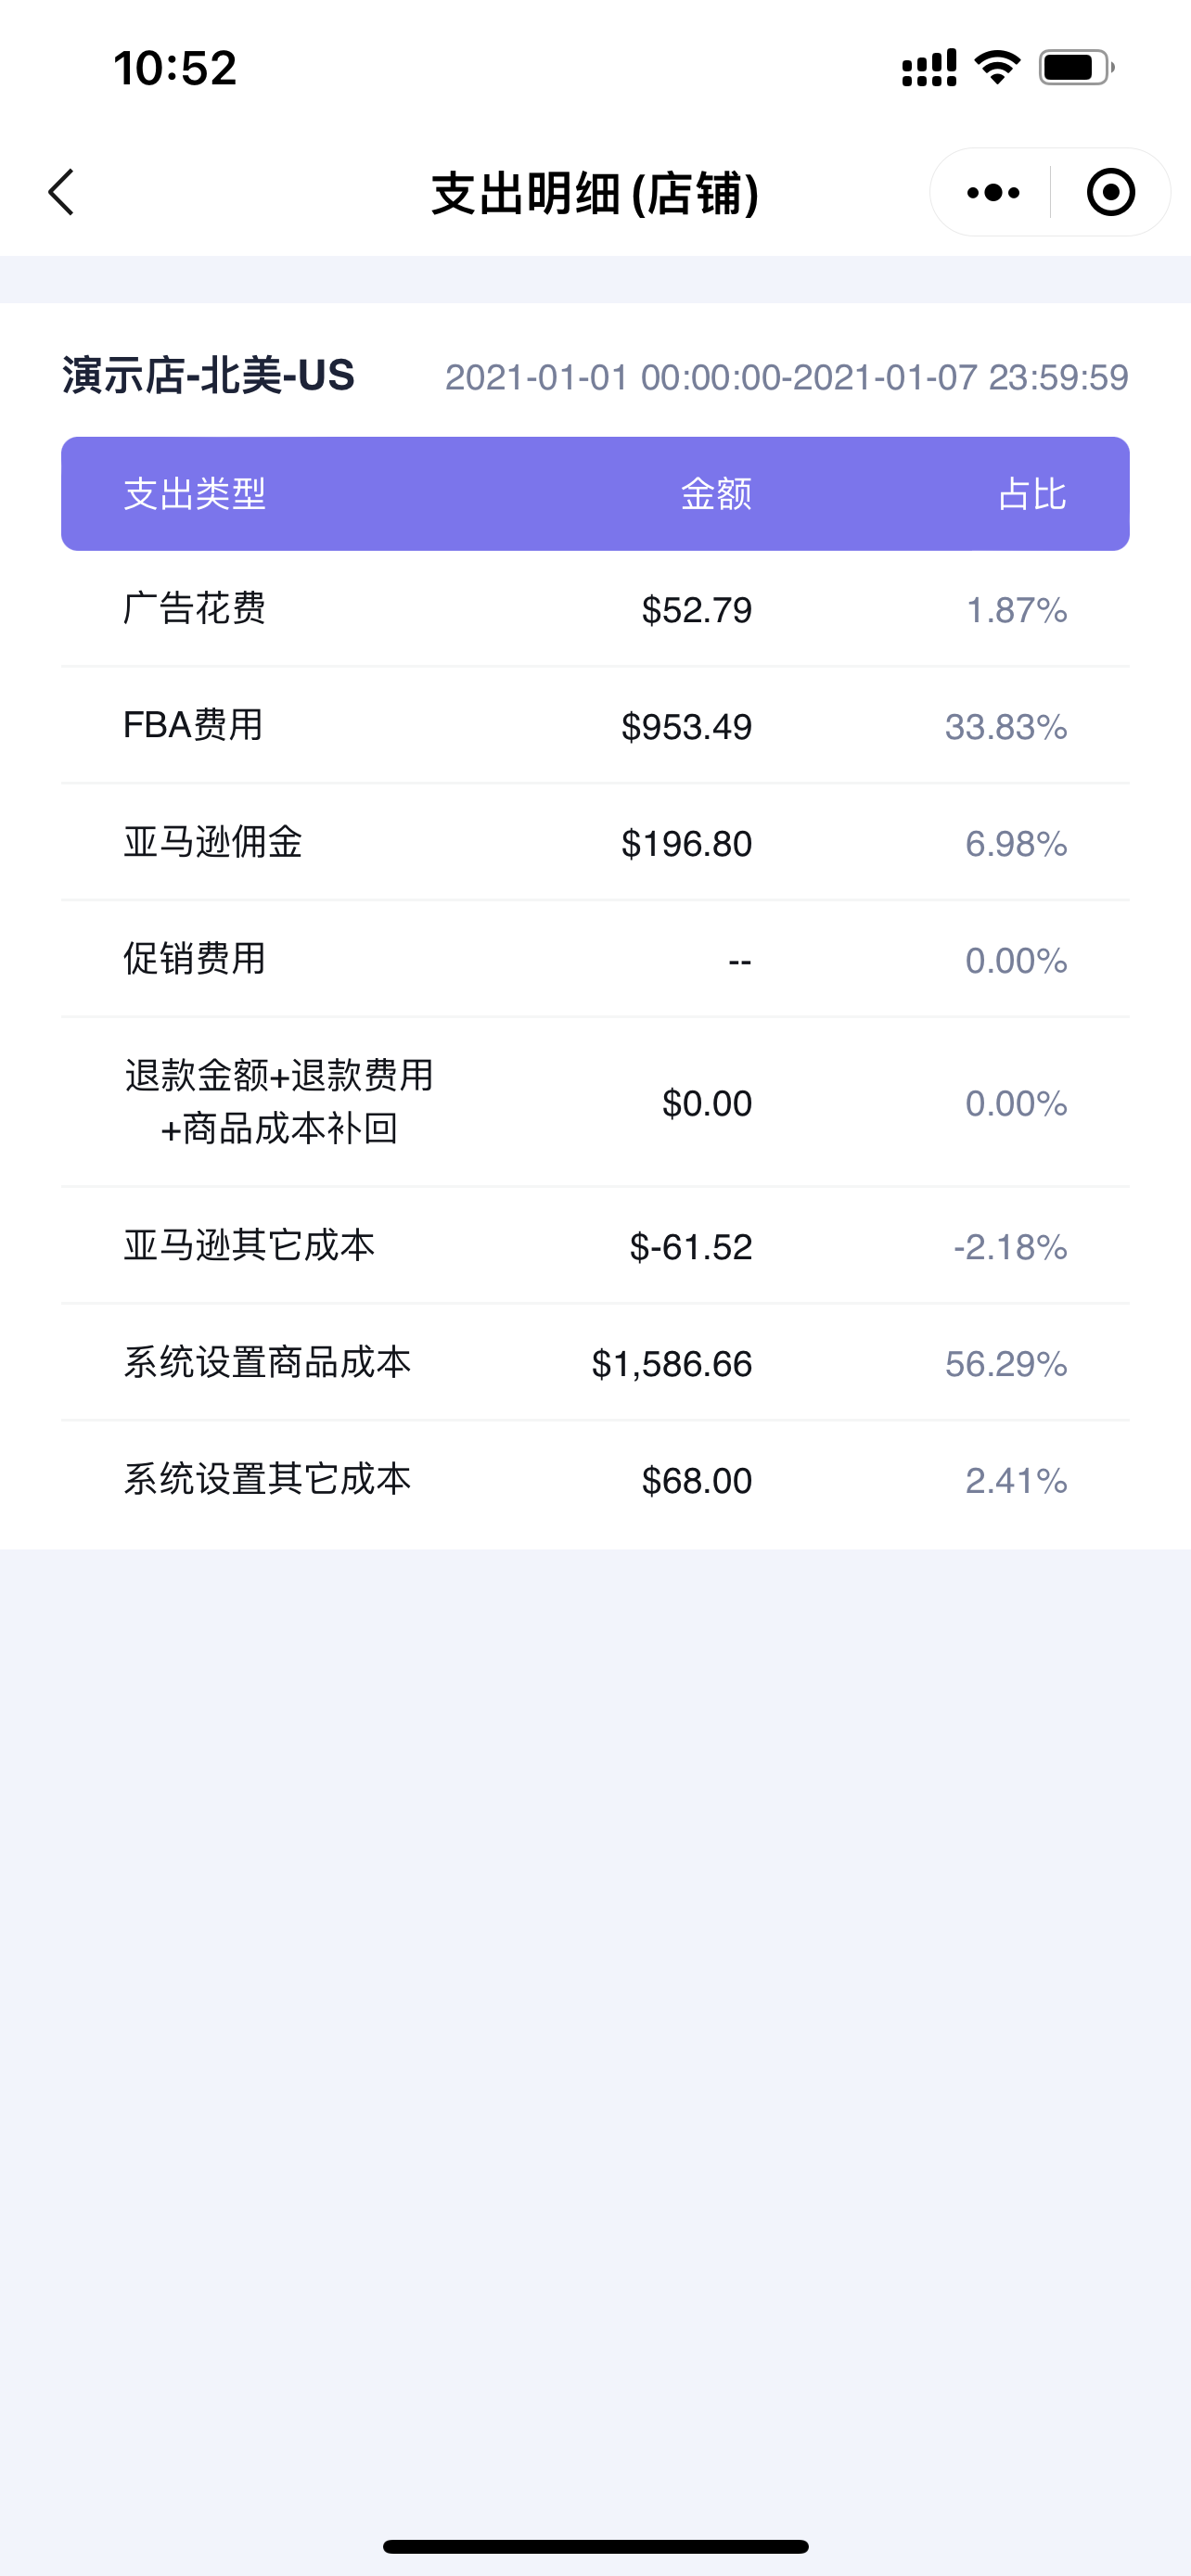
Click the Total Expenses amount to view the expense details of the current store, such as: the cost of each expense type and the percentage of each expense;
 +
+
Expense Details:
 +
+
5. Best-Selling Products
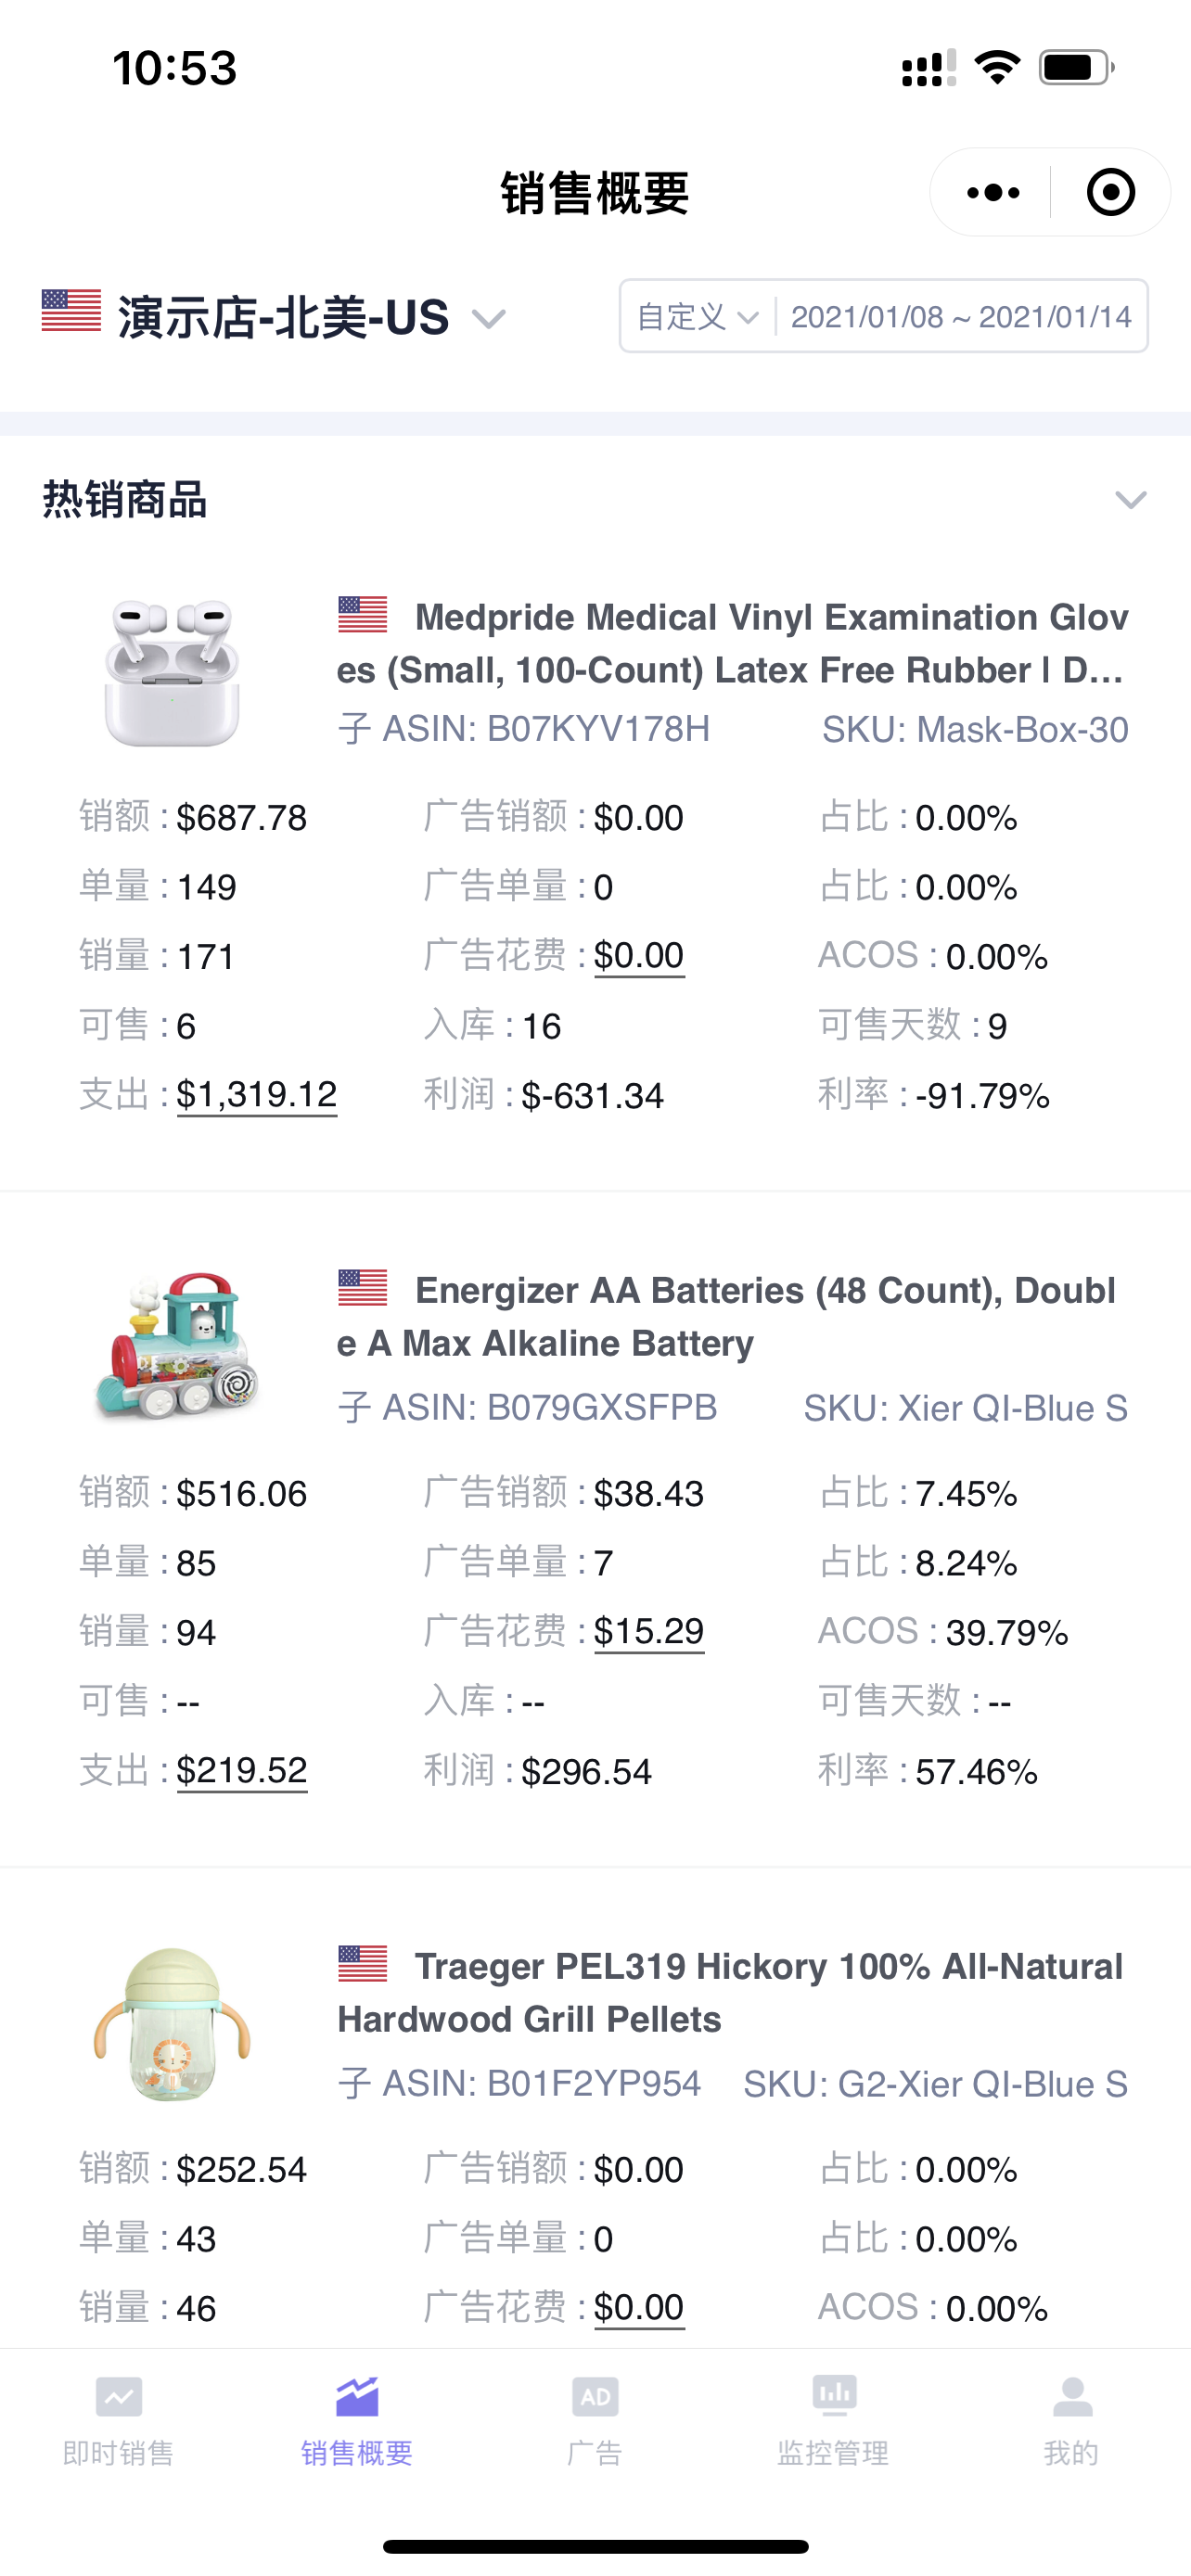
The Best-Selling Products section defaults to displaying the sales detail data of the top three best-selling products in the current store for the selected time period.
 +
+
Special Note:
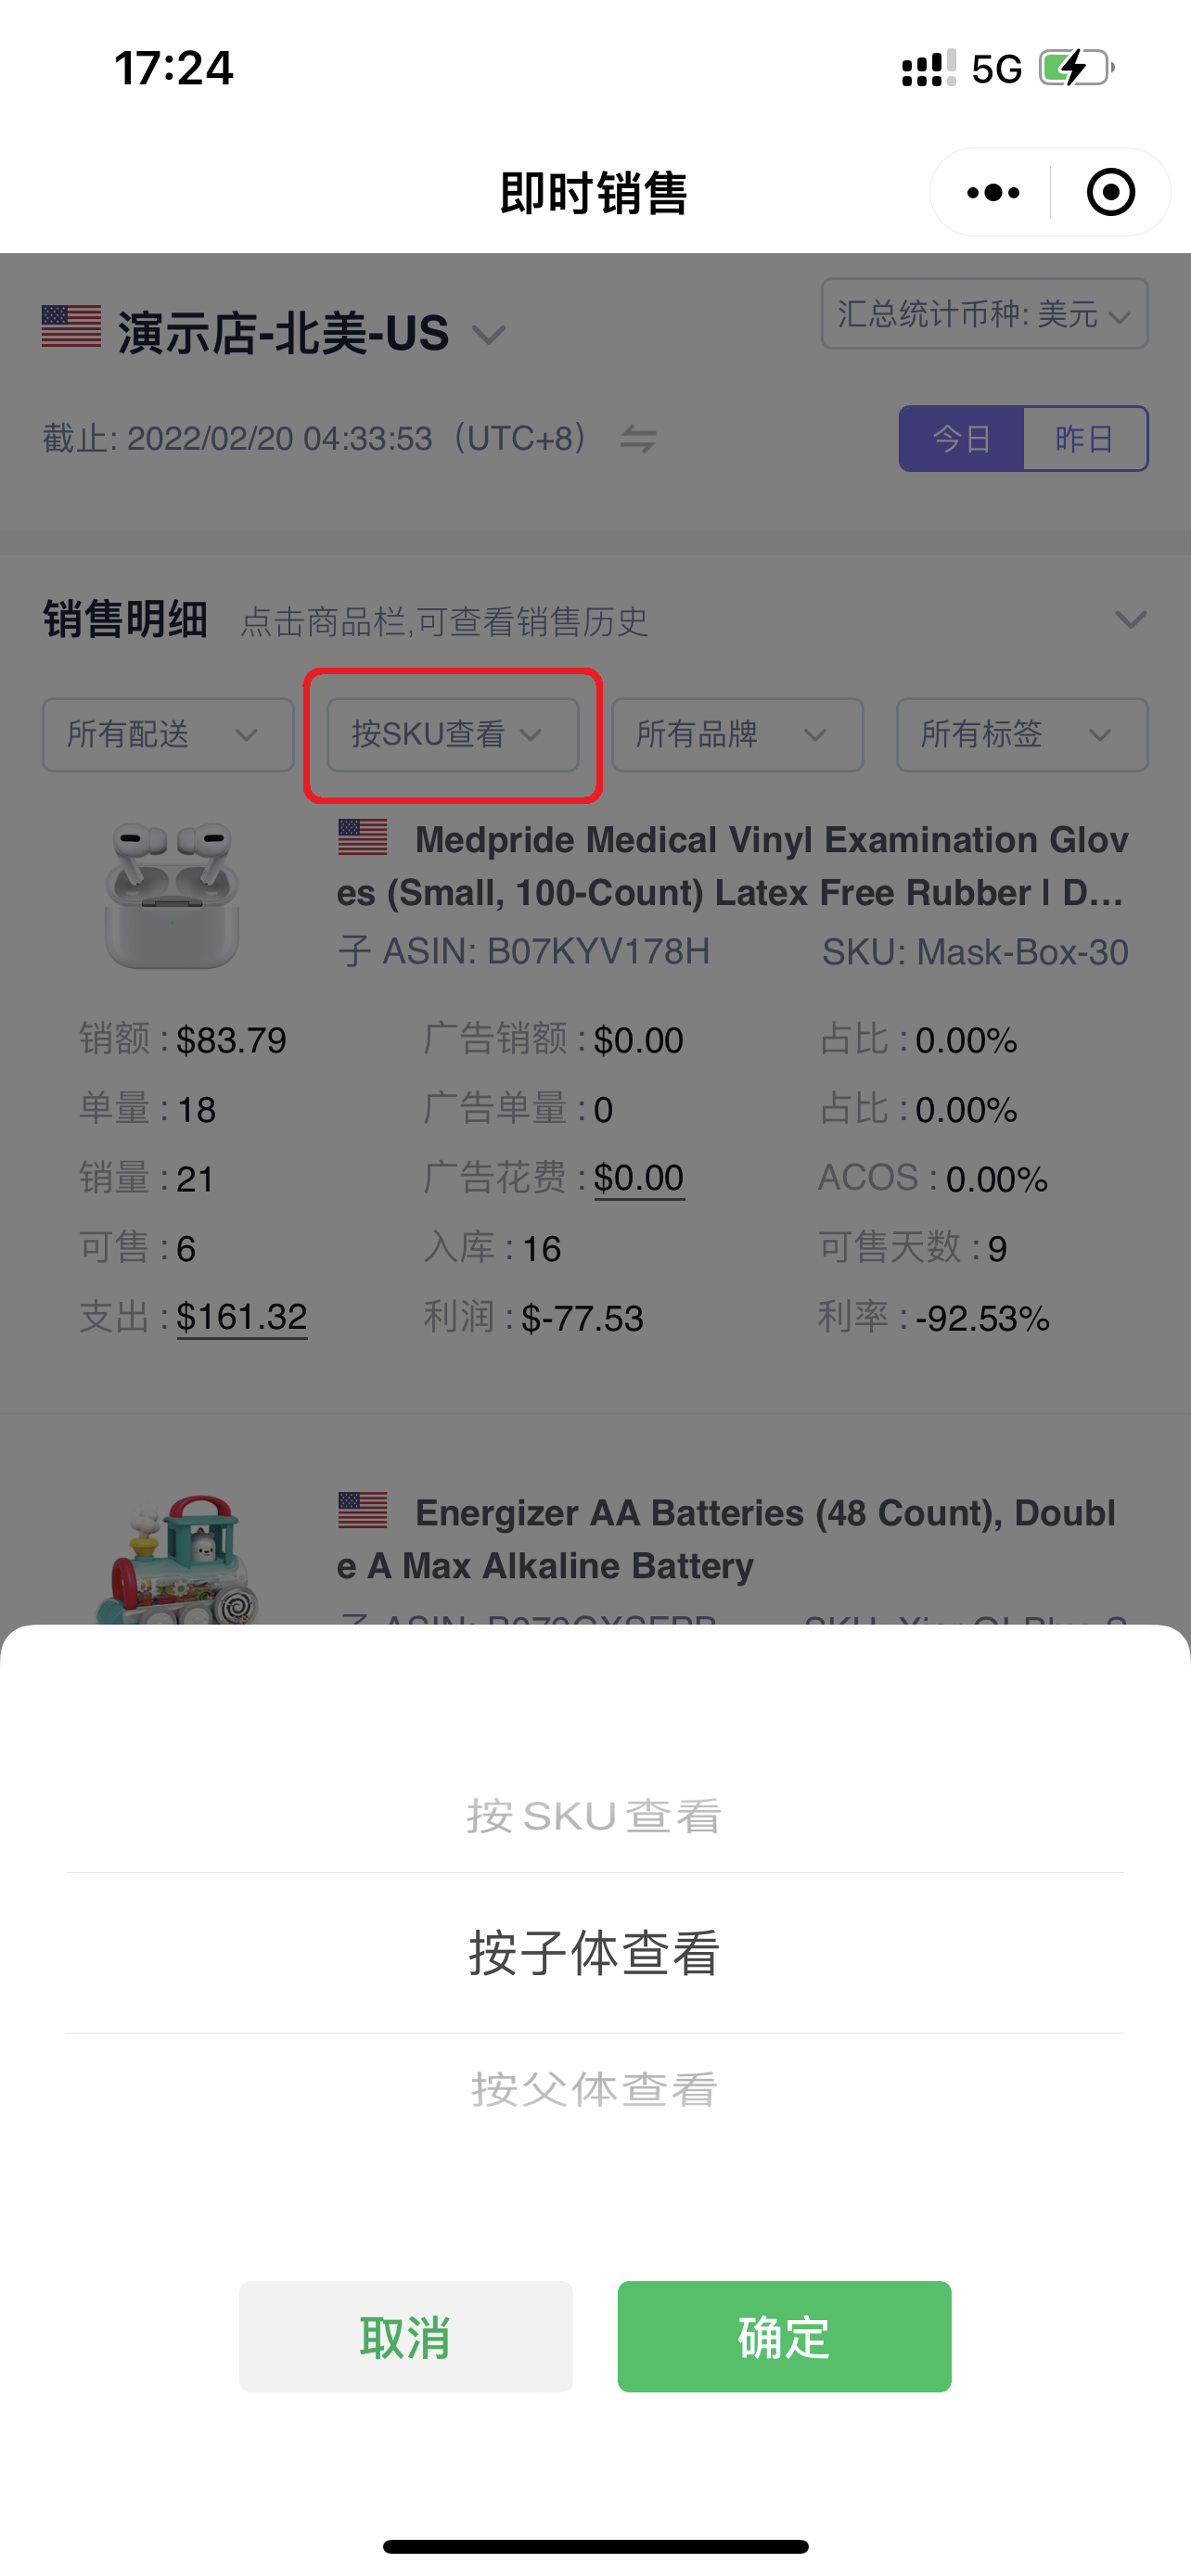
The data statistics dimension of Best-Selling Products is consistent with the filter conditions of the 【Instant Sales - Sales Details】 feature.
If the sales detail filter condition of the 【Instant Sales】 feature is viewed by SKU dimension, then the data here is also statistically analyzed by SKU dimension.
If the sales detail filter condition of the 【Instant Sales】 feature is viewed by Parent/Child ASIN dimension, then the data here is statistically analyzed by Parent/Child ASIN dimension.
 +
+
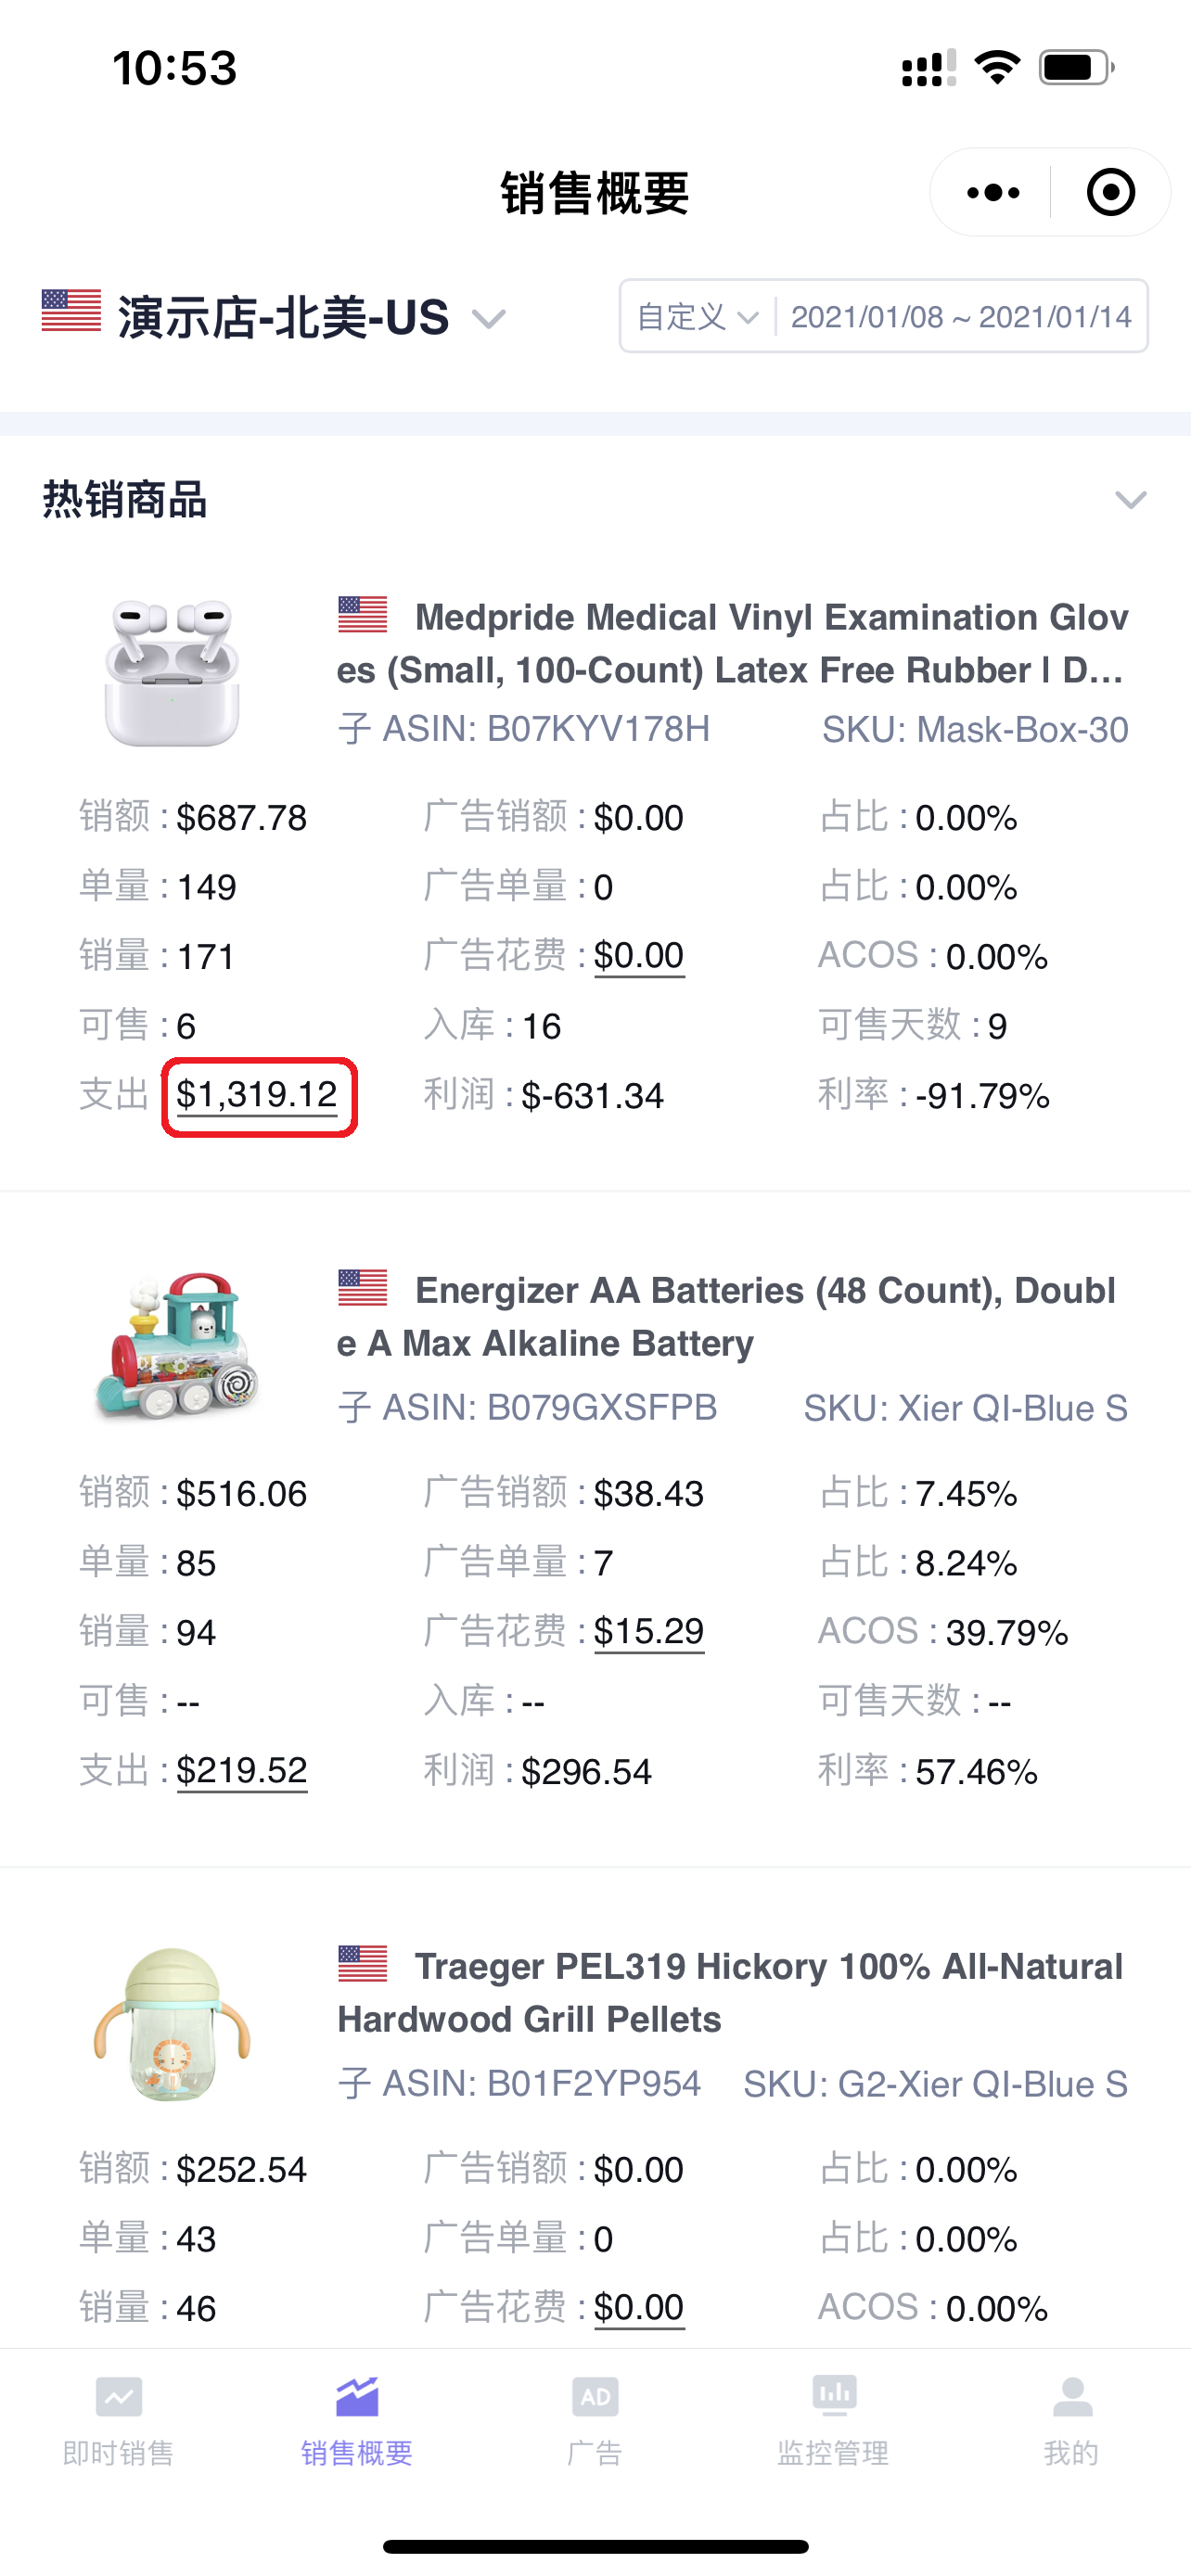
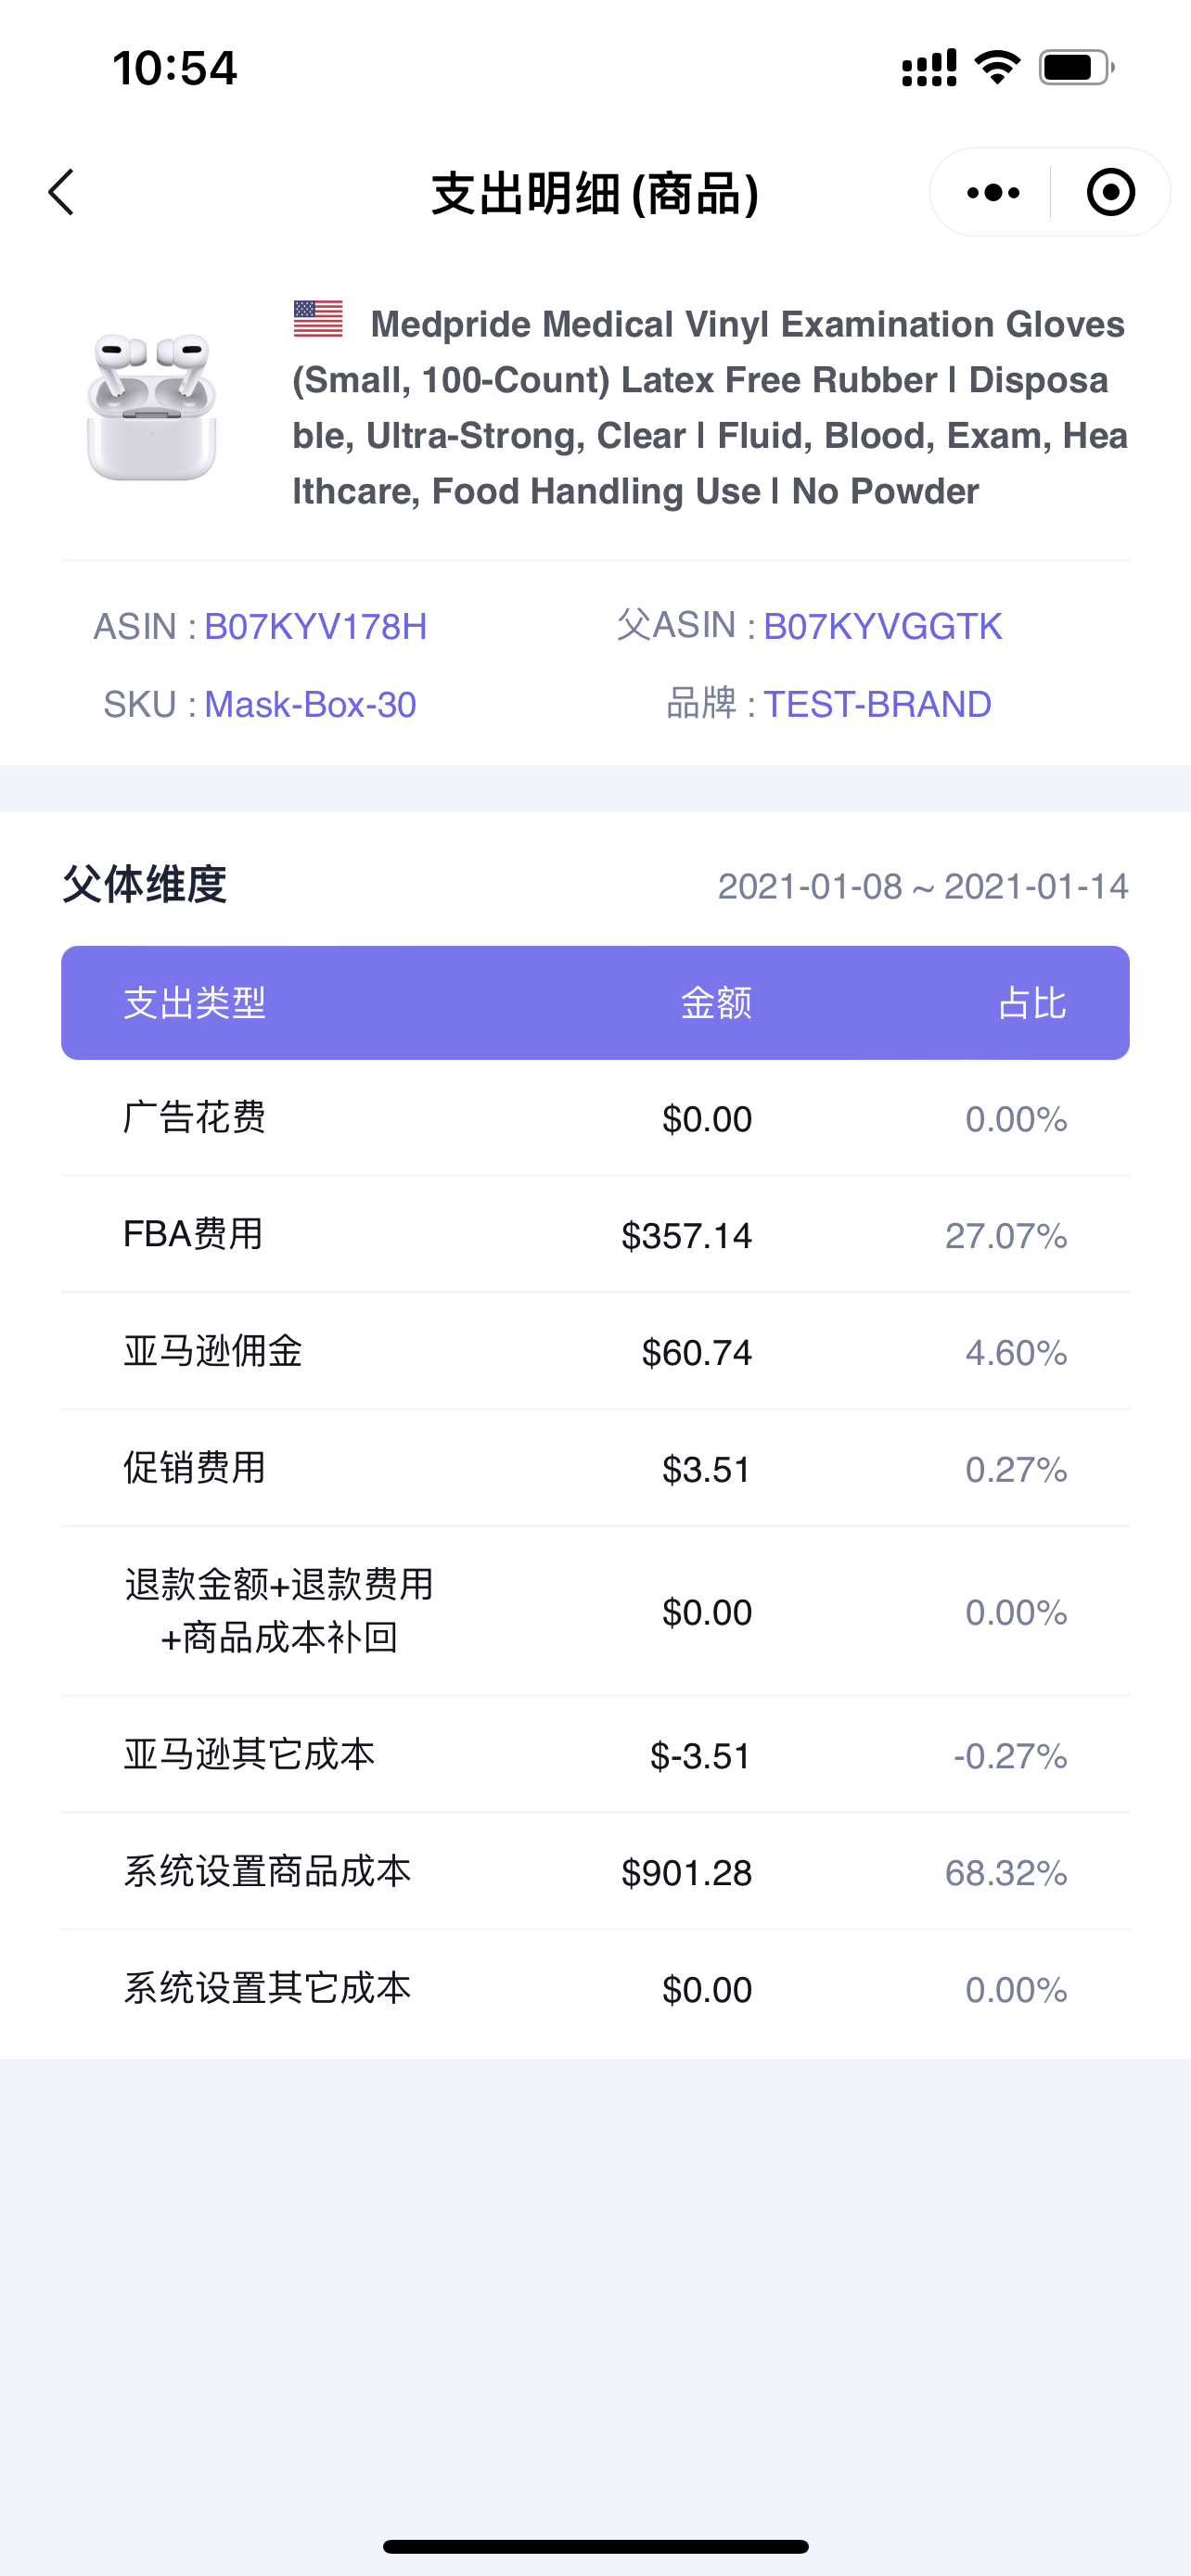
Click the expense number to view the expense details of the product;
 +
+
Expense Details:
 +
+
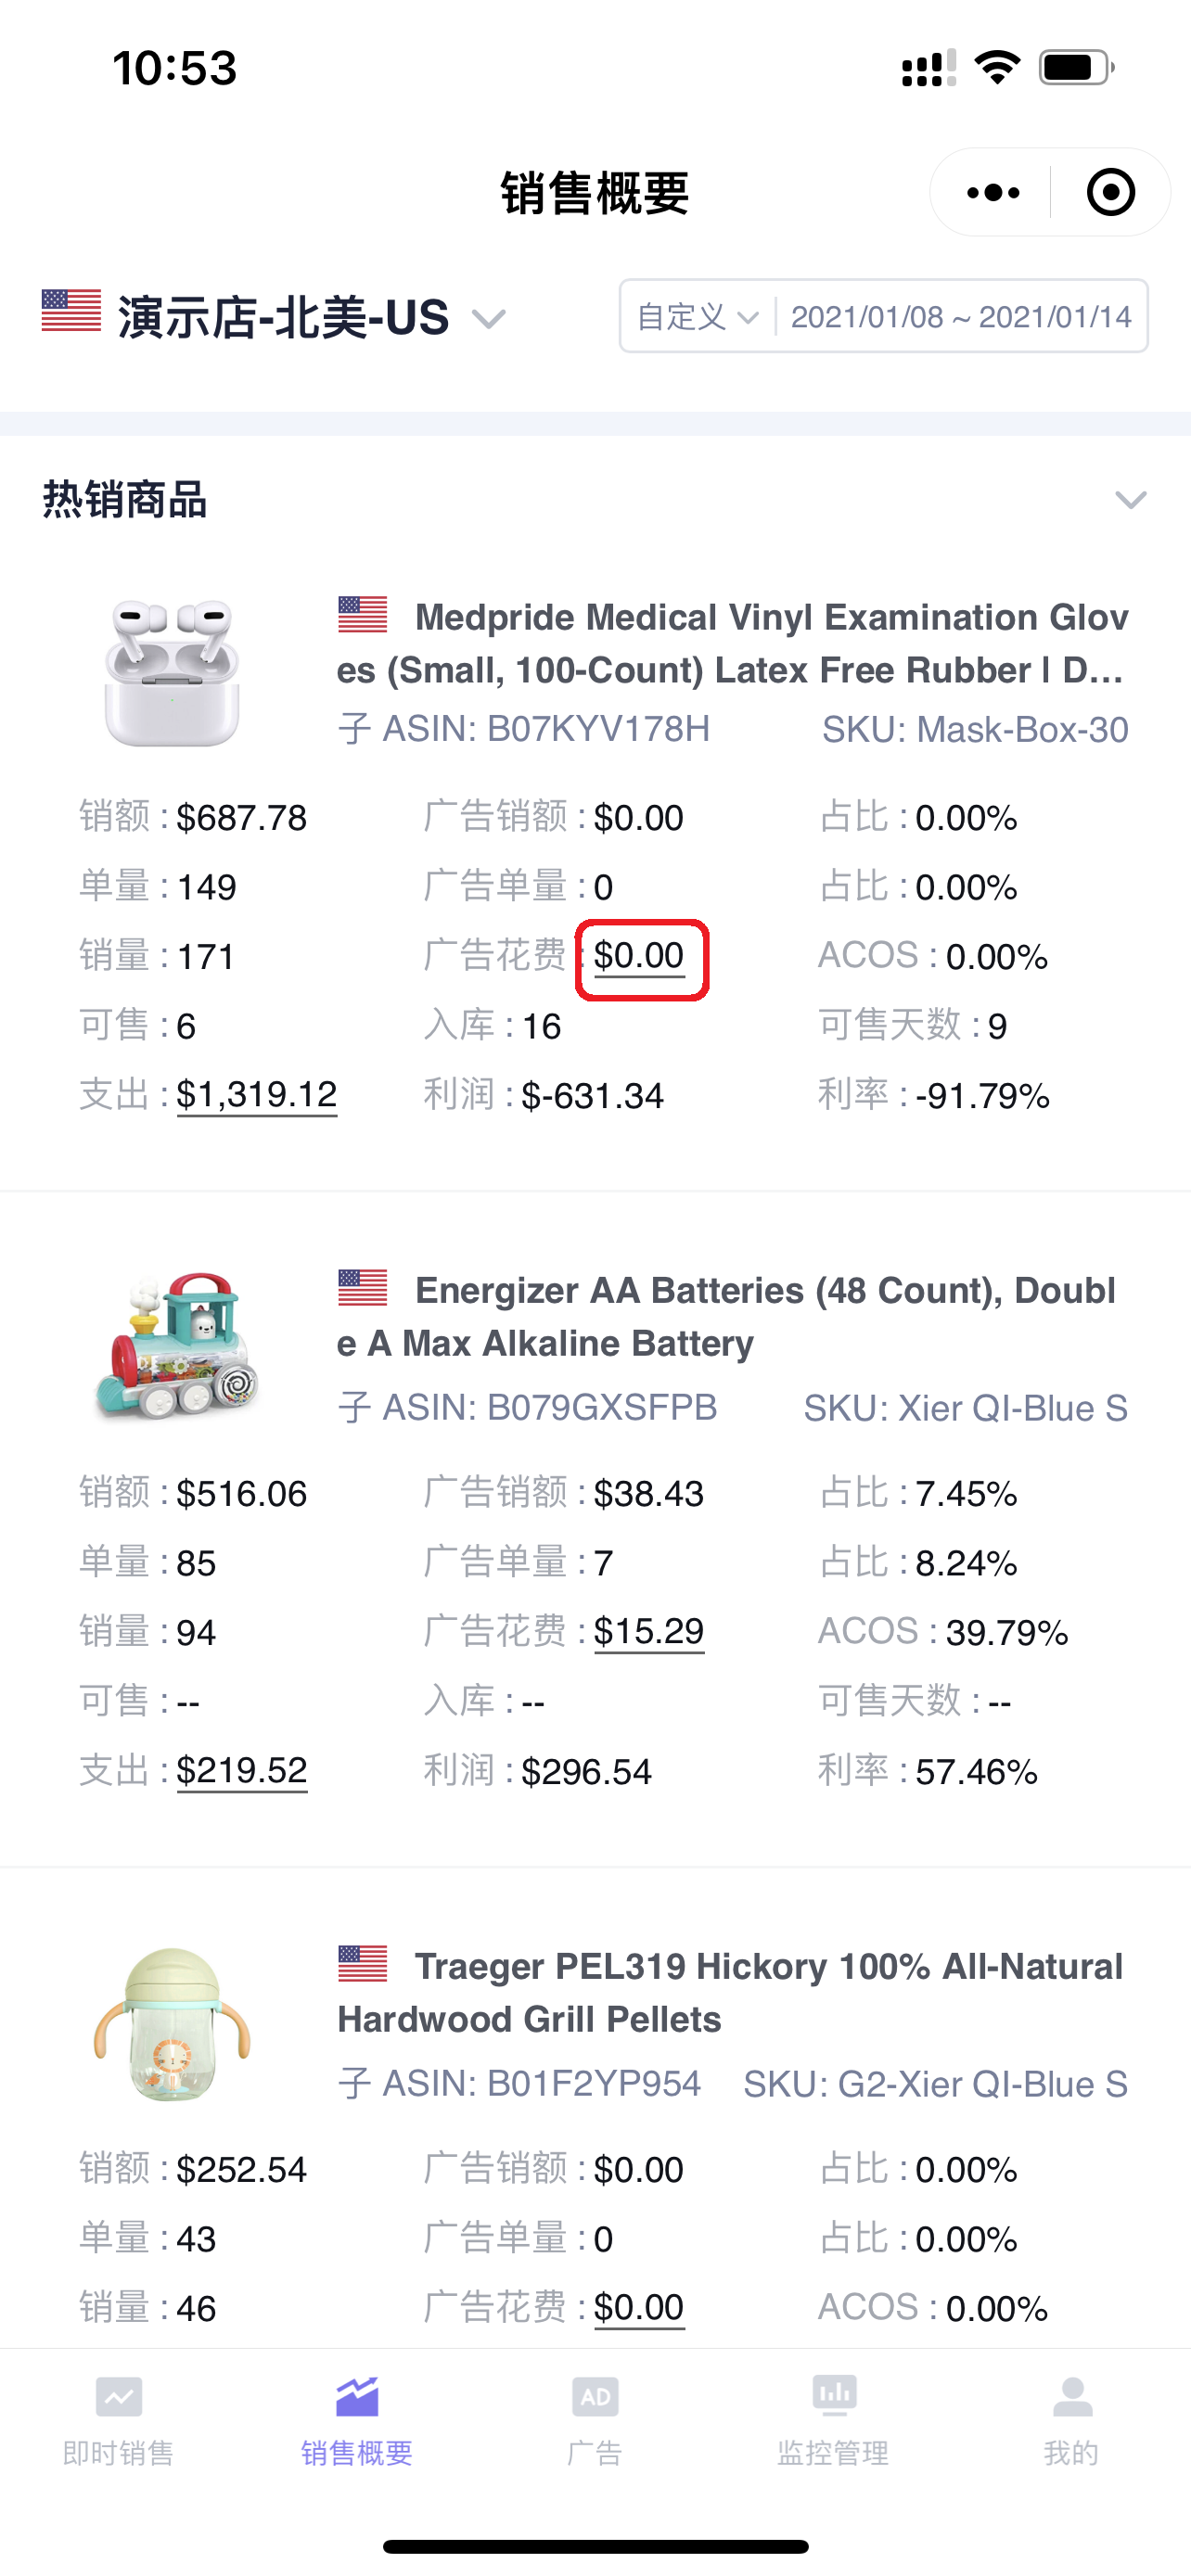
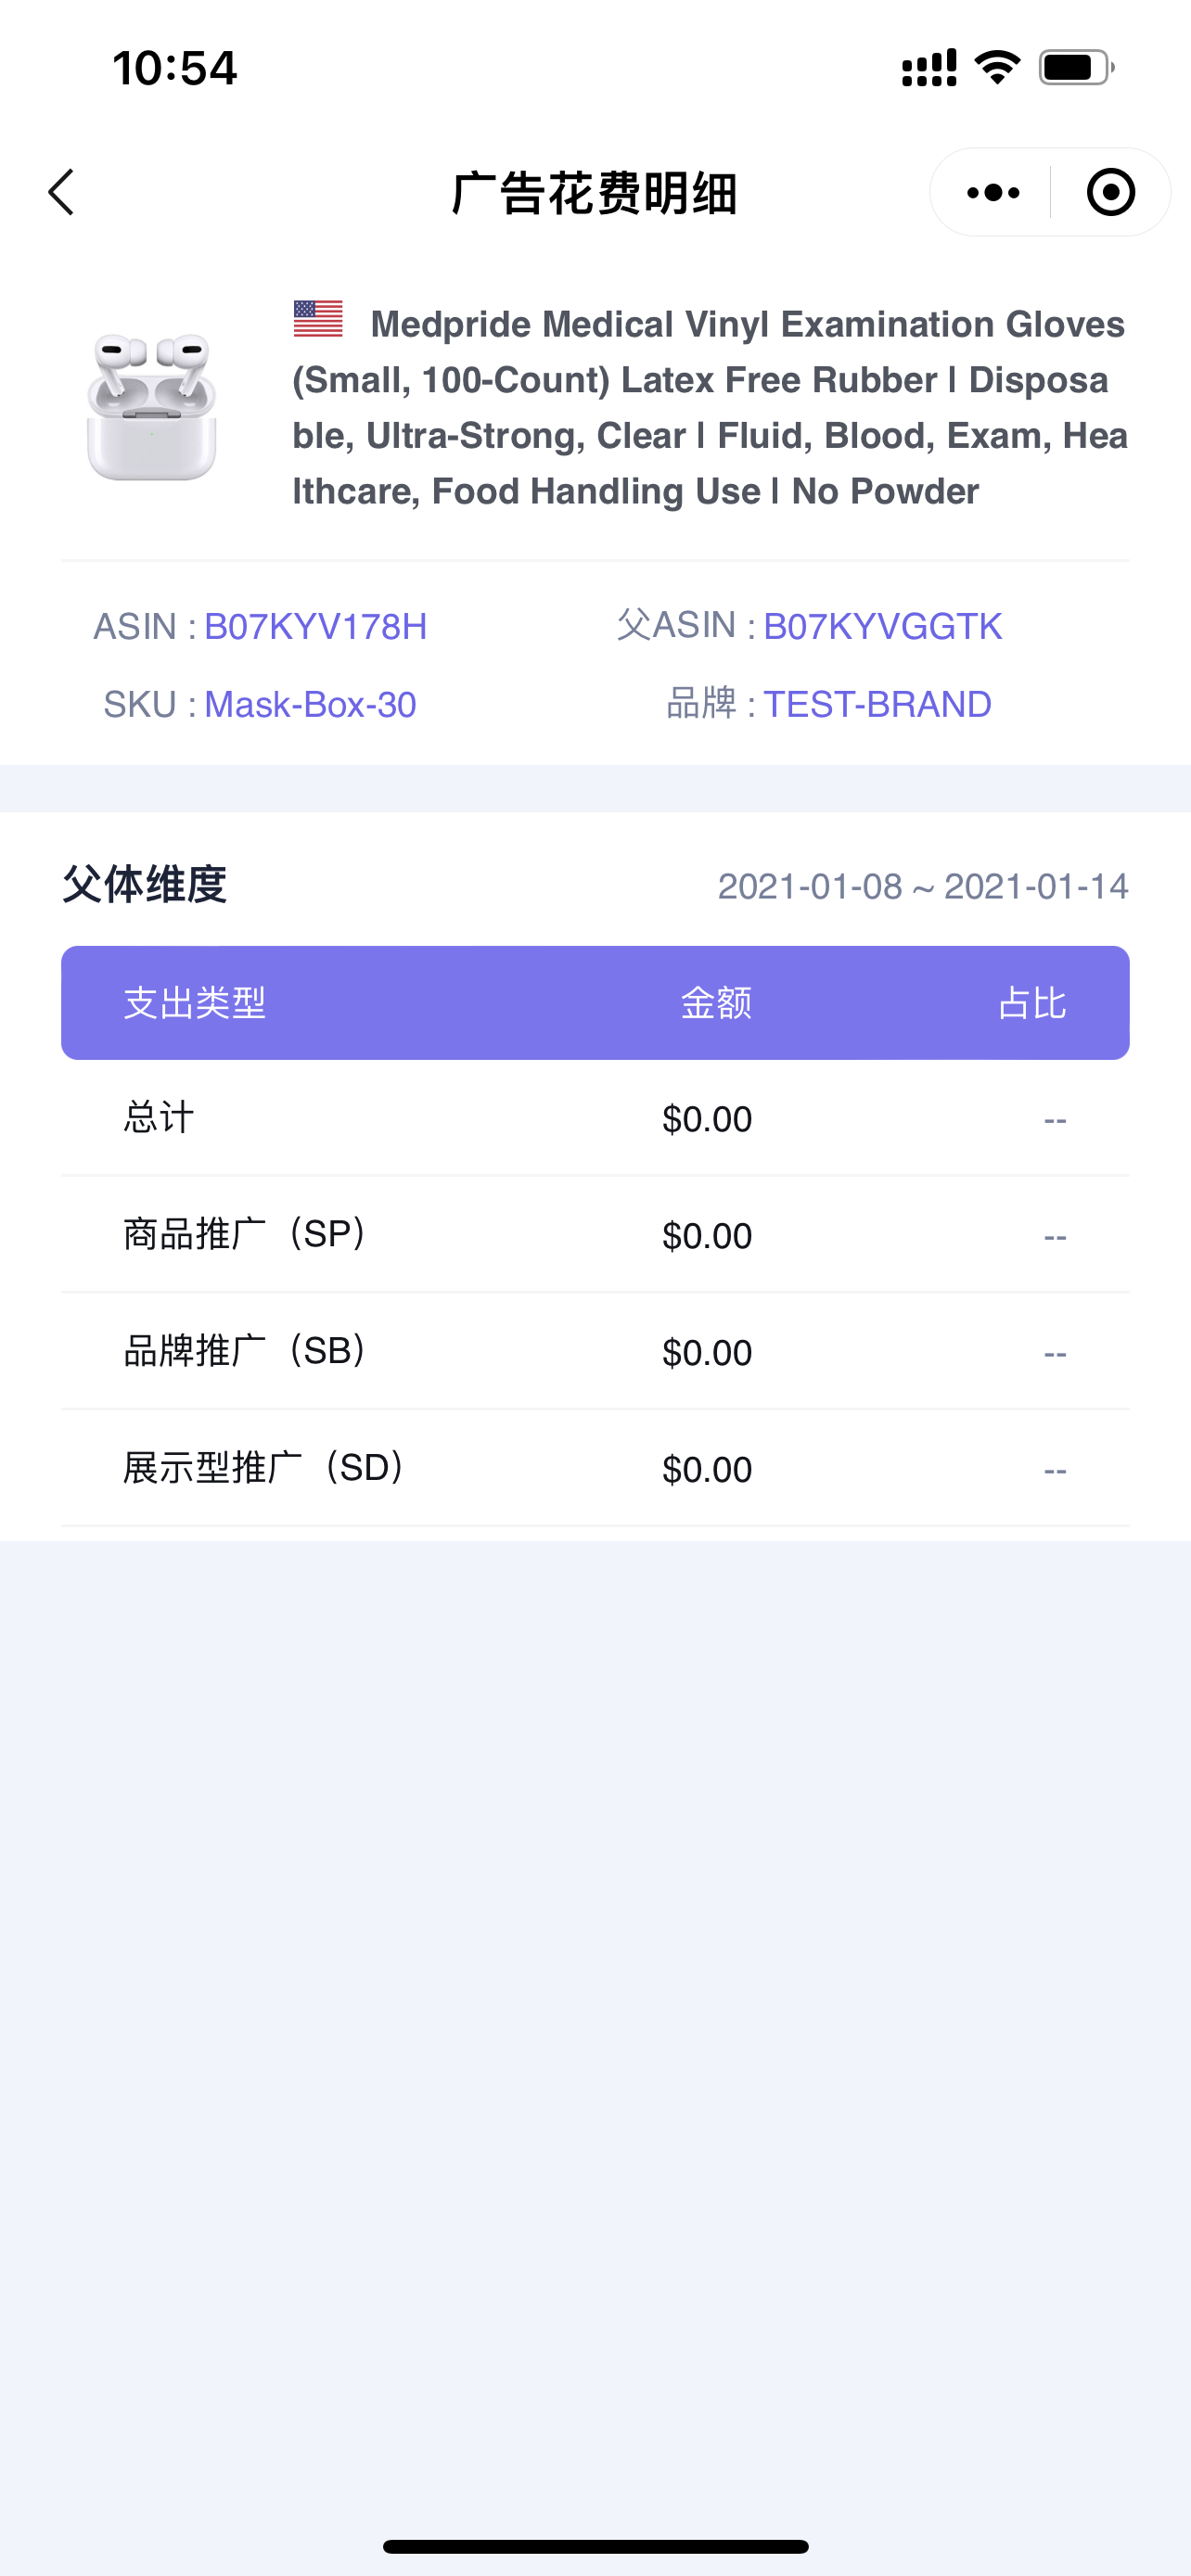
Click the Advertising Spend amount to view the advertising spend type details and percentages of the product, helping you adjust your advertising strategy.
 +
+
Advertising Spend Details and Percentages:
 +
+
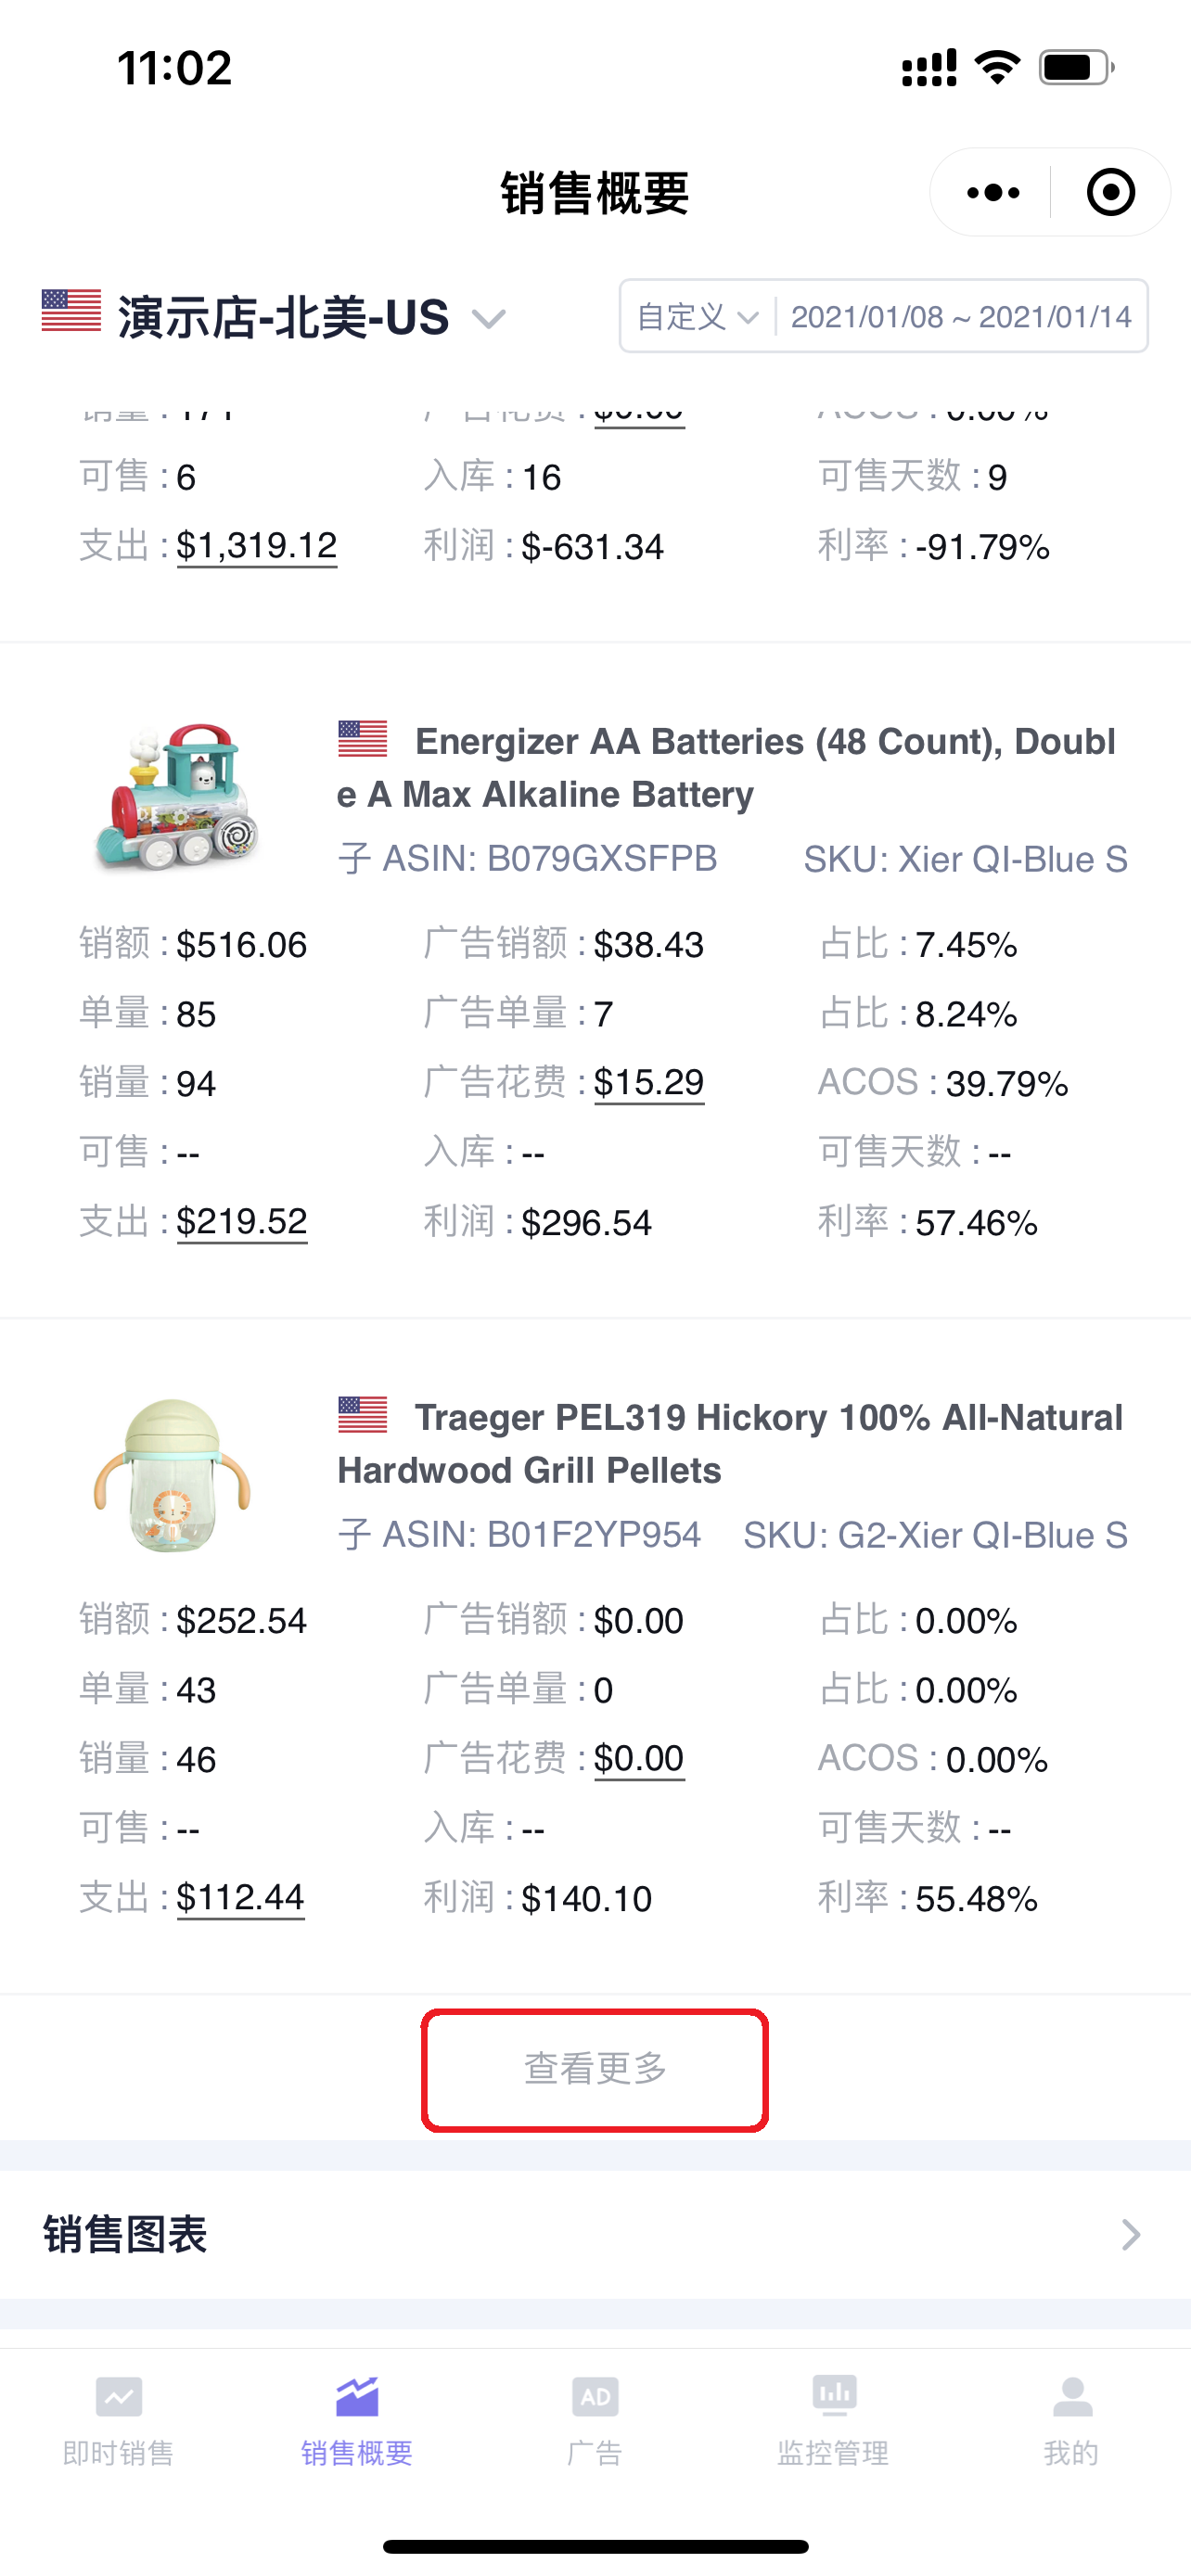
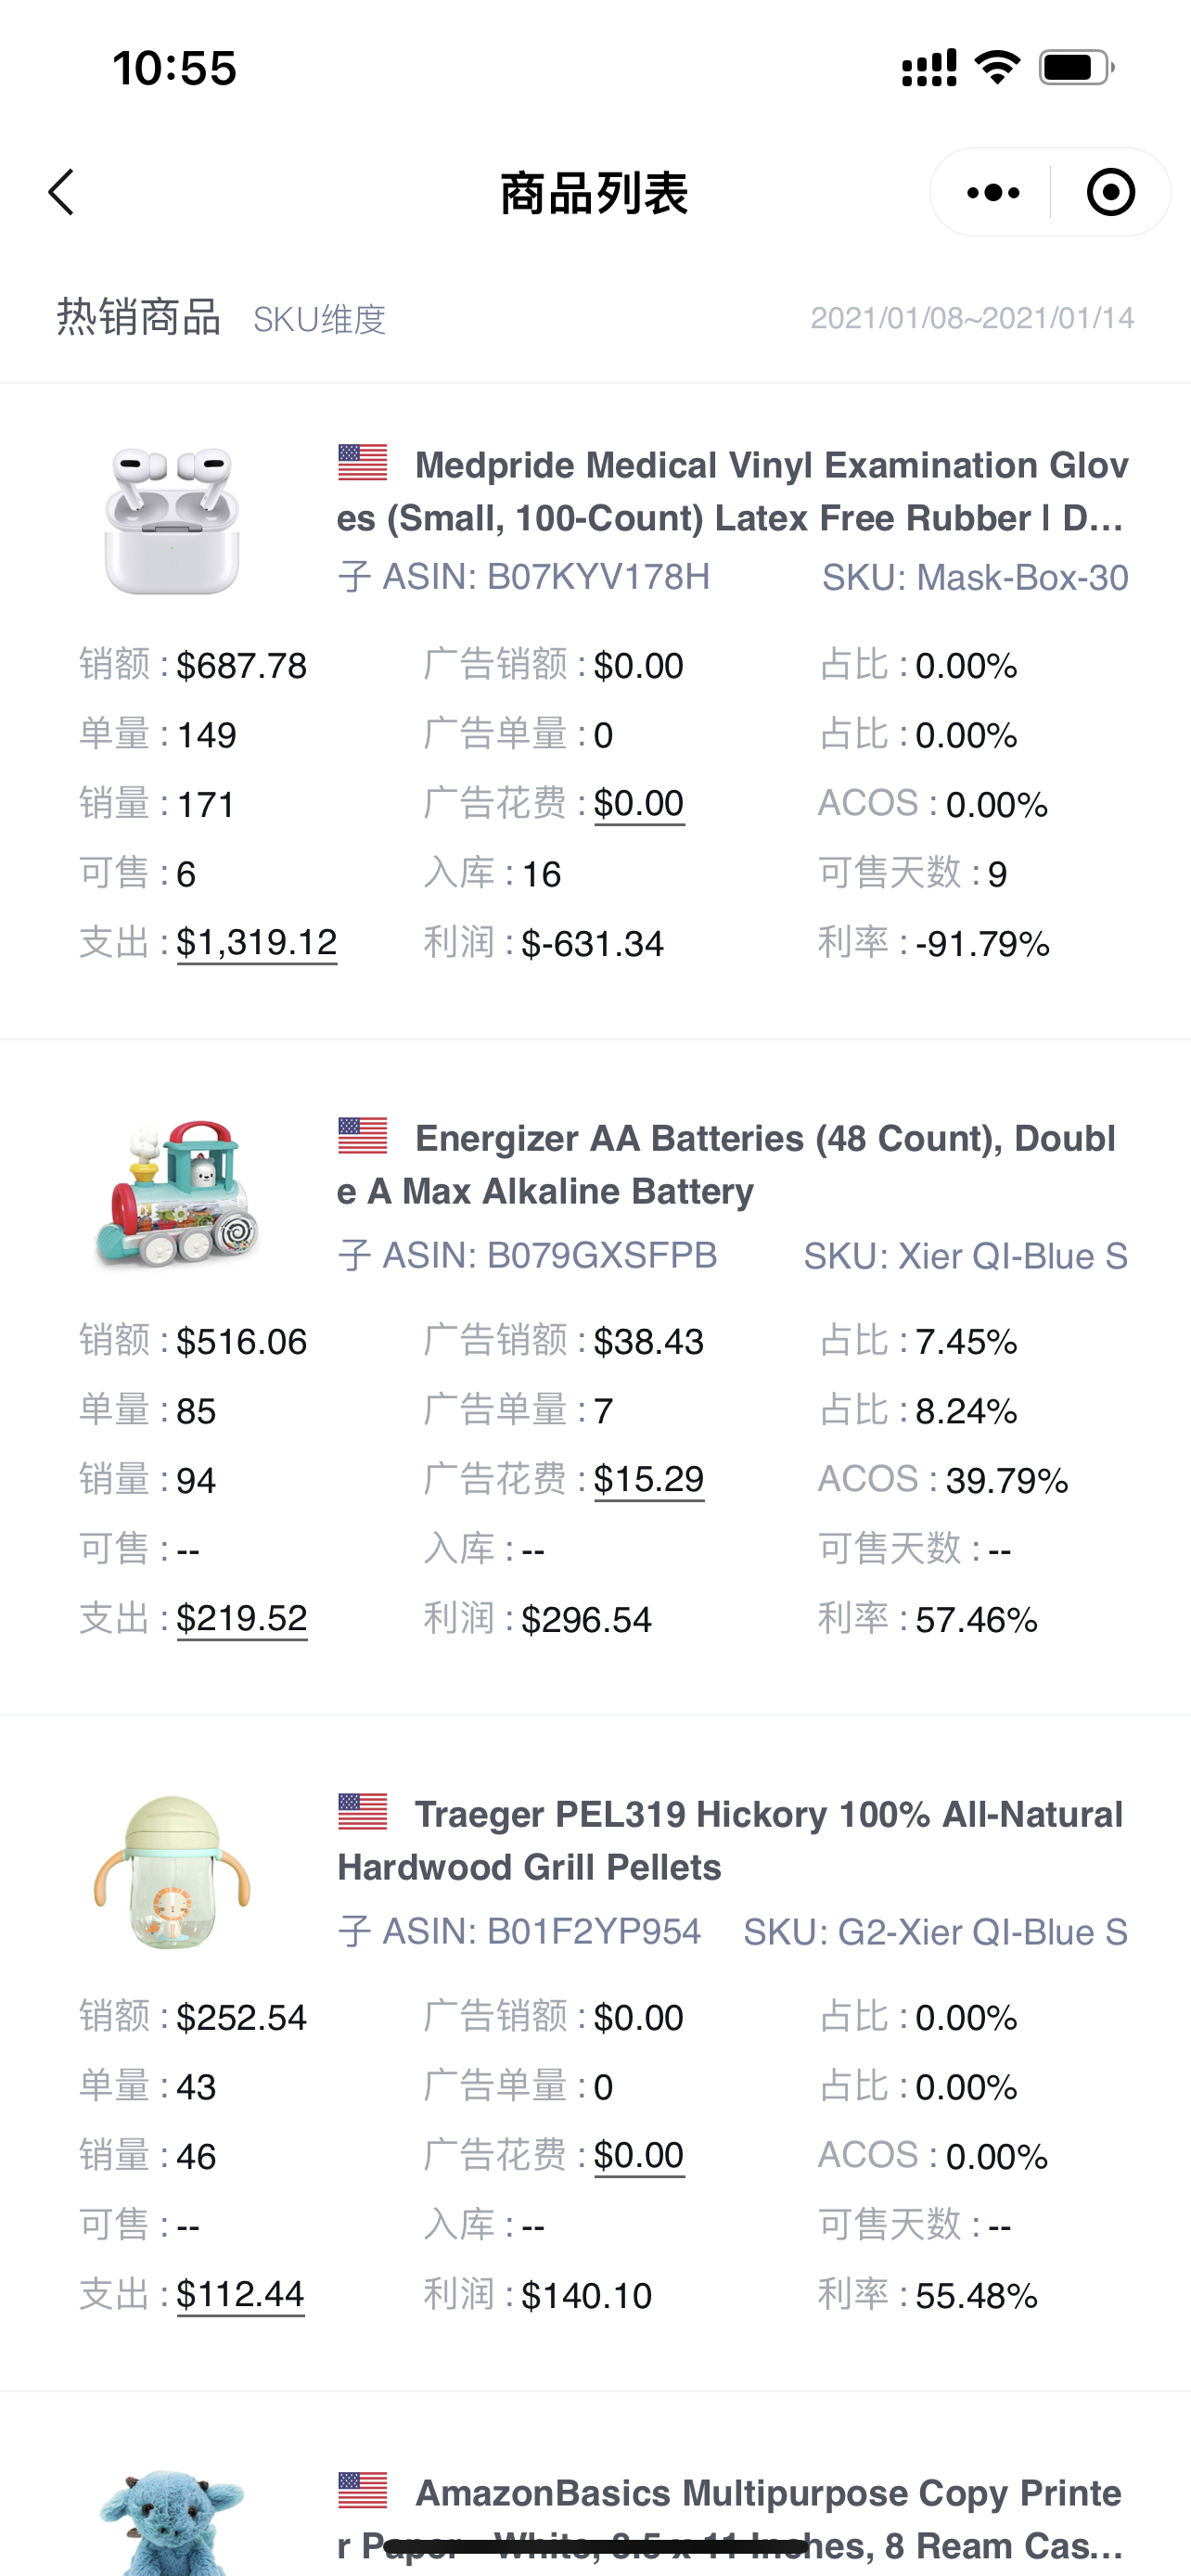
Click 【View More】 below to view the situation of all sold products in the current store during the current time period;
 +
+
All Sold Products:
 +
+
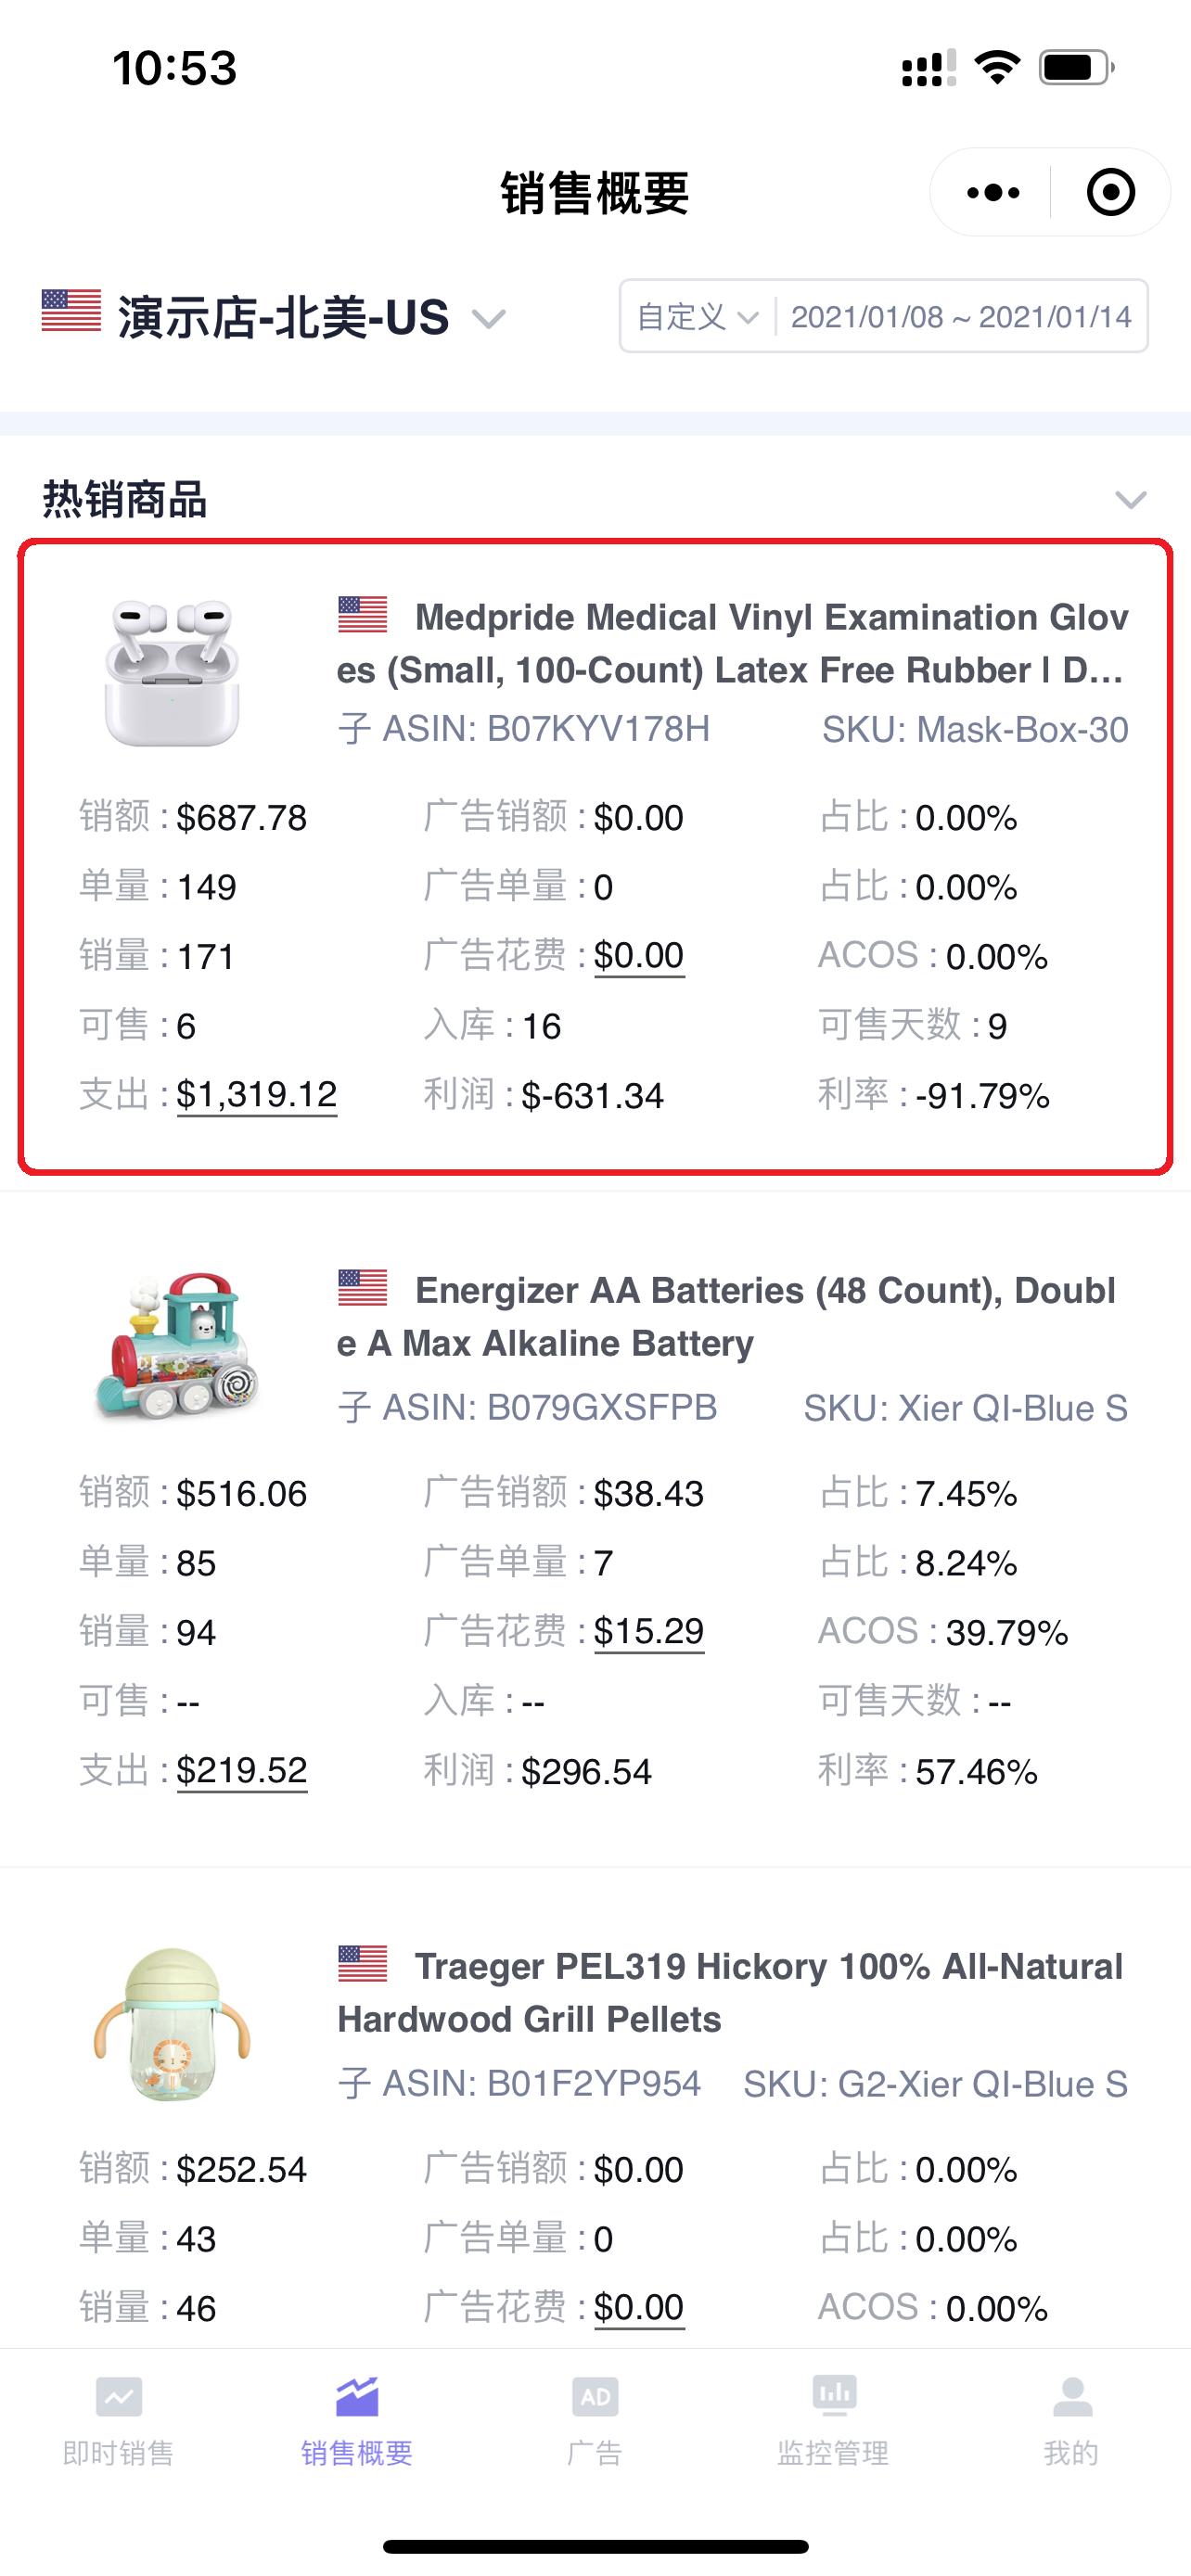
View Product Historical Sales Data
Click on a product to view the historical sales situation of the product;
 +
+
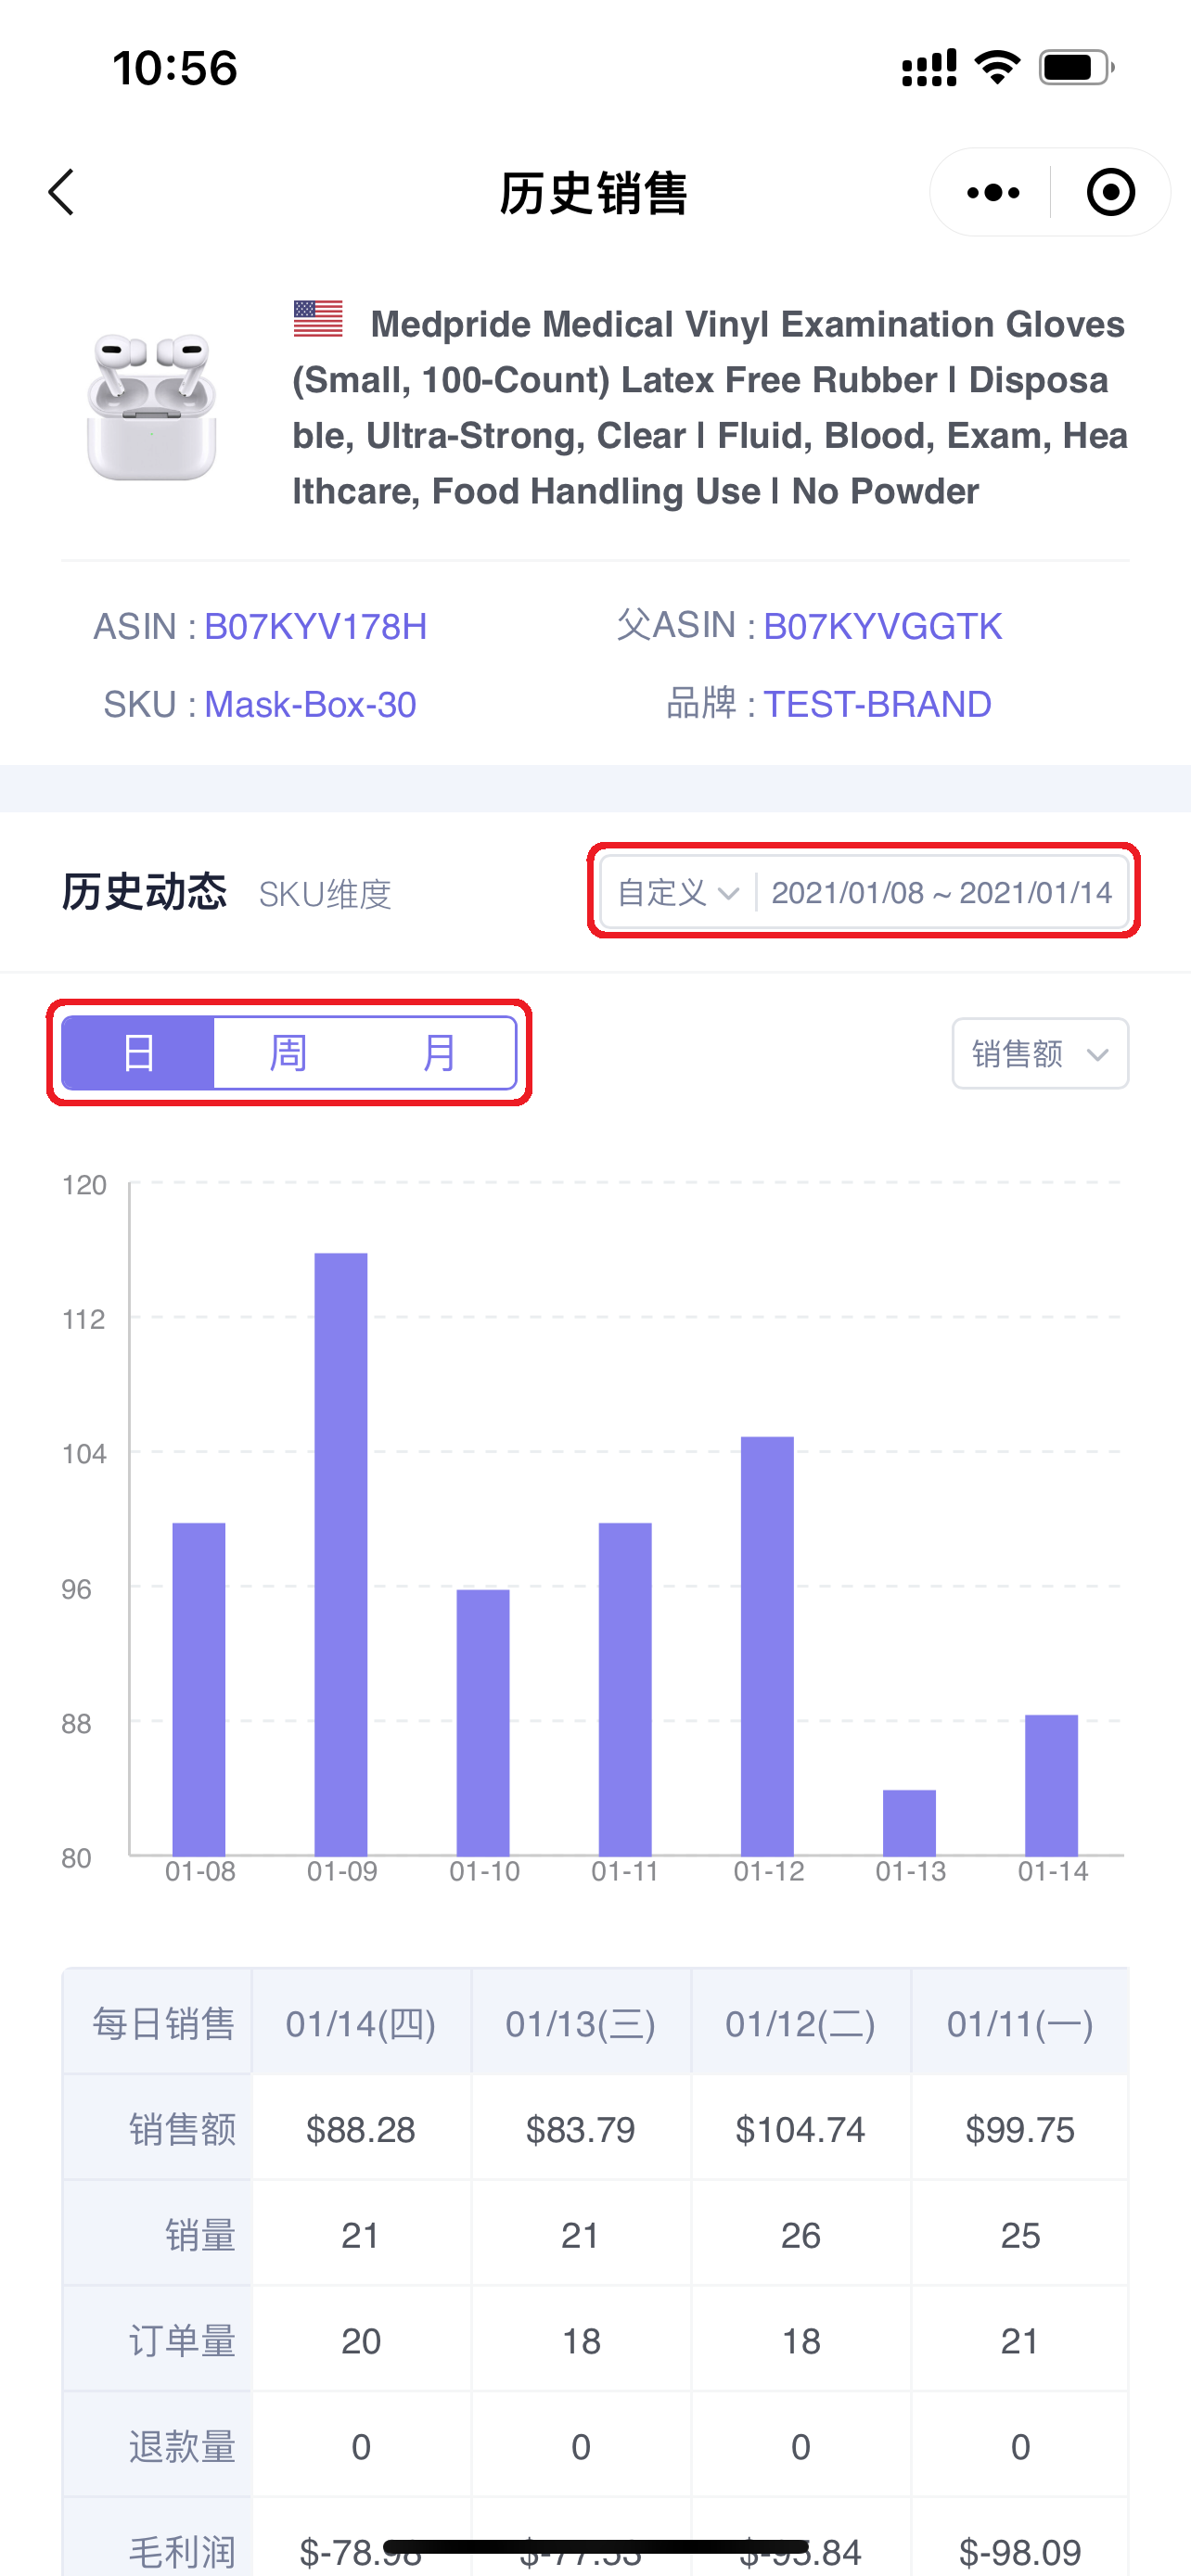
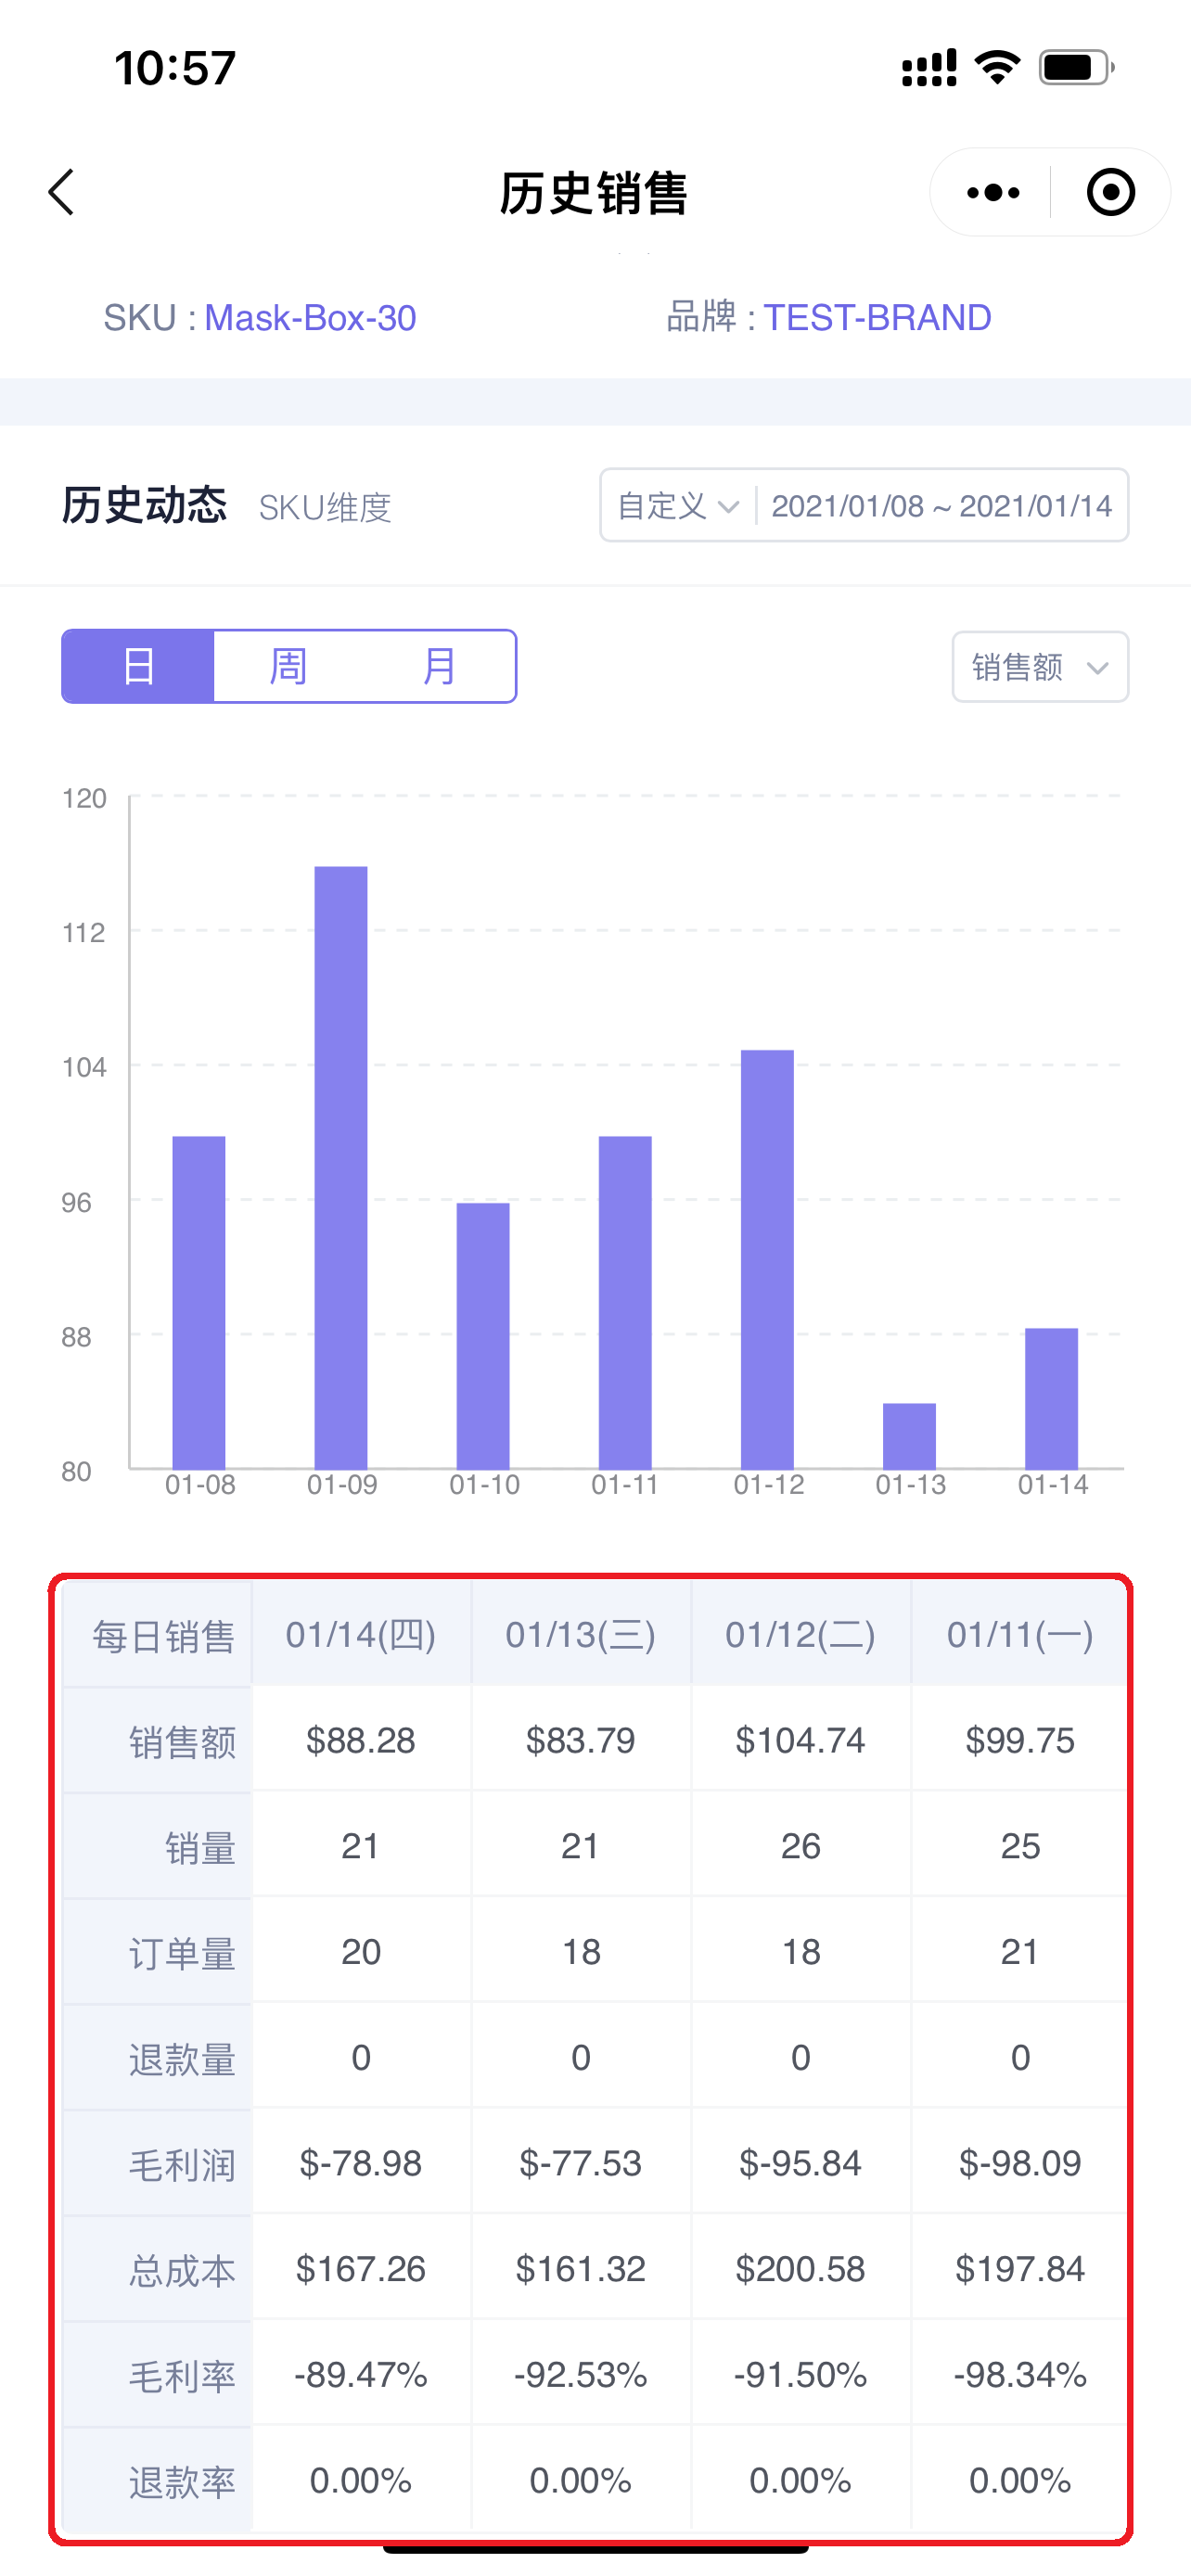
Enter the "Historical Sales" page,
You can customize the time period to view the historical situation of a certain sales metric;
And choose to view by different time dimensions, such as: Day, Week, or Month.
 +
+
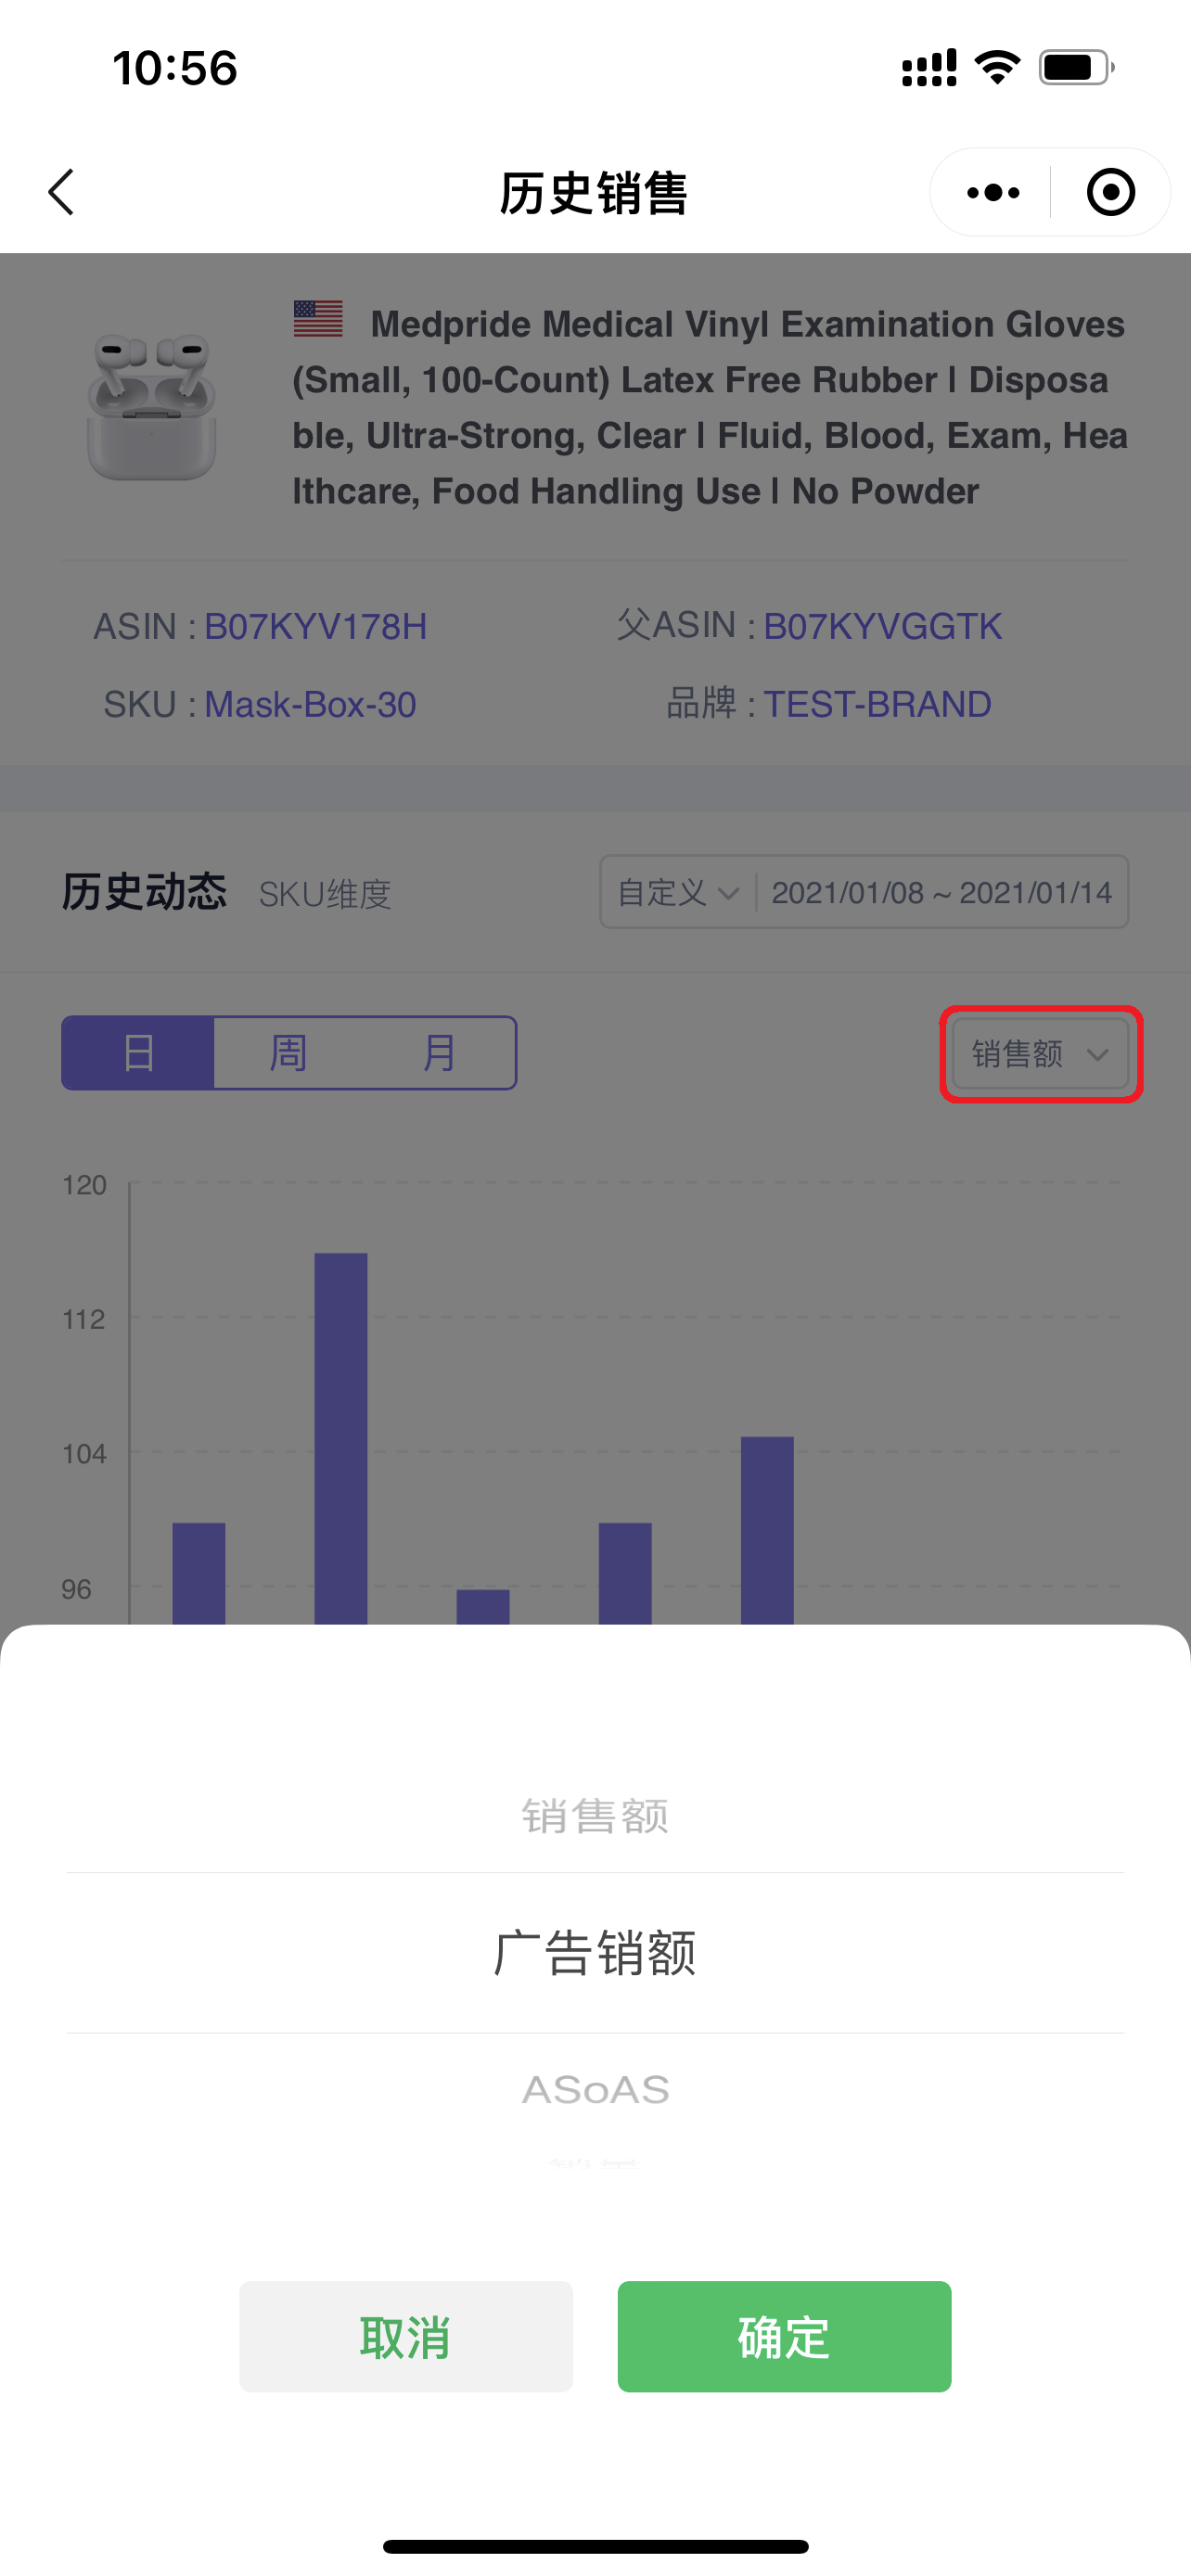
Click the metric data in the upper right corner to view the historical performance details of the corresponding metric;
 +
+
Click the bar chart to view the corresponding data details;
 +
+
Below the chart is the daily sales details of the product for the last 7 days.
Slide the data left and right to view all data.
 +
+
6. Sales Charts
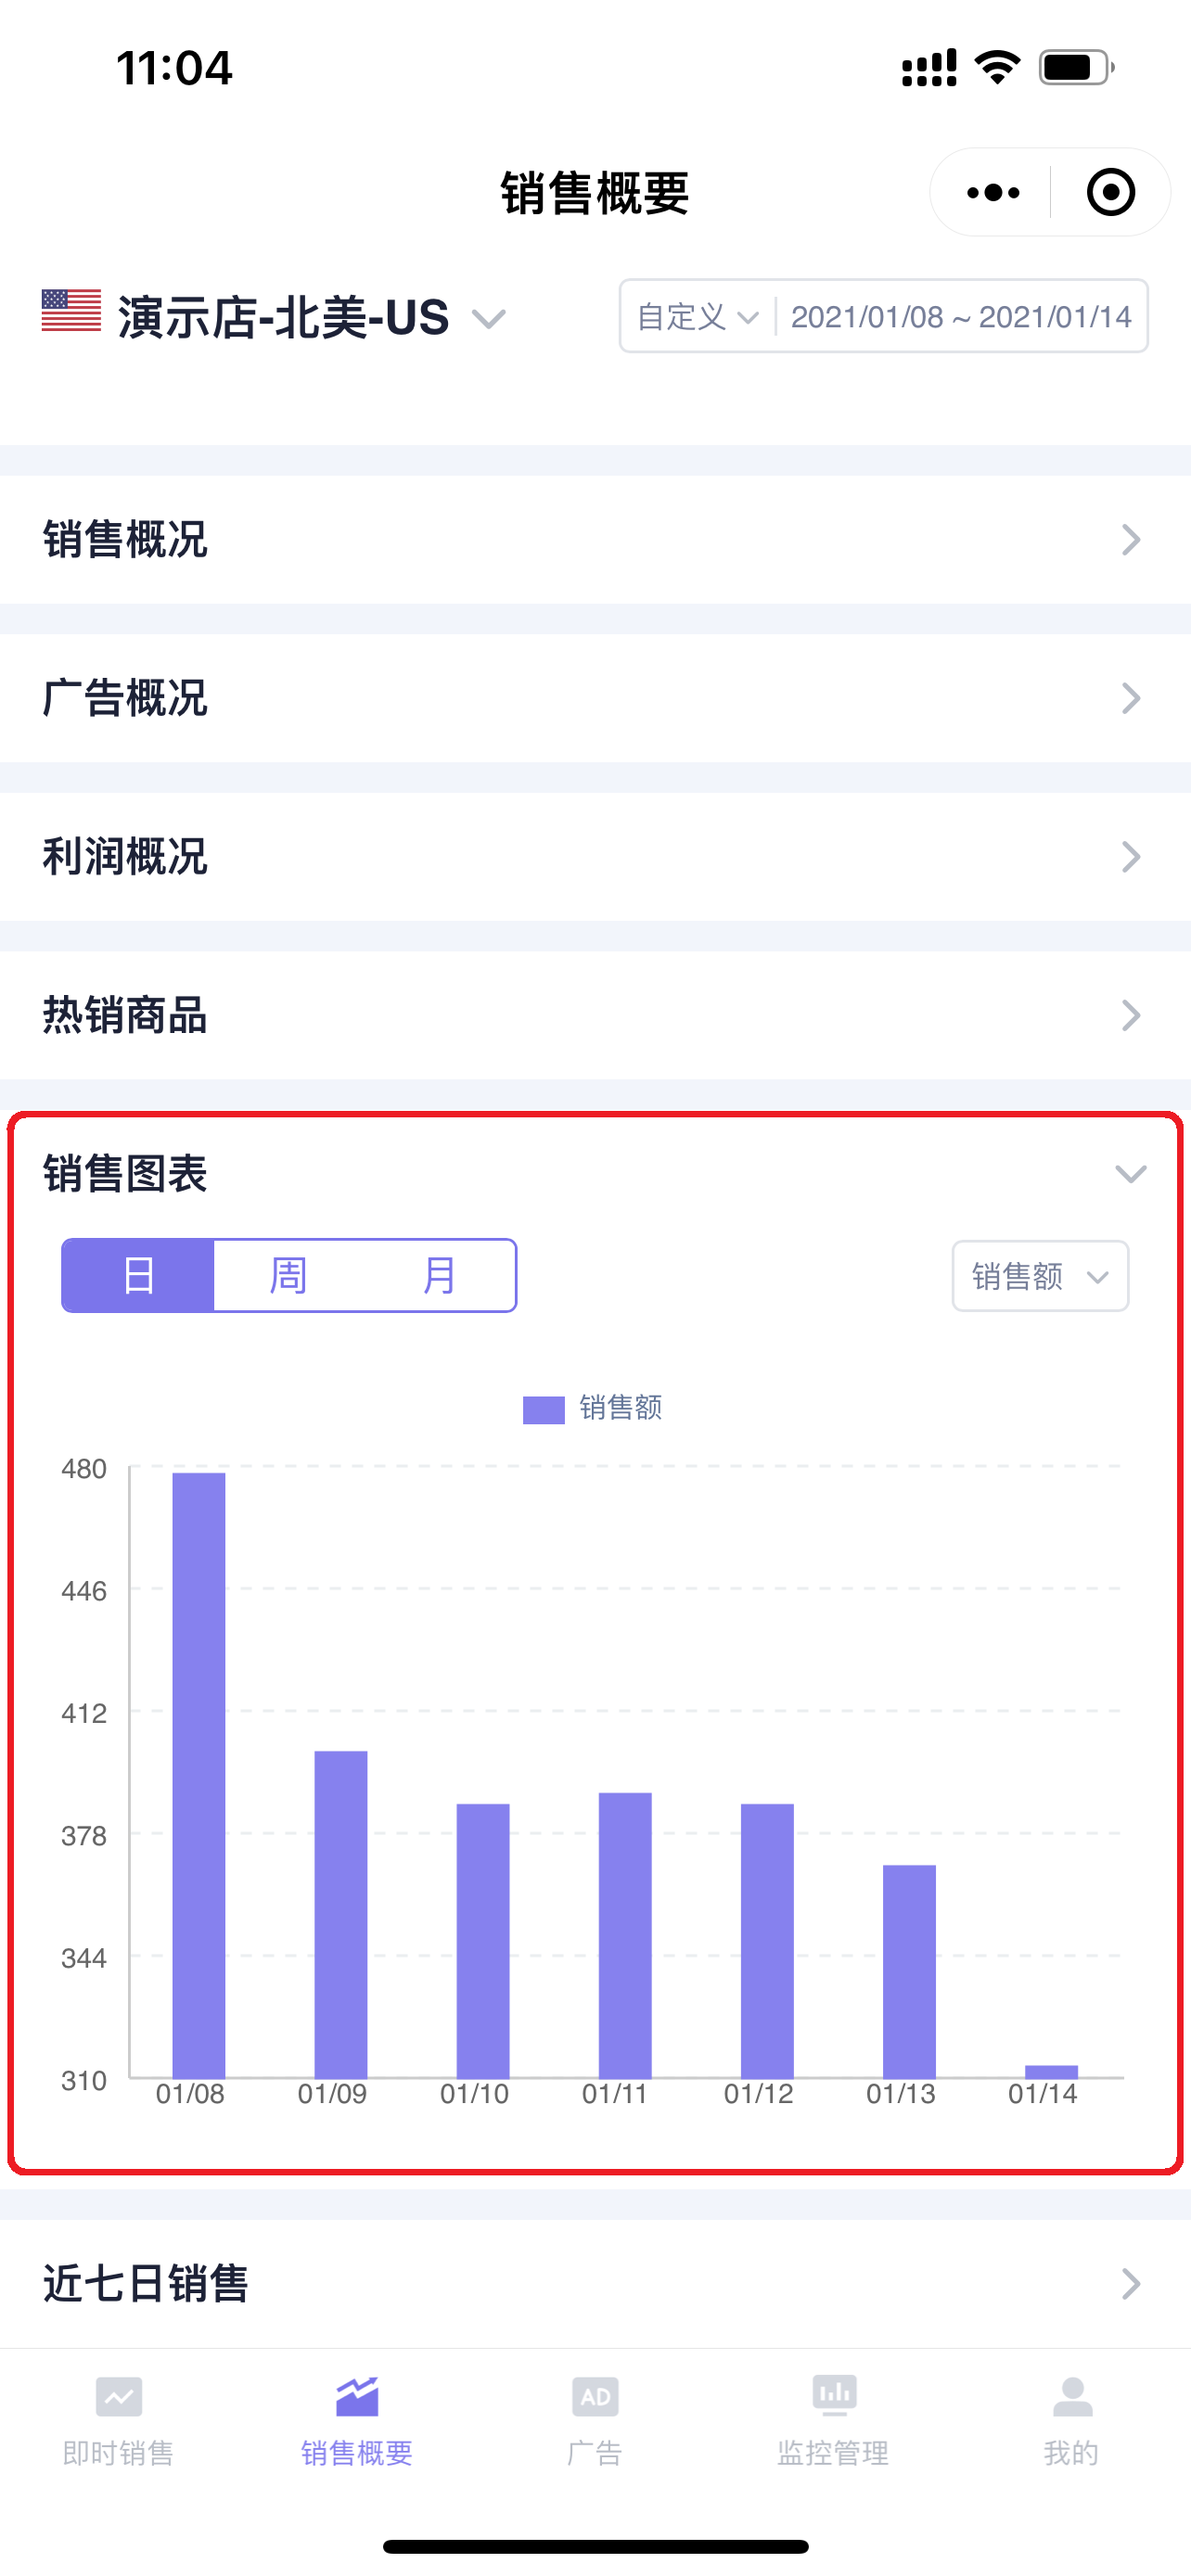
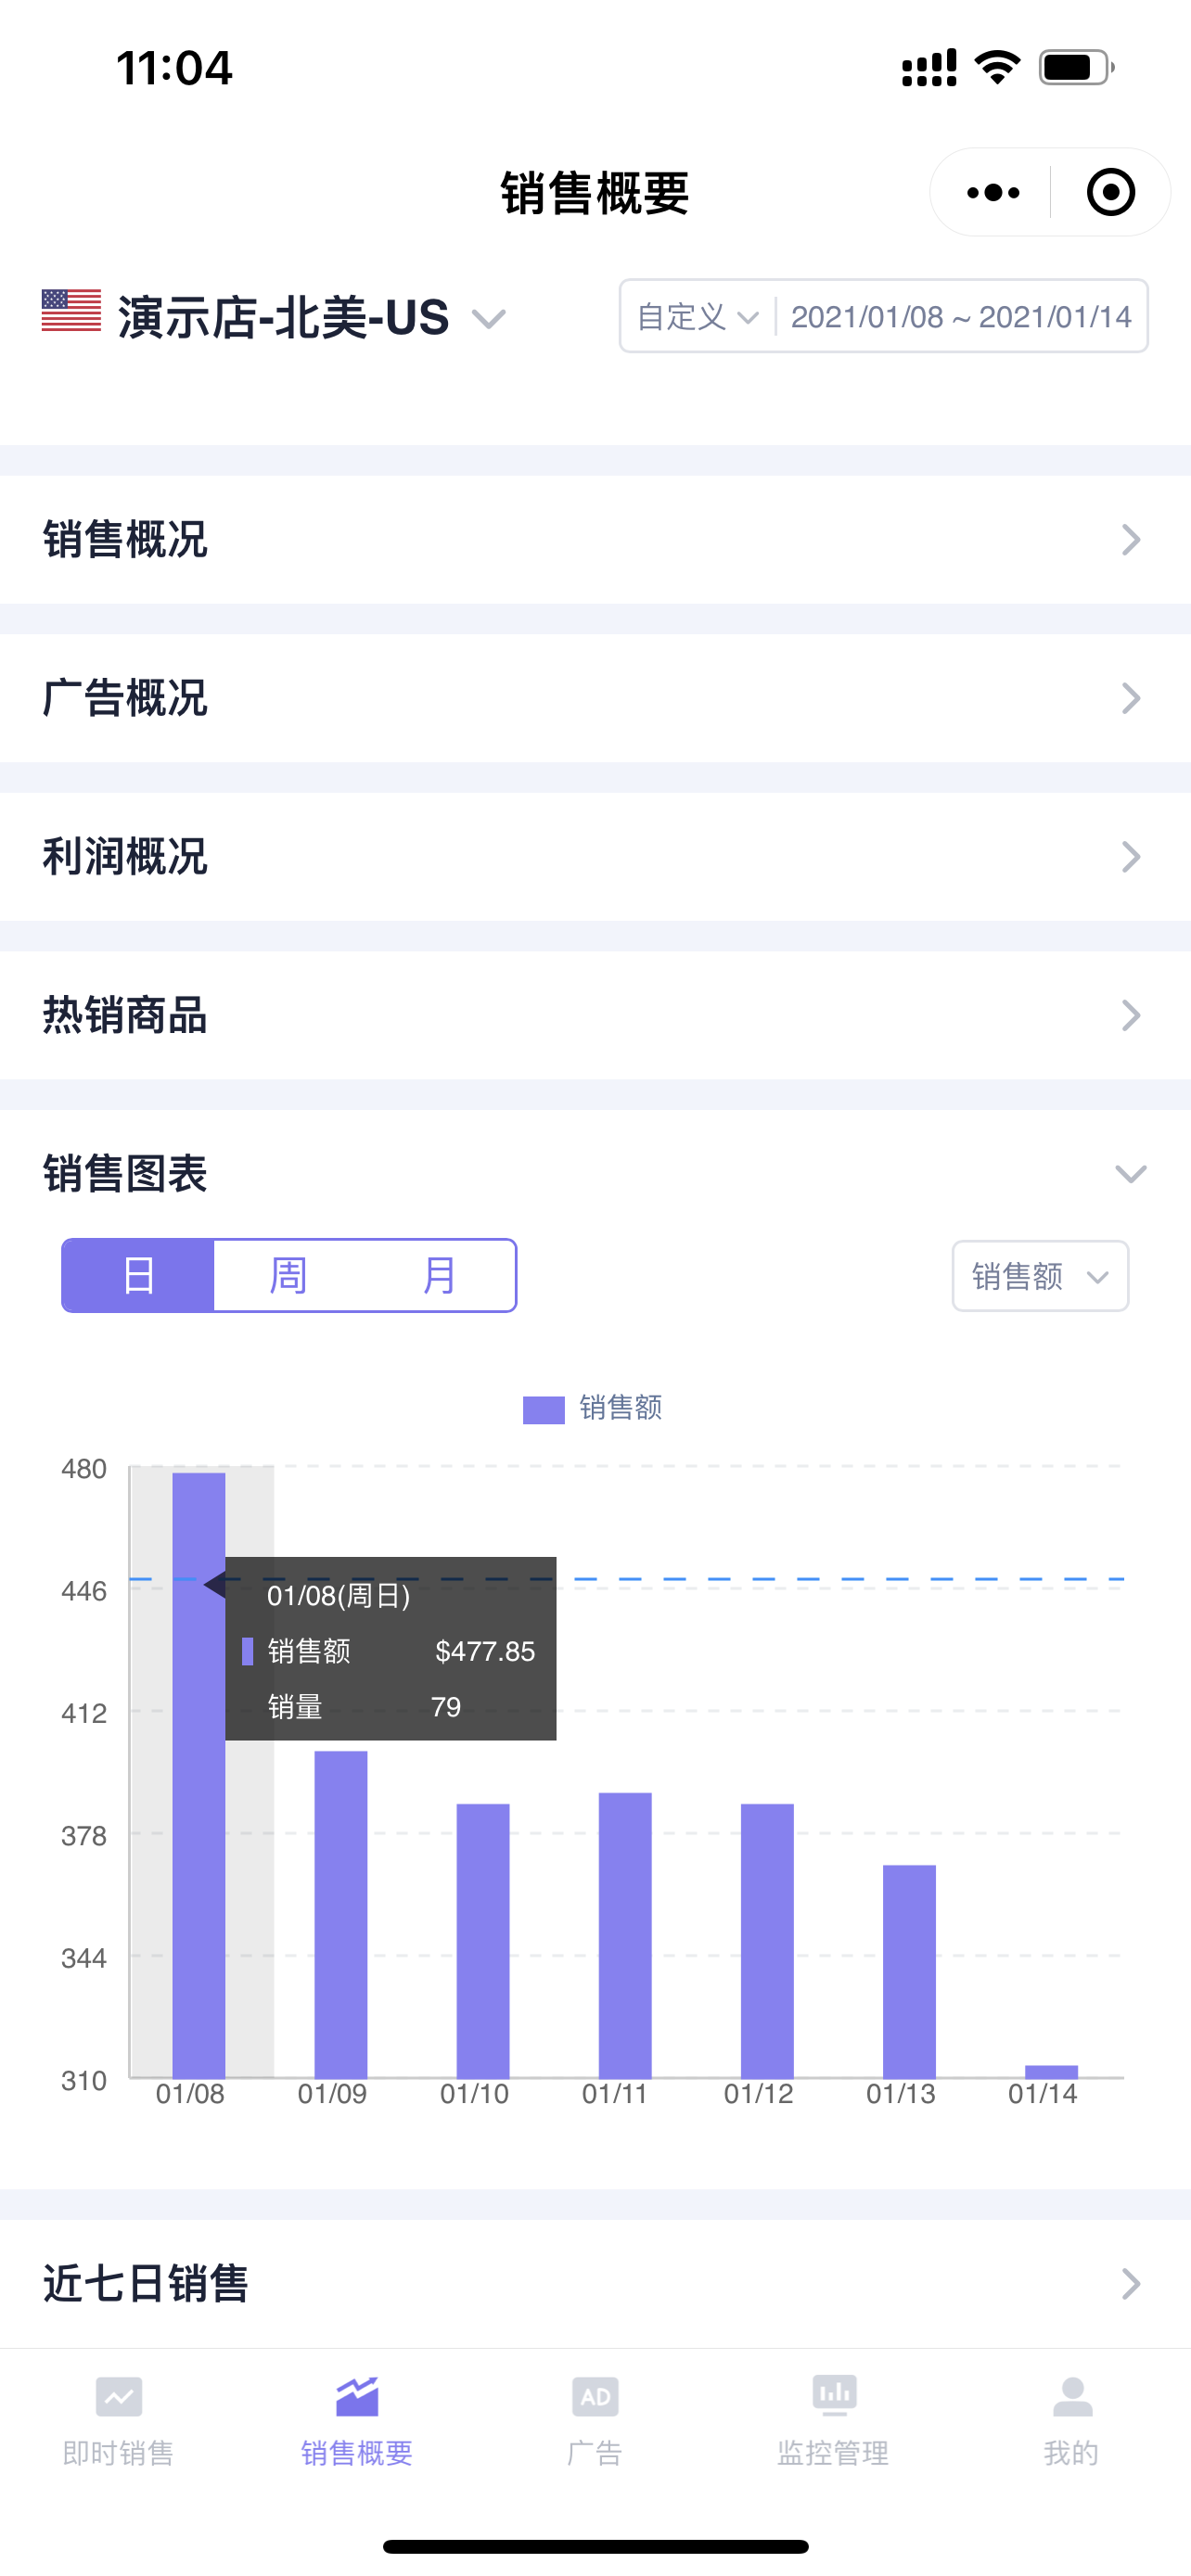
The Sales Charts section displays the bar chart data of sales data for the current store in the selected time period.
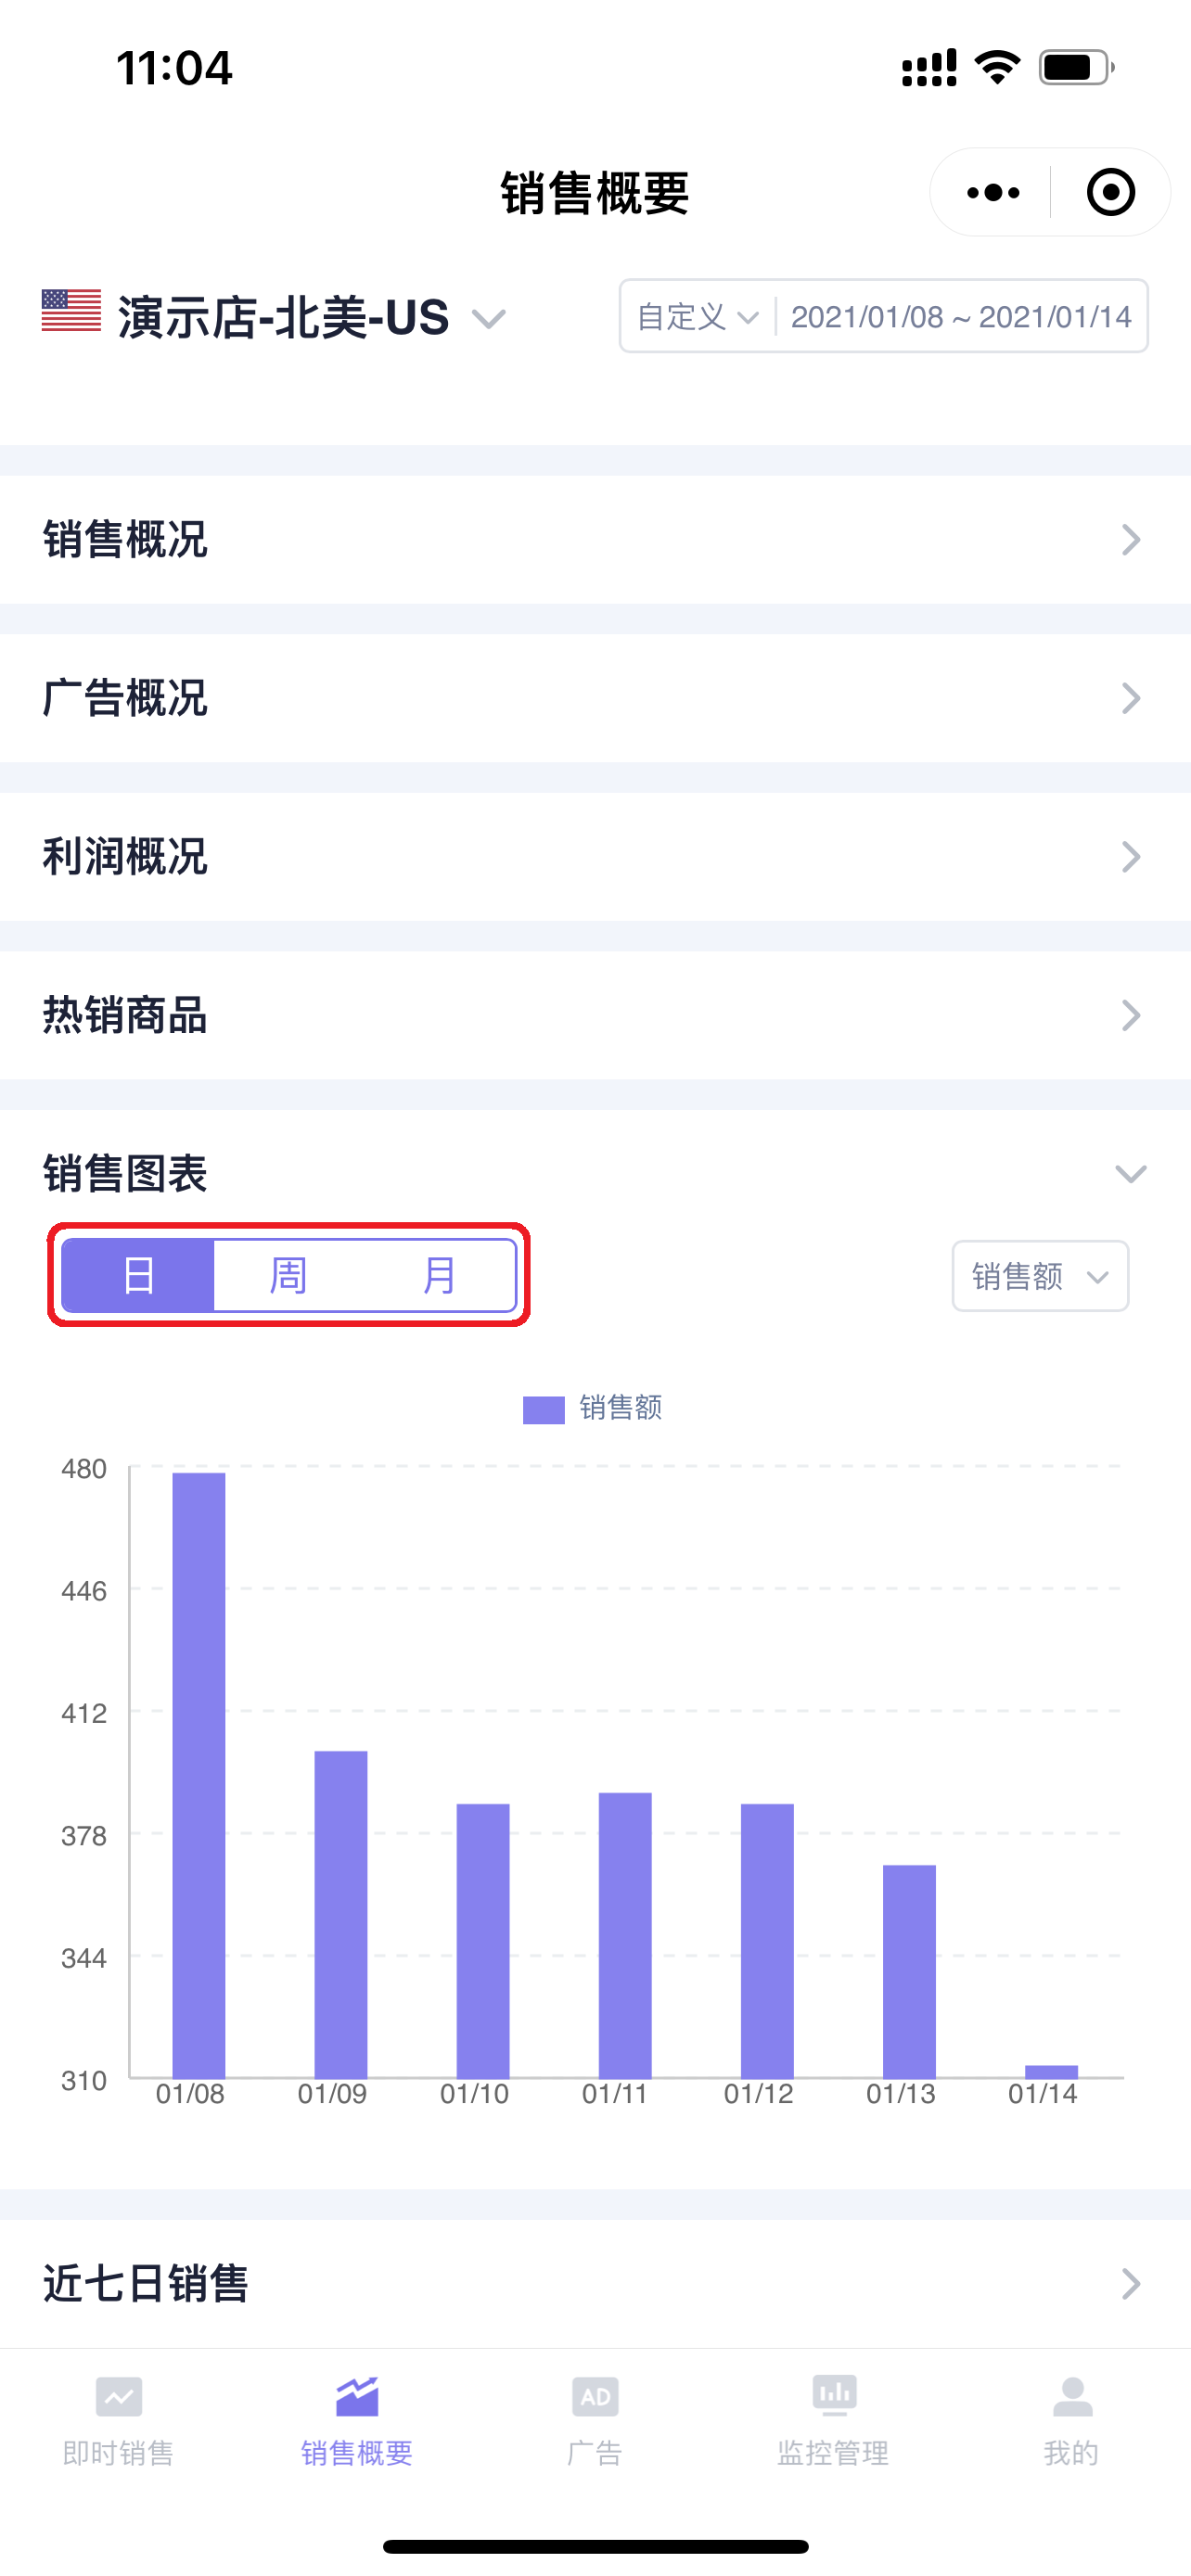
Supports viewing chart data based on Day, Week, or Month.
 +
+
Click 【Day/Week/Month】 in the upper left corner to switch the data display range;
 +
+
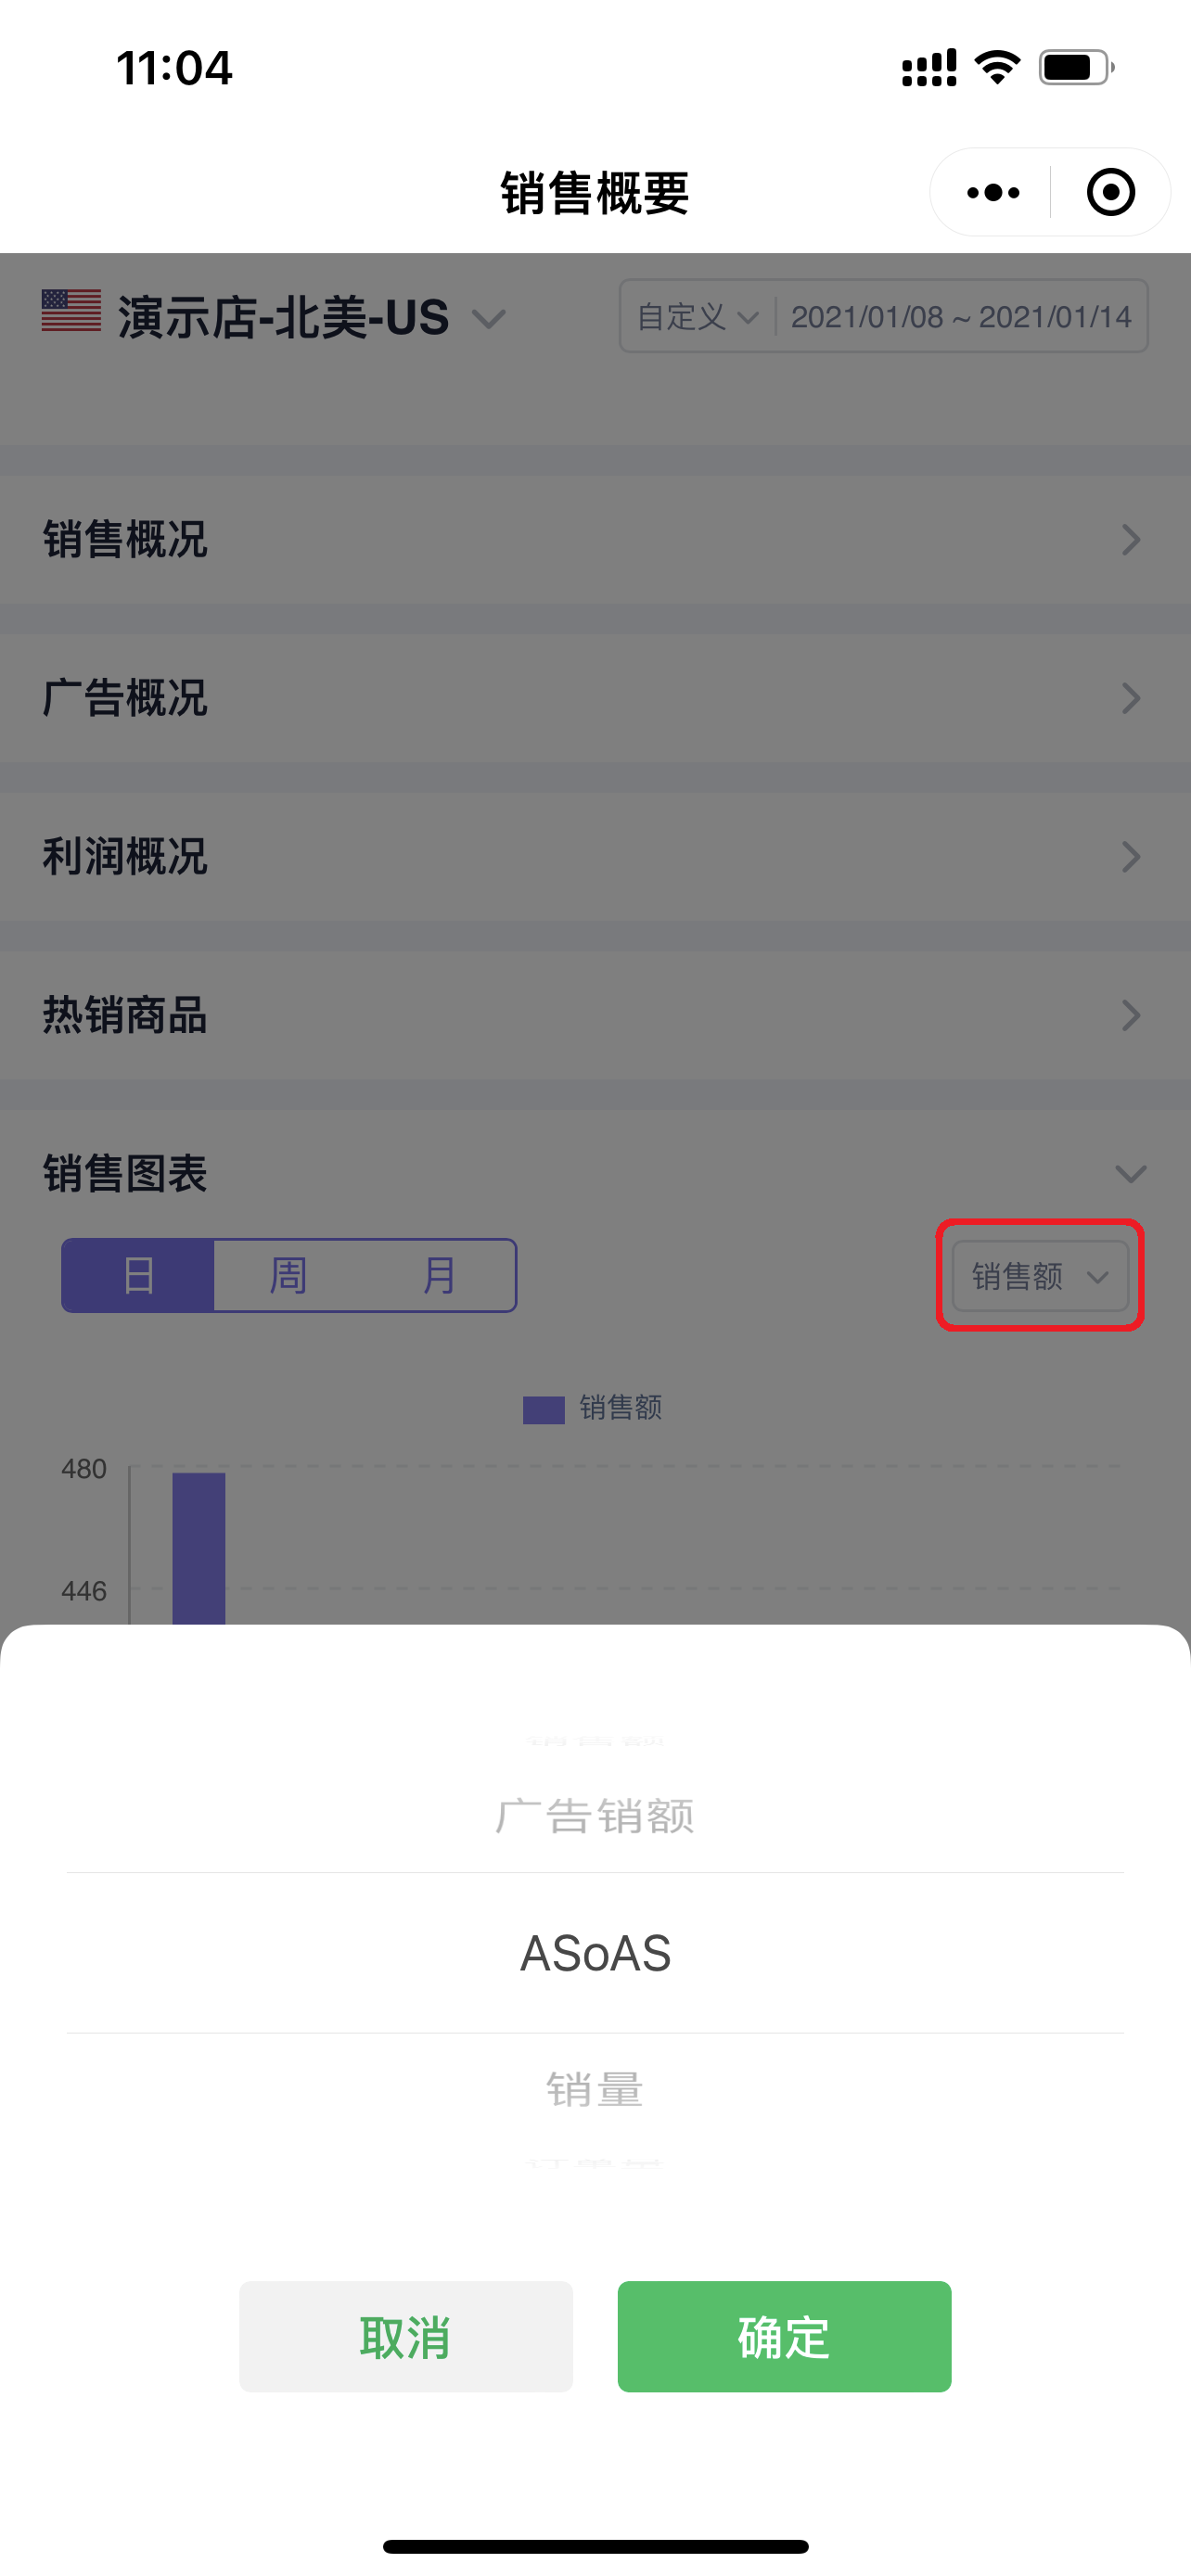
In the upper right corner of the chart, you can switch the displayed metric data.
Including: Sales Revenue, Advertising Sales, ASoTS (Advertising Sales Percentage), Units Sold, Order Volume, Advertising Orders, Order Percentage, Total Expenses, Advertising Spend, ACoTS (Advertising Cost Percentage), ACOS, Gross Profit, Gross Profit Margin.
 +
+
Similarly, click the bar chart to view the corresponding details.
 +
+
7. Last 7 Days Sales
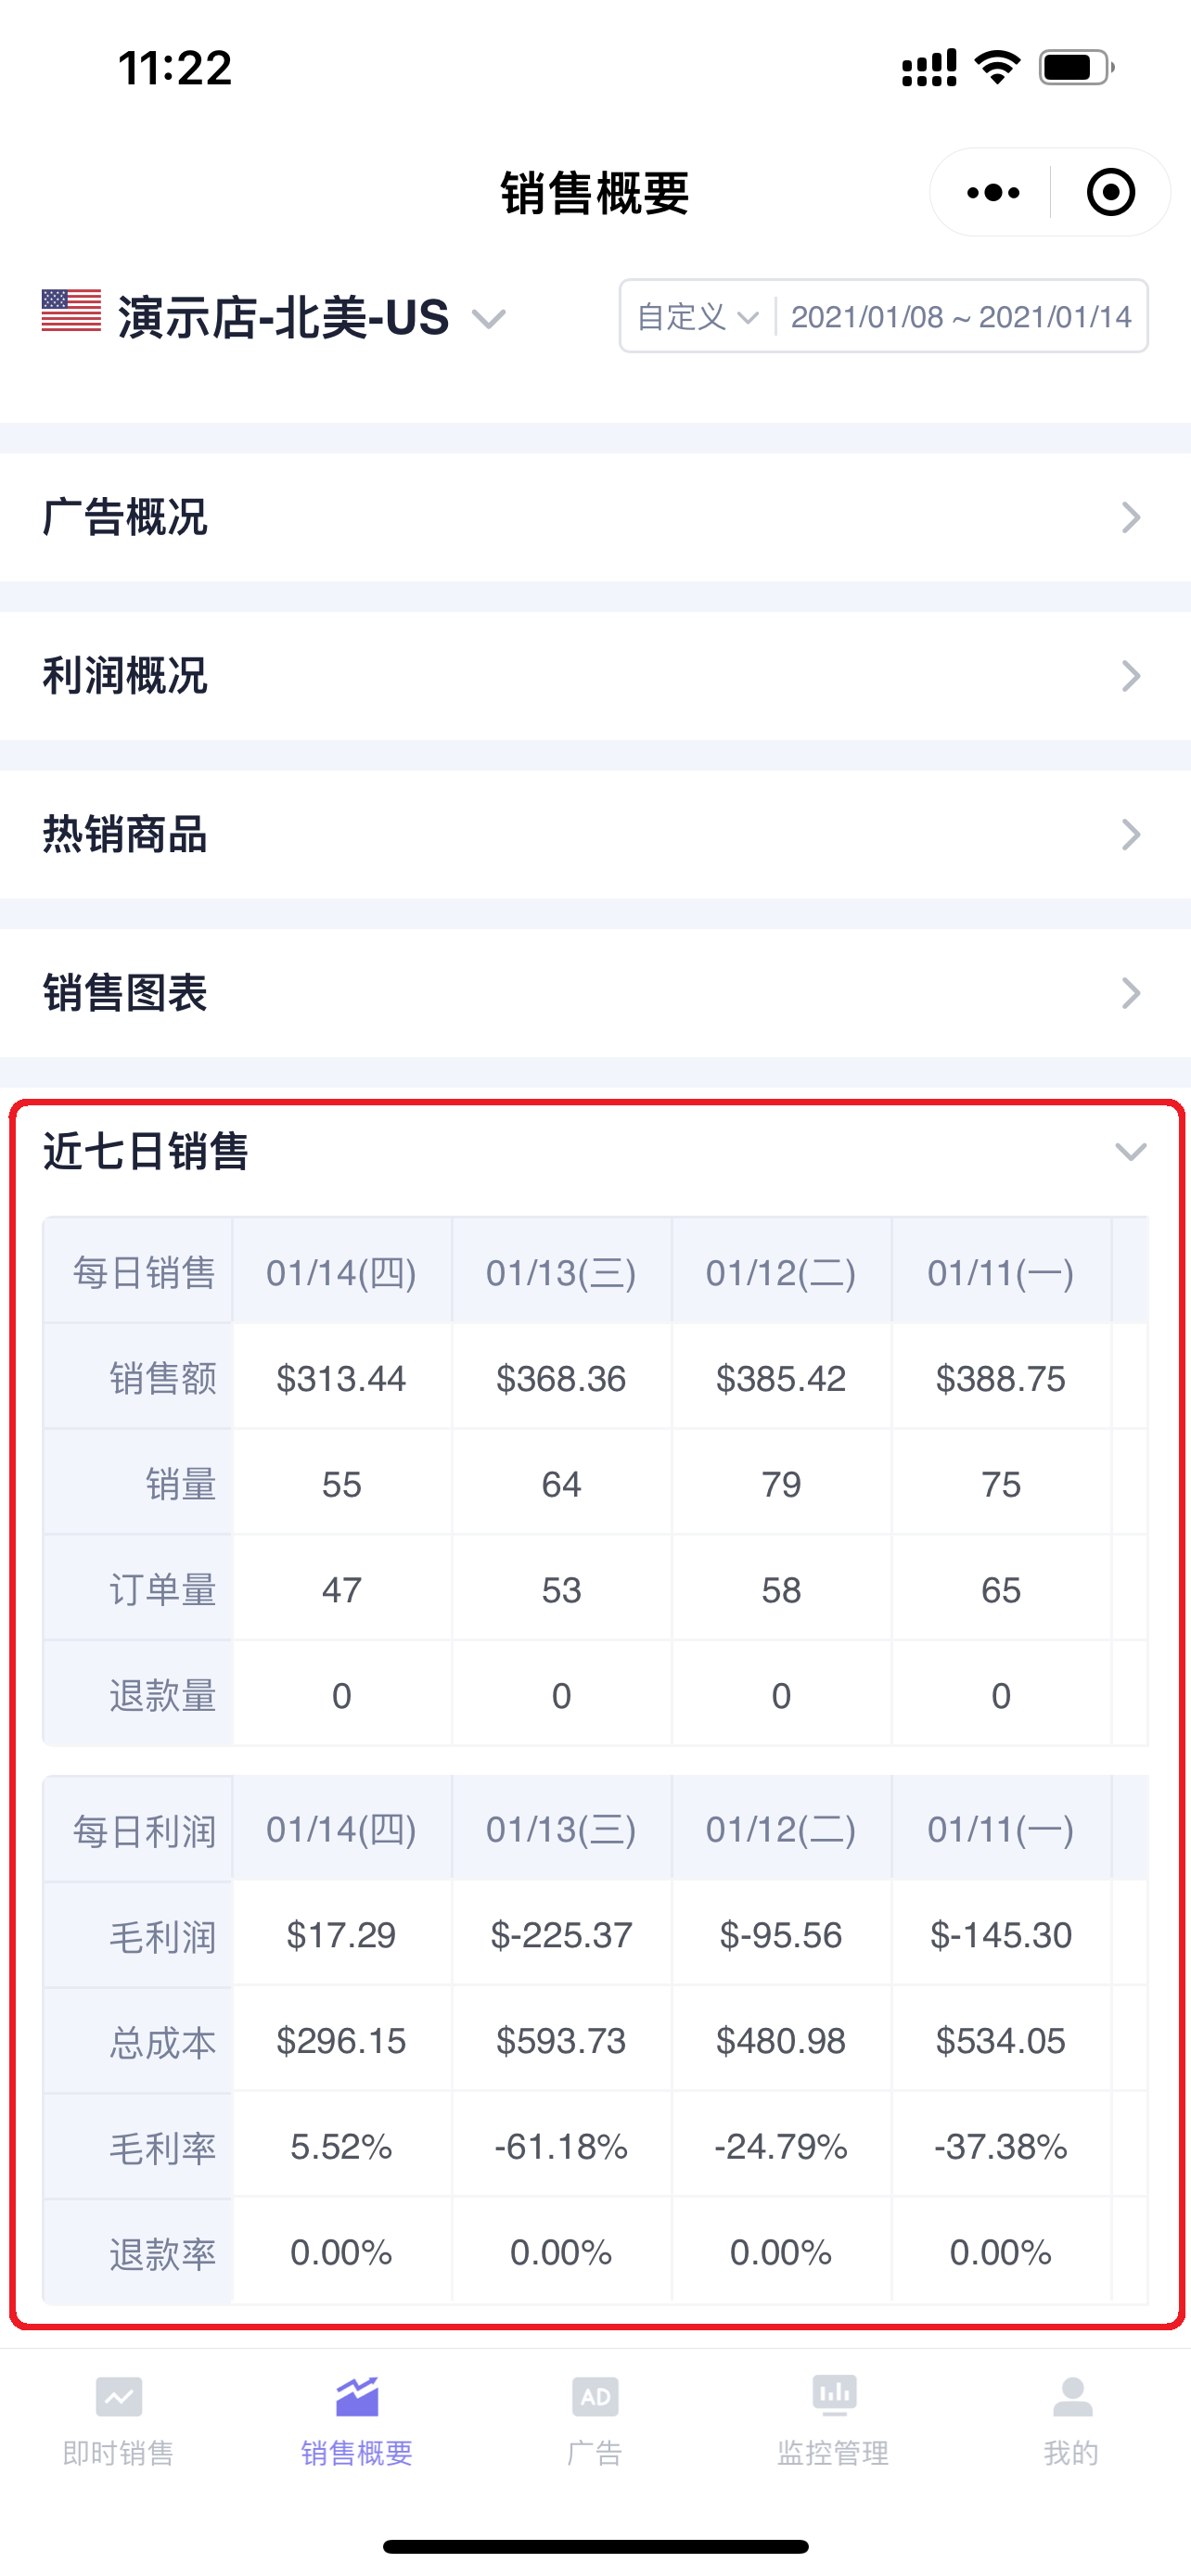
The Last 7 Days Sales section displays the daily sales and profit data of the current store for the last 7 days, helping you compare and analyze recent sales changes.
 +
+
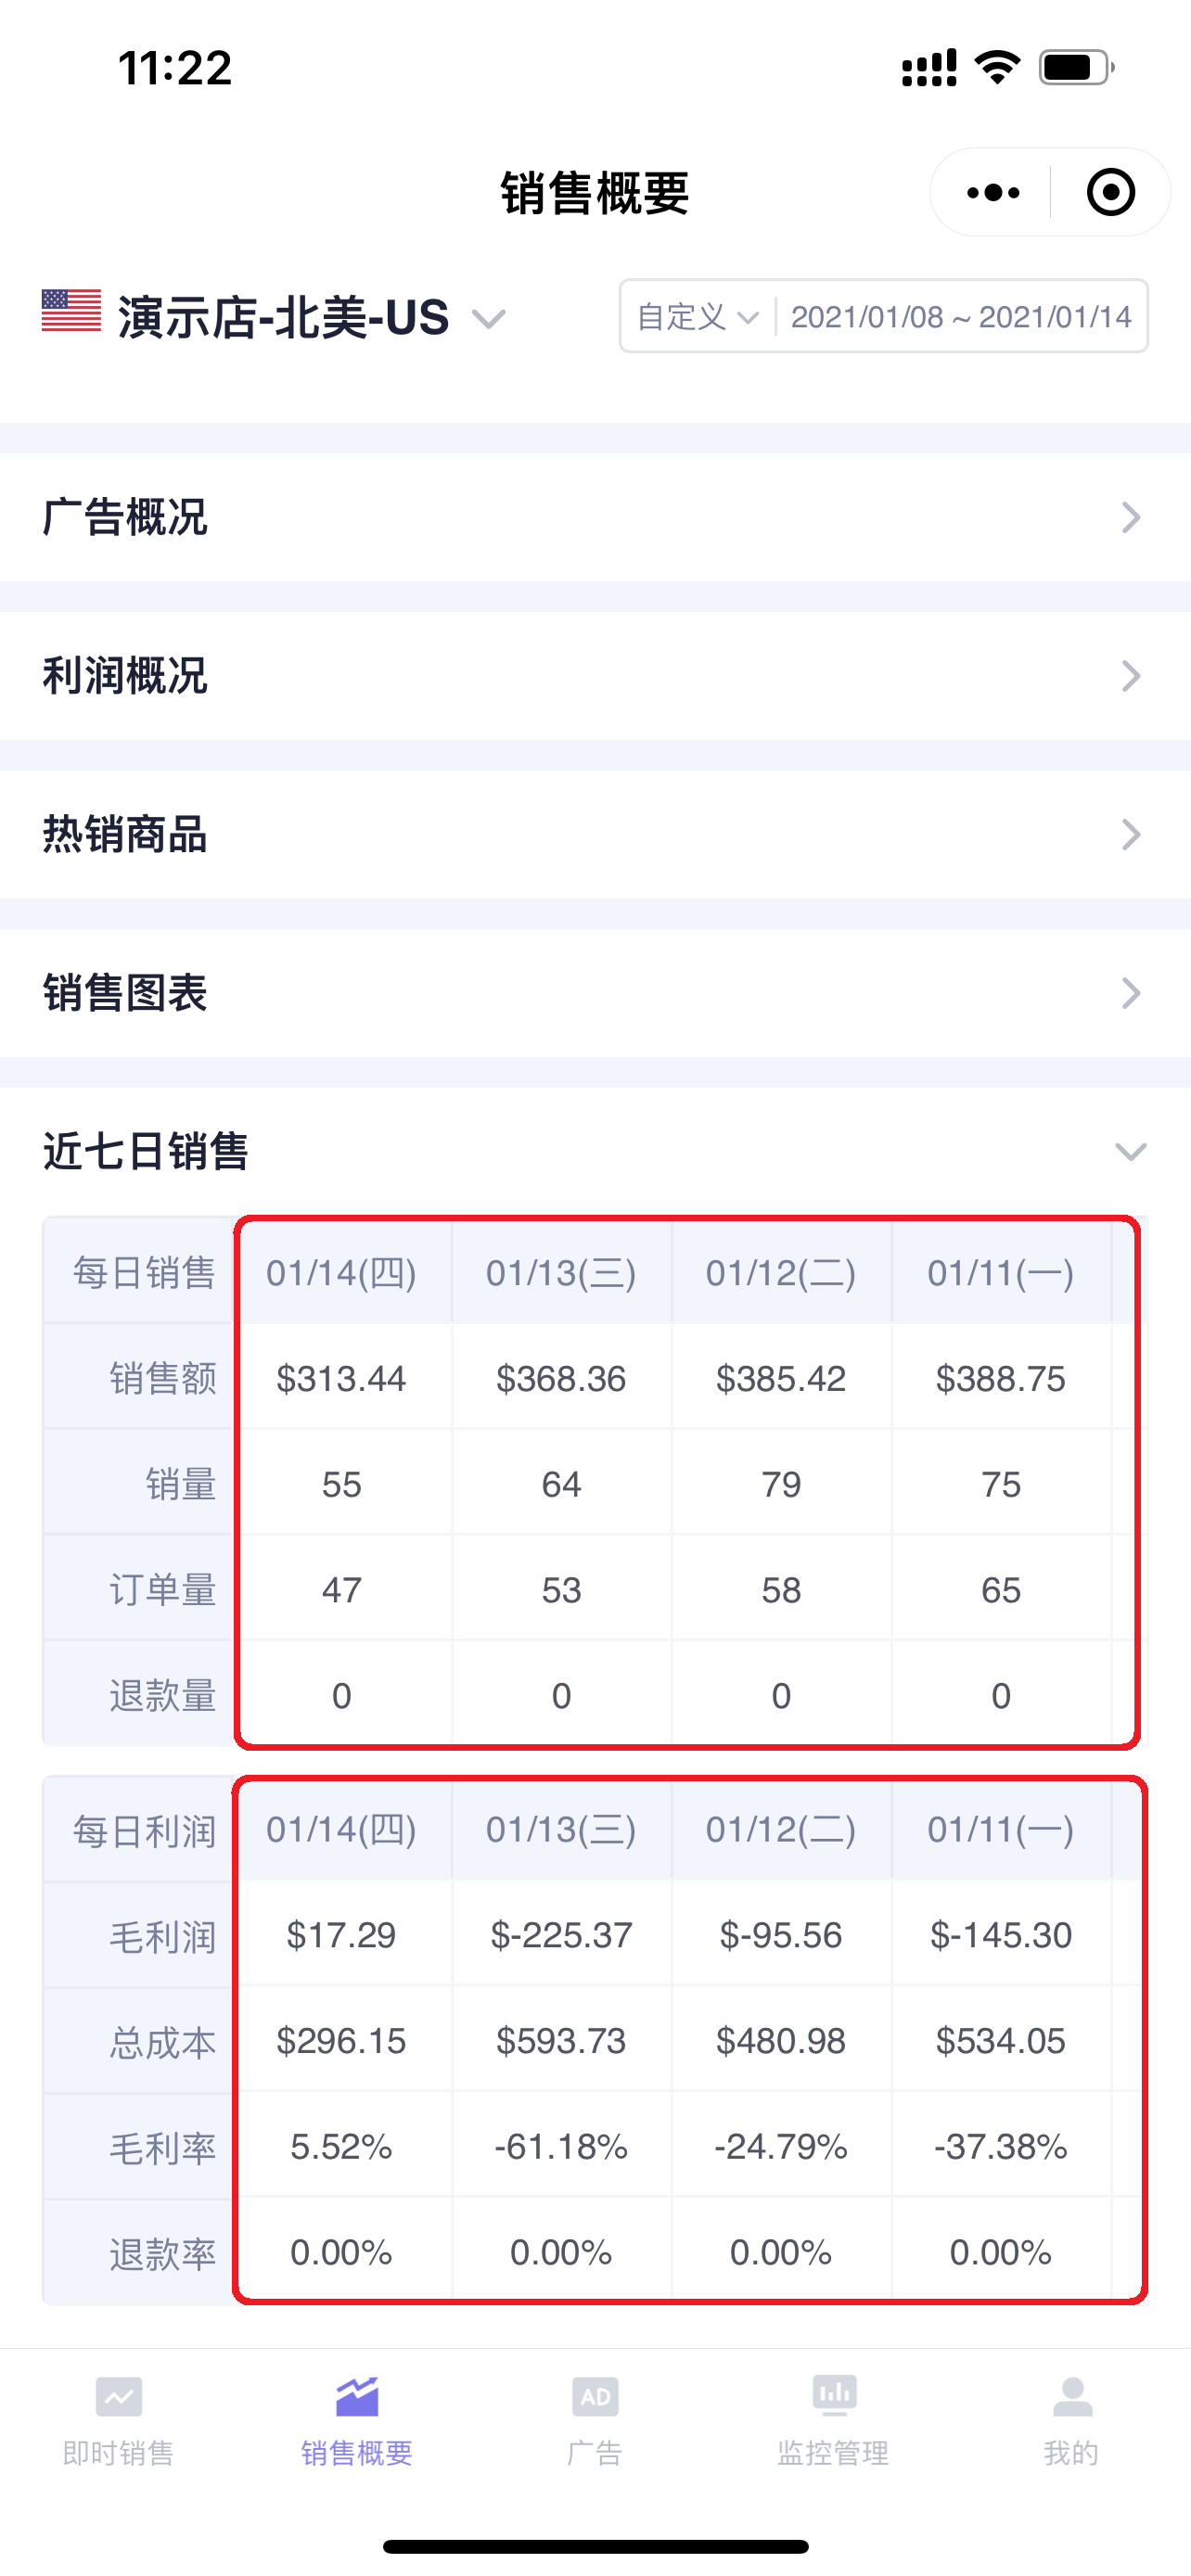
Slide the data bar left and right to view all data for the last 7 days;
 +
+
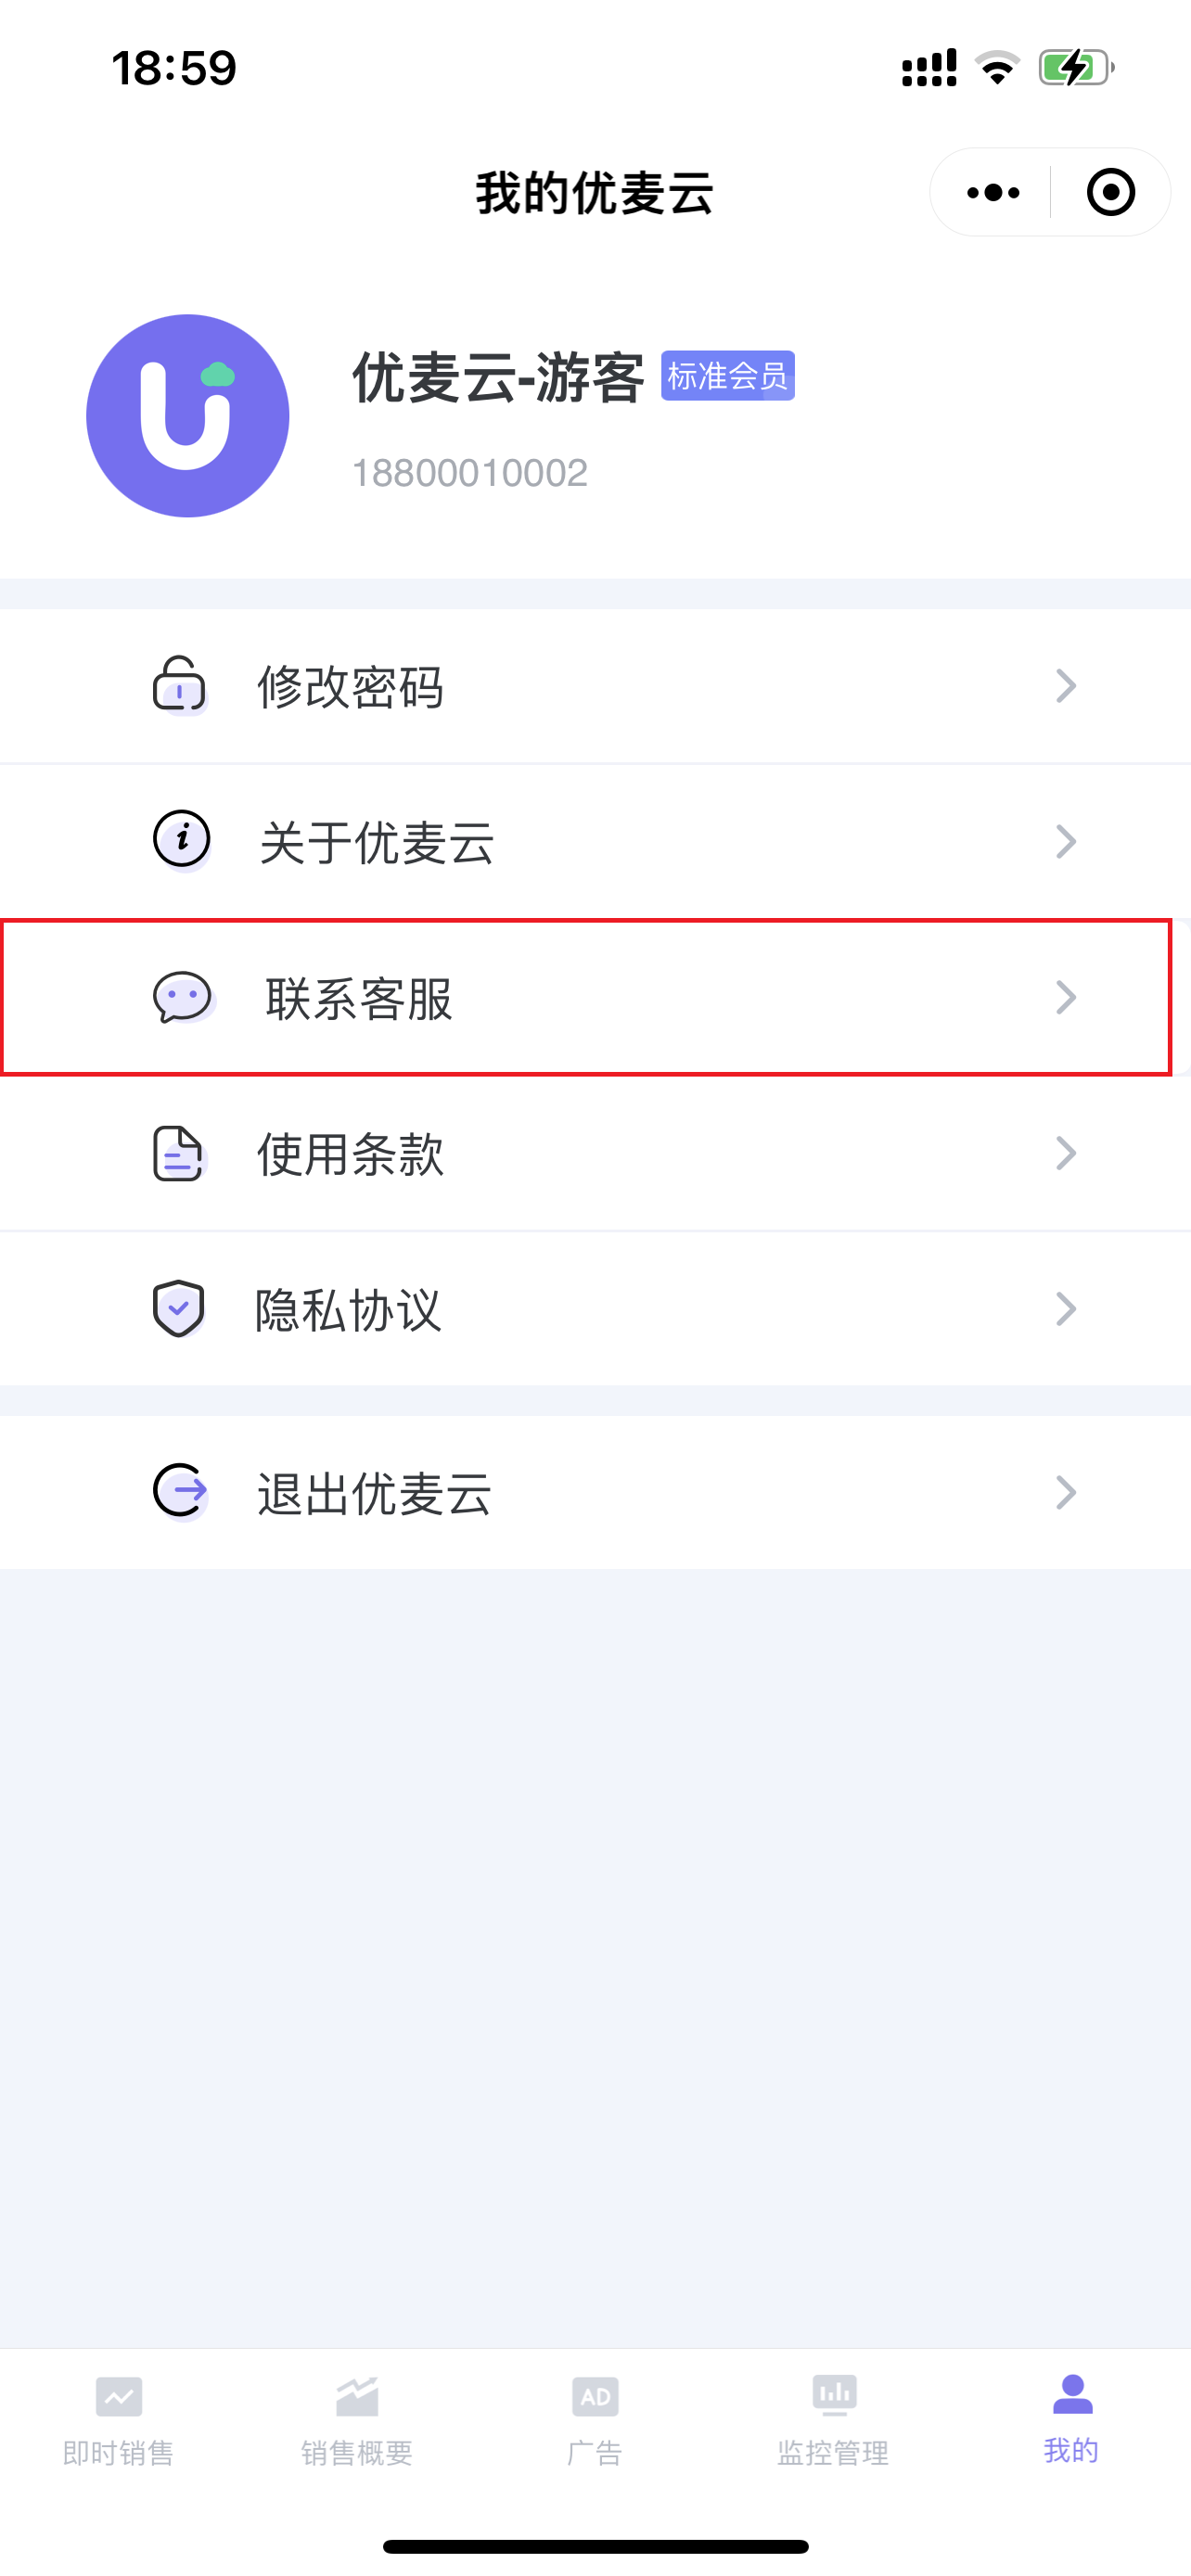
If you encounter anything unclear during use, you can click 【My】 and select 【Contact Customer Service】 to add our WeChat customer service representative, who will answer your questions online~
 +
+


