


2025/03/21Number of reading(14527)Number of comments(0)
I. Target Audience
Business Owners, Operations
II. Feature Introduction
Anyone who has worked with Amazon knows that Seller Central sales data is fragmented. To perform systematic data operation analysis, you need to download various reports and manually compile sales, advertising, profit, and other data. This is time-consuming and laborious, and if you're not careful and make a mistake, you may have to double-check and correct the entire sheet, which is very difficult.
SellerSpace - Sales Overview feature automatically summarizes various sales data for your store. It can help you easily view and analyze the specific sales situation of different stores, different time periods, and different products, quickly grasp core sales data, understand sales trends, and individual product sales details. It also supports exporting the current summarized data, helping you easily create weekly and monthly reports!
The Sales Overview feature is divided into three sections: Dashboard, Sales Chart, and Sales Products.
Dashboard: Displays key metrics data related to sales, profit, and advertising;
Sales Chart: Displays sales trend data for stores and advertising, including a total of 14 sales metrics;
Sales Products: Displays detailed sales data for each selling product.
III. Usage Scenarios
- Analyze the sales overview of the store in different time periods, as well as the sales overview of different products;
- Export sales overview data and charts to quickly create weekly and monthly reports;
IV. Operation Guide
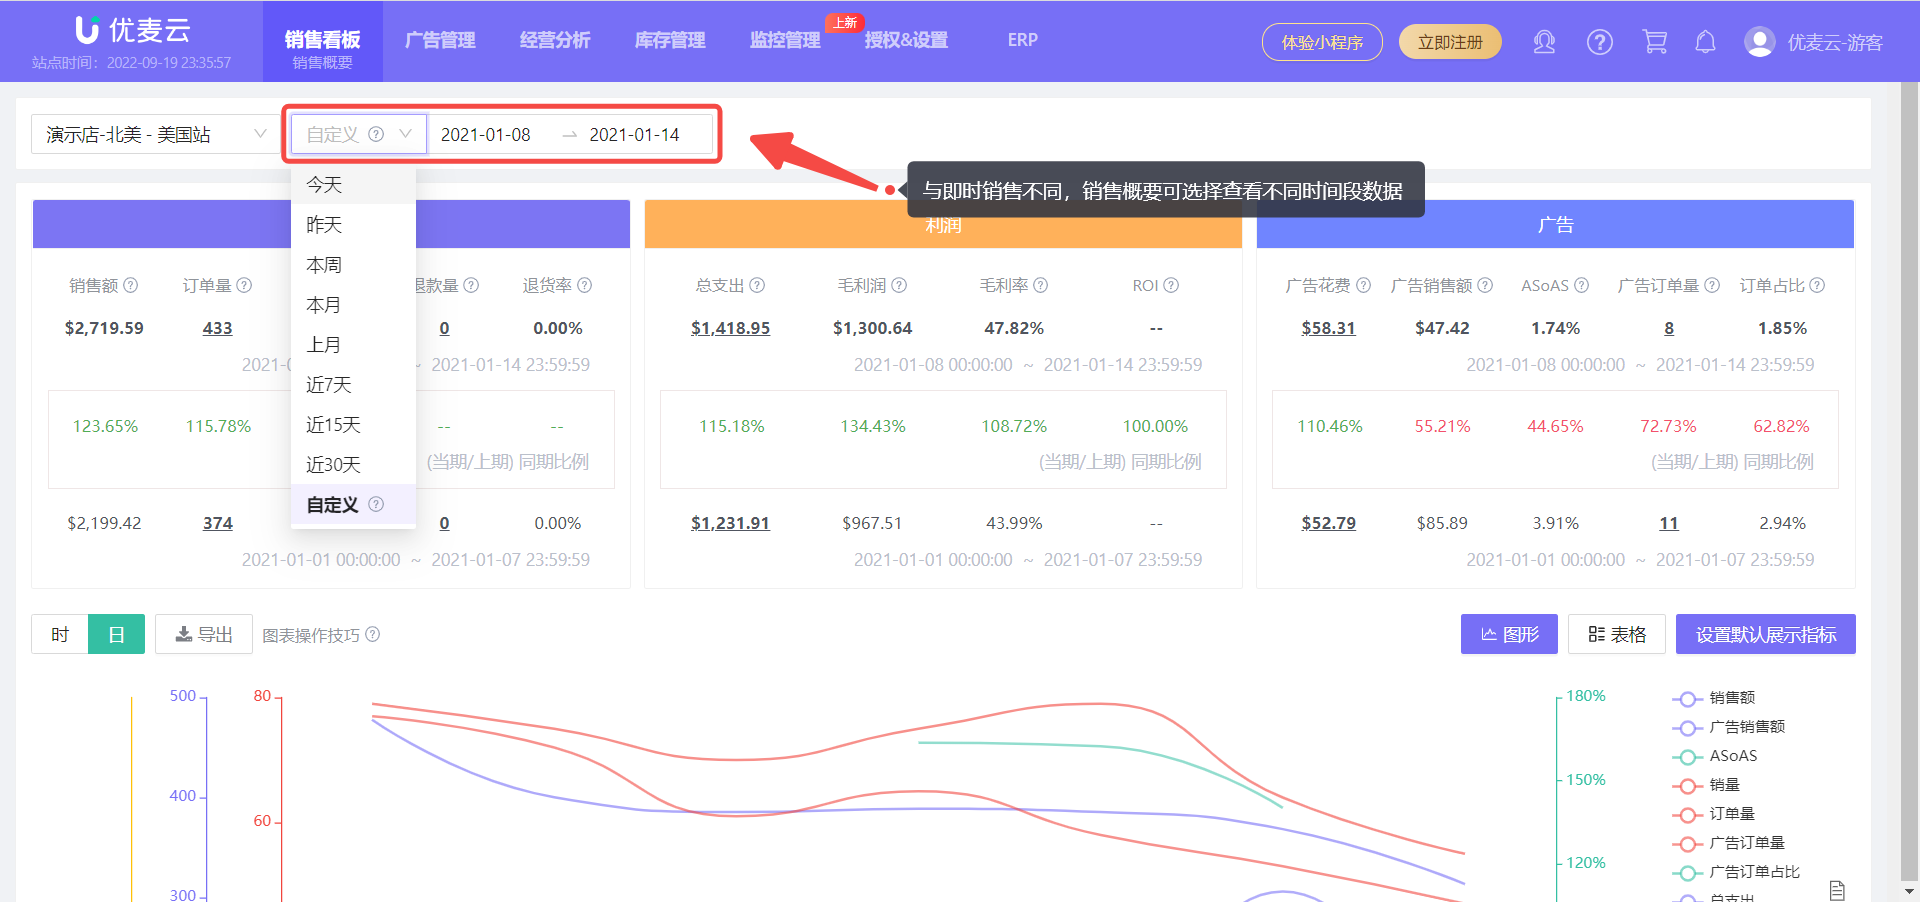
Sales Overview defaults to displaying sales overview data for the default marketplace and the last 7 days.
You can also set other time periods, with the time being the corresponding marketplace time. After setting, it will be applied to the Dashboard and Sales Chart sections. The Sales Products section has a separate setting for the data time period, which can be viewed and analyzed separately.
 +
+
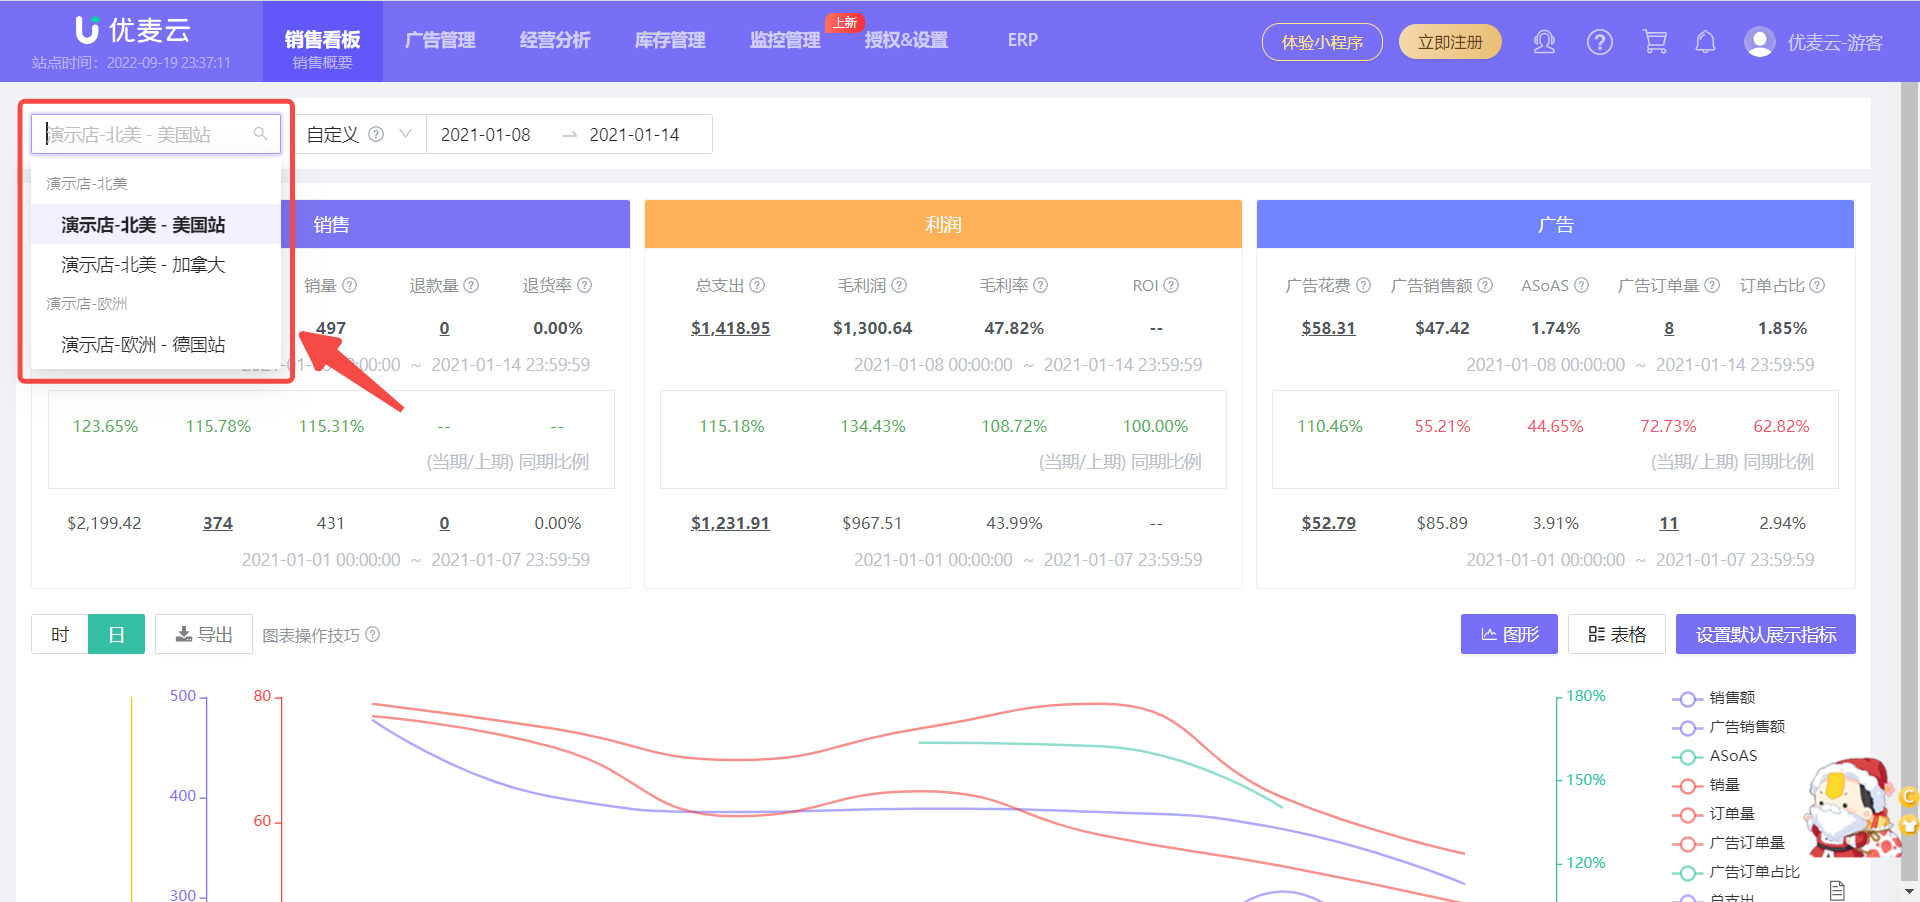
If you have authorized multiple stores, click the store name in the upper left corner of the page to switch stores for viewing.
 +
+
1. Dashboard Section
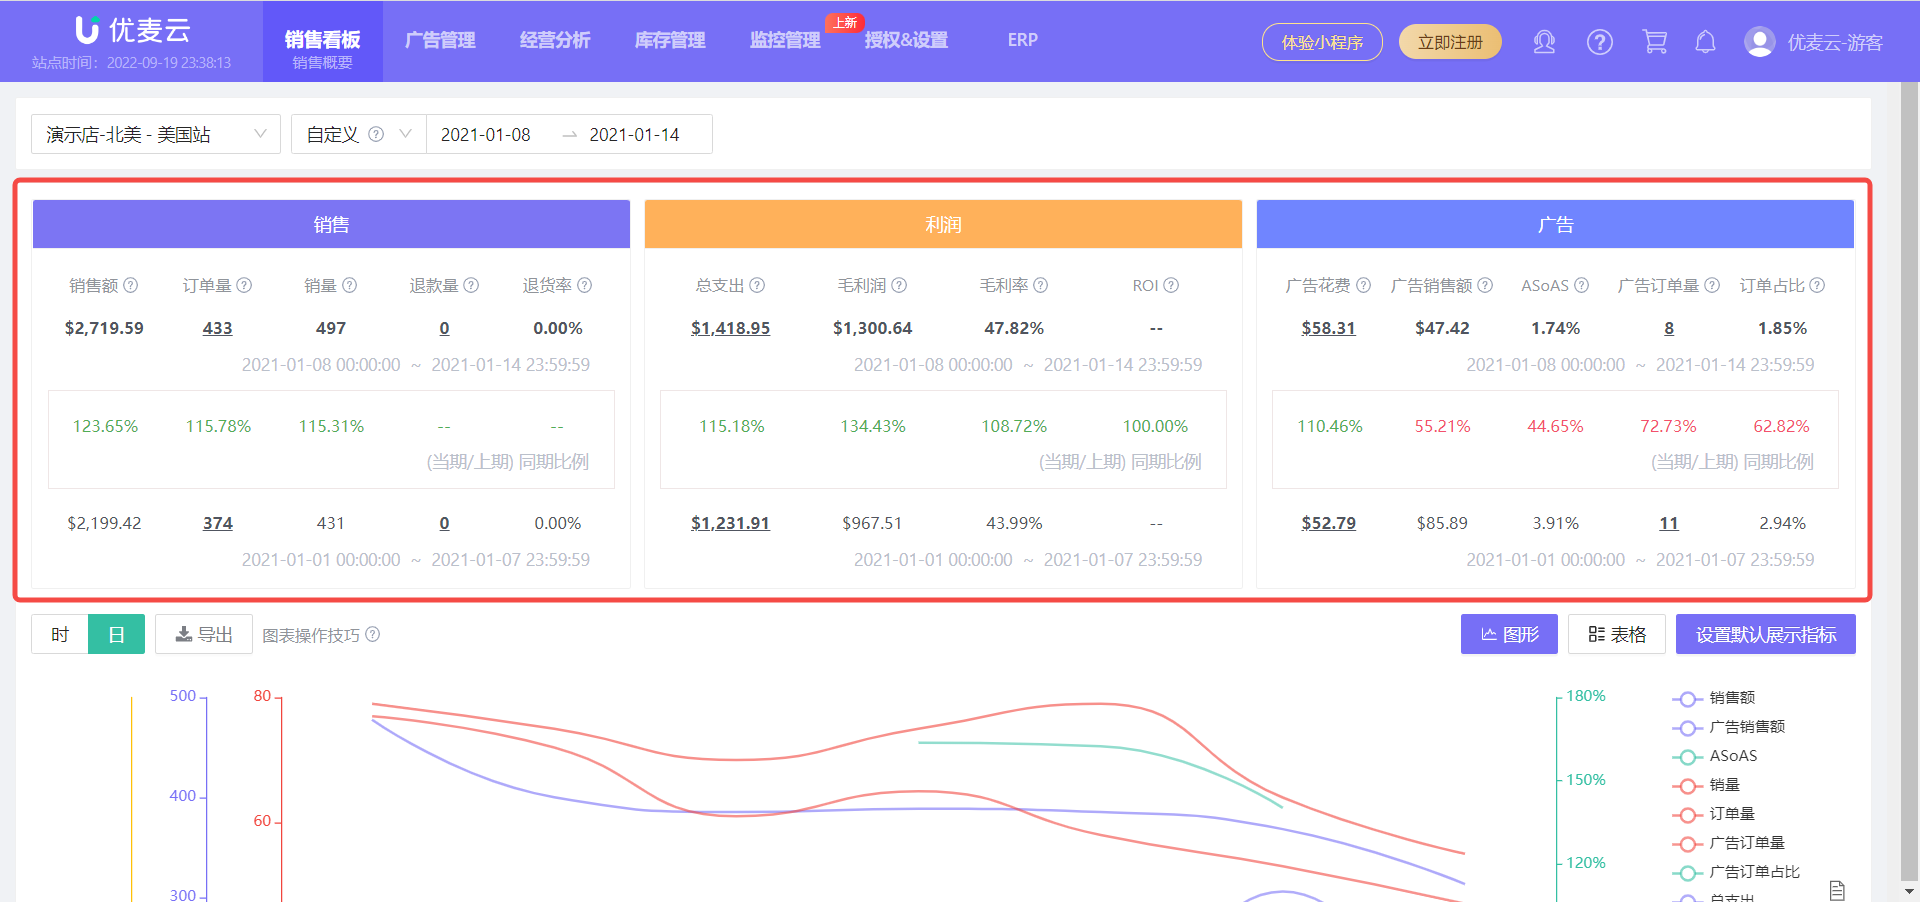
The Dashboard consists of three dashboards: Sales Dashboard, Profit Dashboard, and Advertising Dashboard, which display key metrics related to sales, profit, and advertising for the current store and time period.
Through the Dashboard, we can quickly grasp the core sales situation of the current store in the current time period.
 +
+
For example, when we only want to quickly analyze the recent sales situation of the store, we can directly analyze it through the Sales Dashboard.
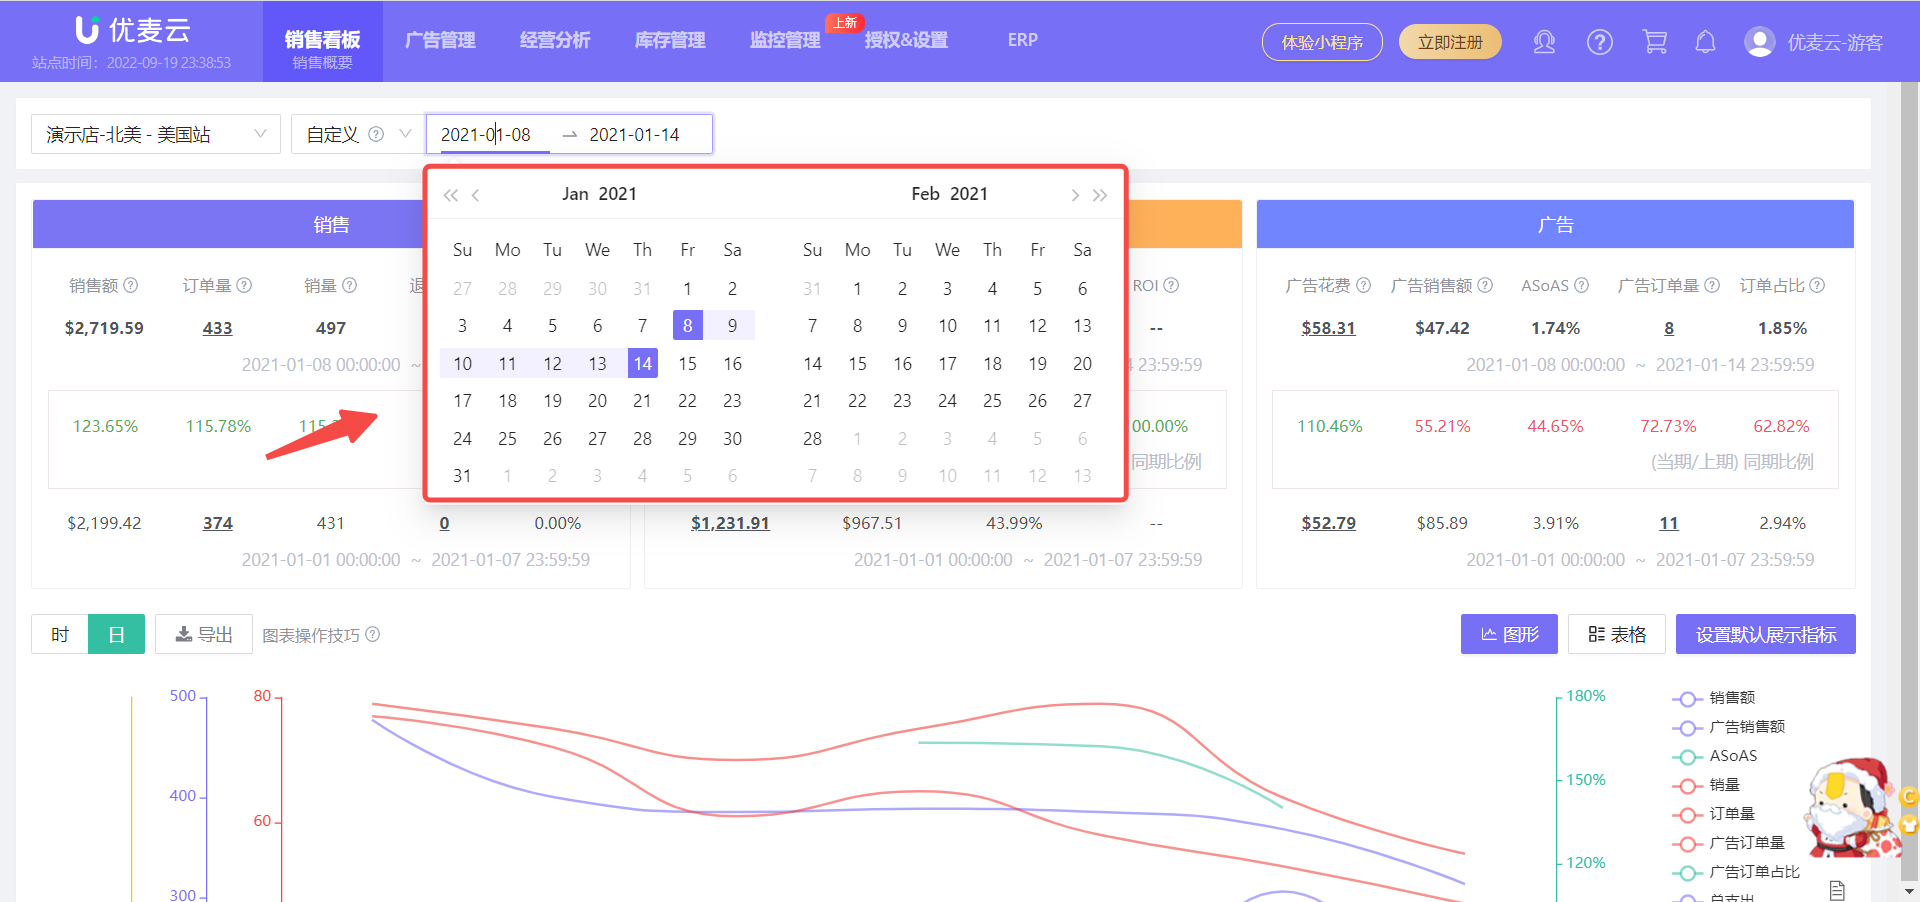
Select the sales time period to be analyzed to view it directly.
 +
+
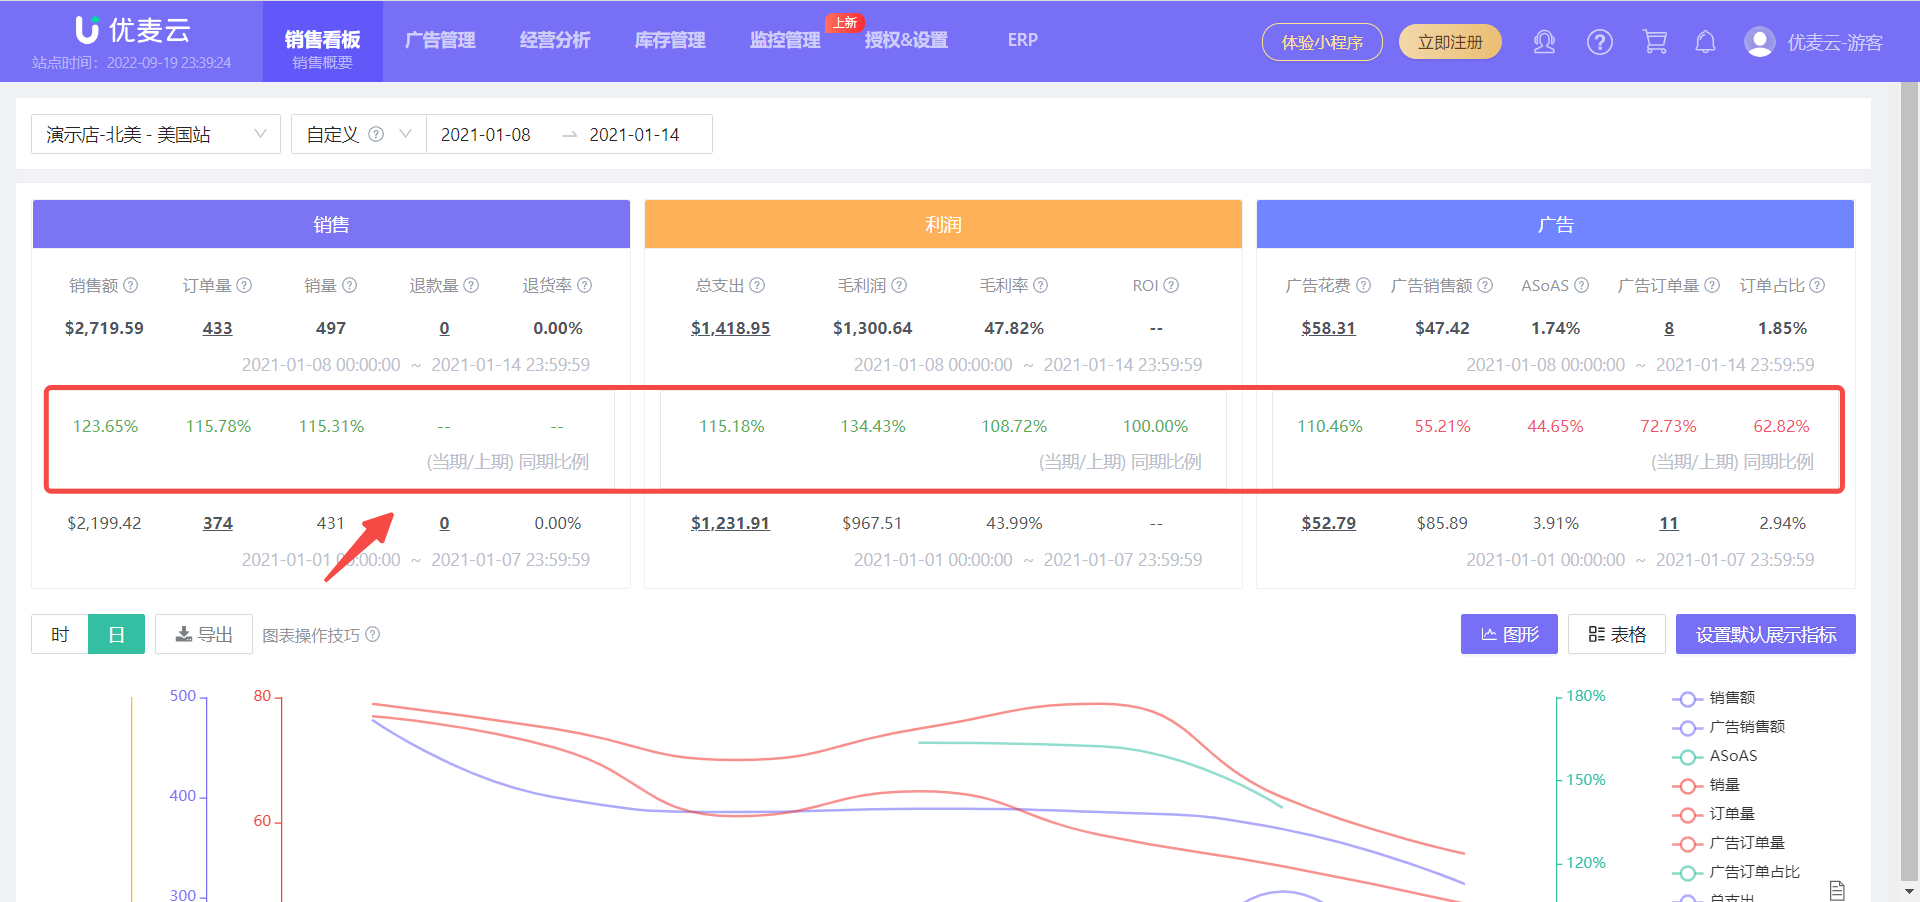
In addition to viewing the data for the current time period, it also supports comparative analysis of data from the previous period.
For example:
If you select "This Week" as the time period, it will be compared with the data from the same period last week. If you select "This Month" as the time period, it will be compared with the data from the same period last month.
If the same-period ratio result is displayed in red, it means that the current sales performance is lower than the previous period, that is, sales have decreased. Green is the opposite, indicating that the current sales performance is higher than the previous period, that is, performance has improved. Through same-period comparison, we can quickly grasp the sales changes of the store.
 +
+
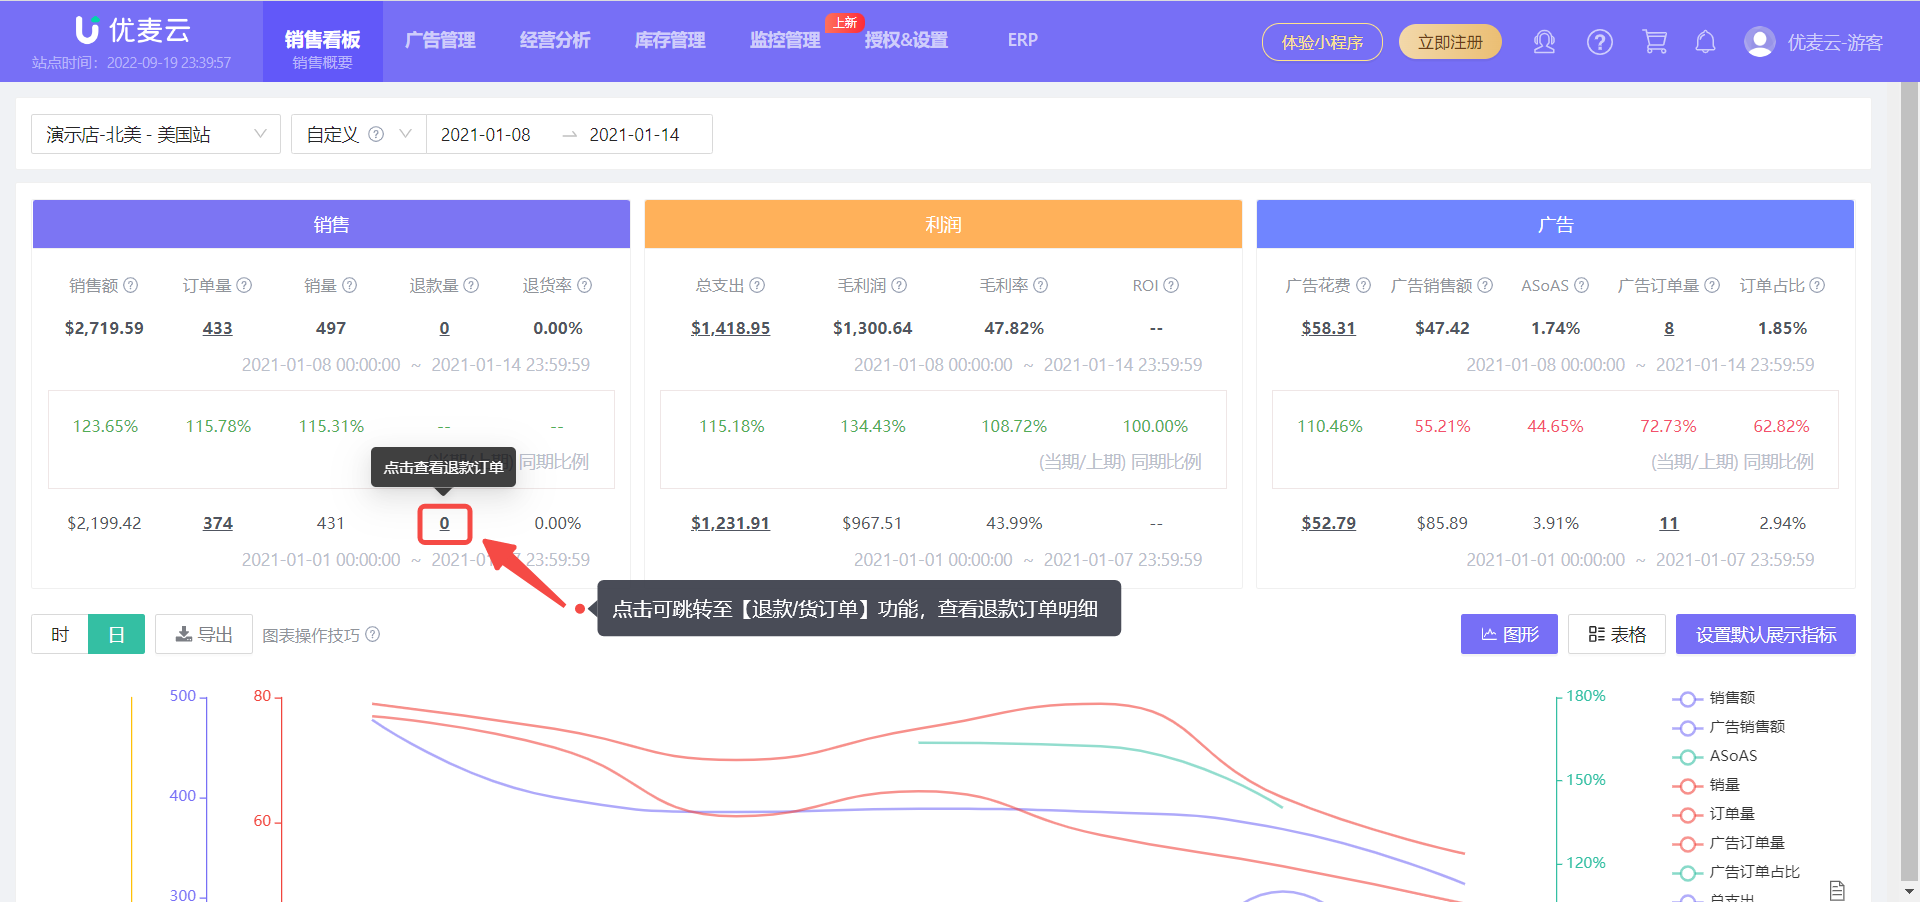
Click or hover the mouse over the underlined value to view the corresponding details and further analyze the store's sales situation.
For example:
Click the number of returns to jump to the return list for the current time period and further analyze the return situation;
 +
+
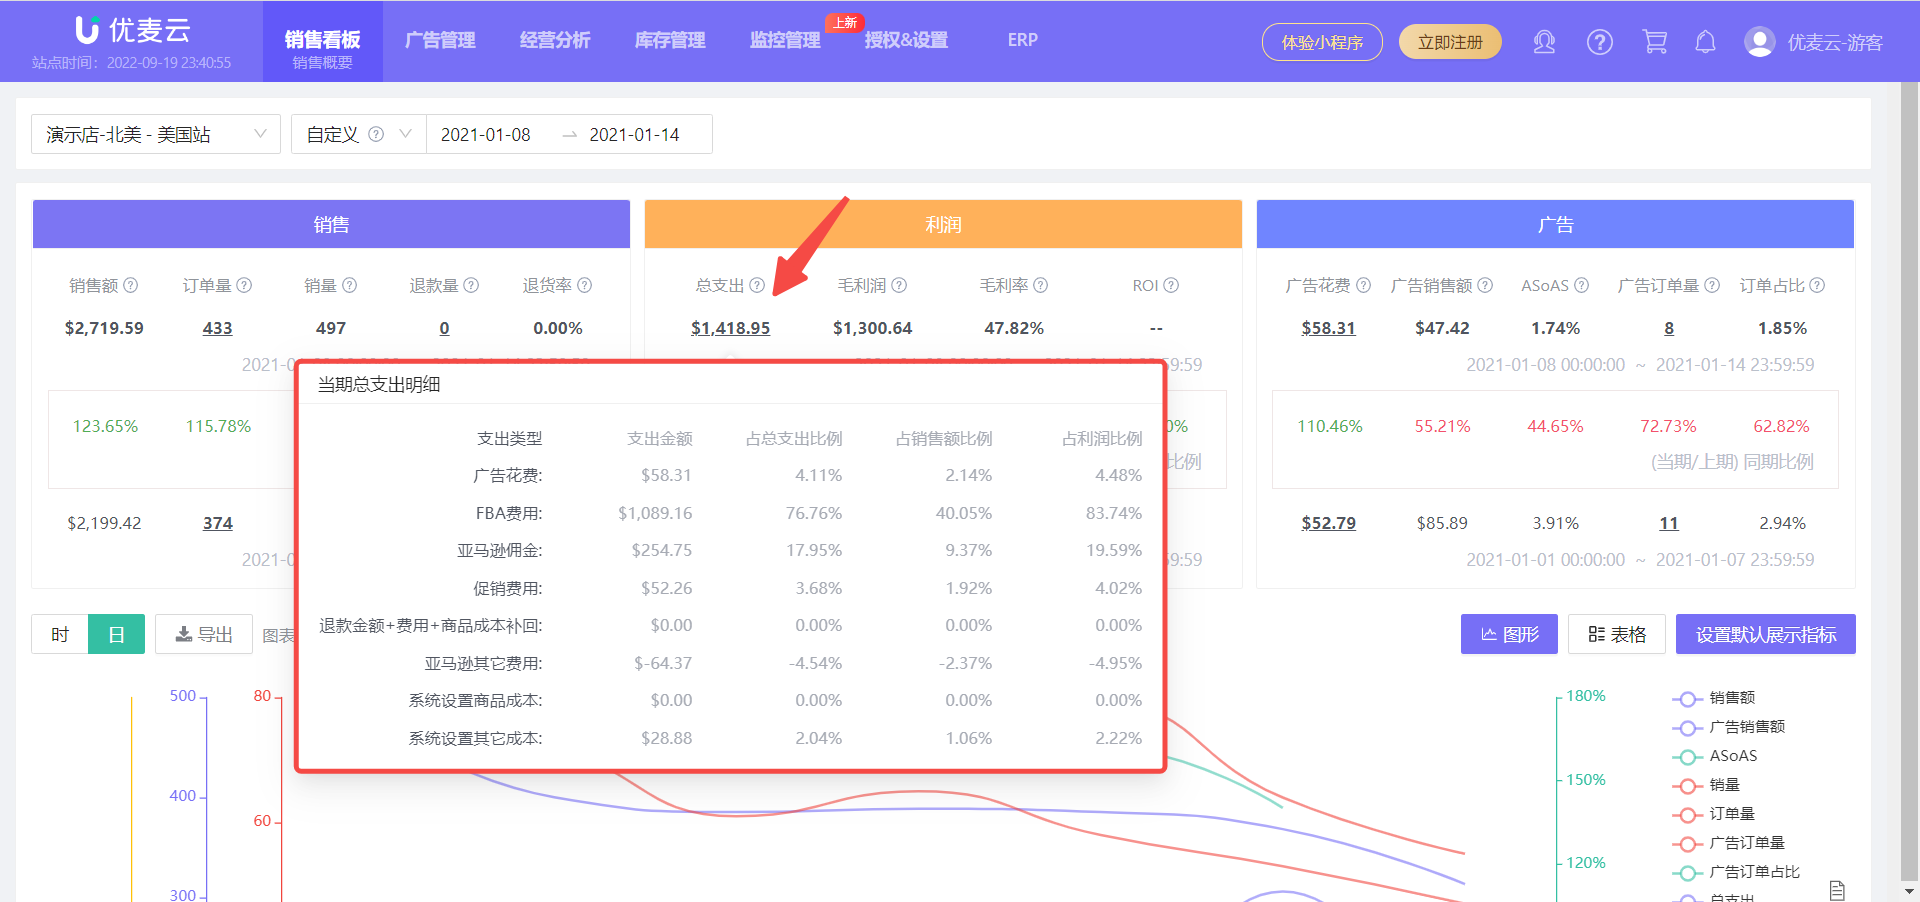
Hover the mouse over the total expenditure amount to see the details of total expenditure and the corresponding expenditure ratio. By analyzing the expenditure ratio, you can find points to improve profit.
 +
+
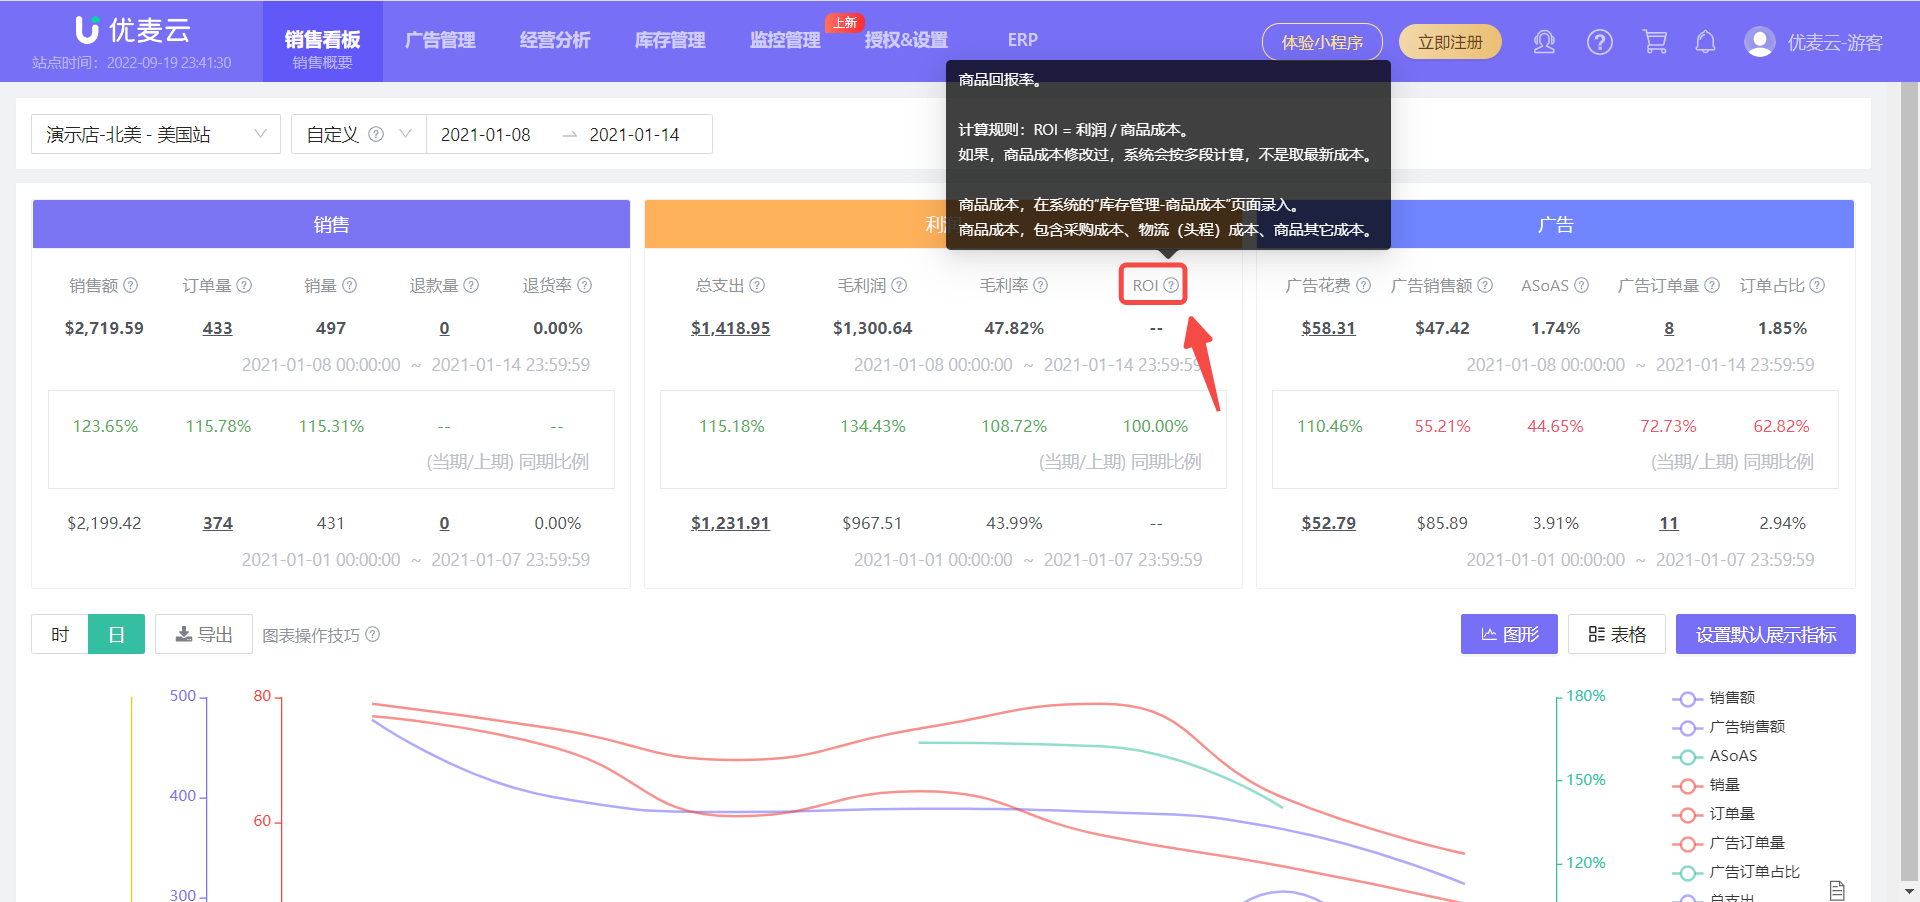
If you don't understand a certain metric, hover the mouse over the small question mark next to the title to view a detailed explanation and deeply understand the meaning of the metric.
 +
+
2. Sales Chart
The Sales Chart displays the trend data of advertising and store sales for the current store and time period, including a total of 14 metrics such as: Sales Amount, Sales Quantity, Order Quantity, Advertising Sales Amount, etc.
Through the Sales Chart, we can quickly analyze the trend of changes in store advertising and sales within a certain time period.
Combined with the Dashboard data, we can quickly identify loopholes in store sales and make timely optimizations.
 +
+
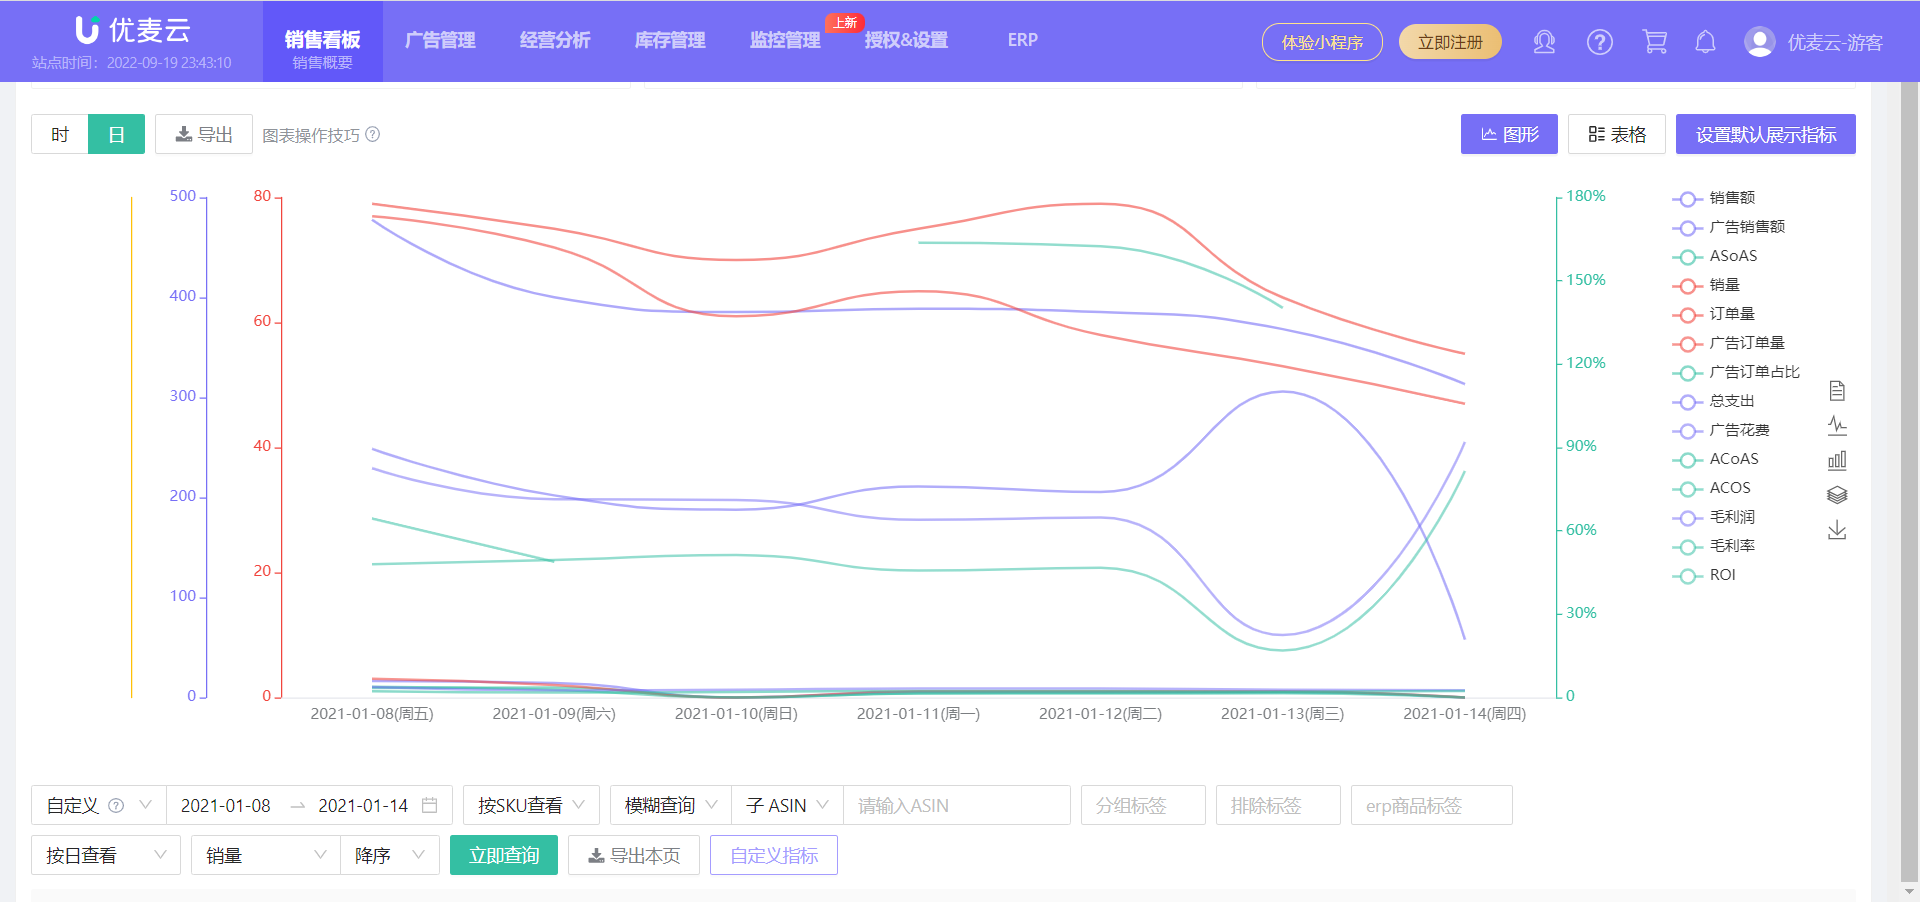
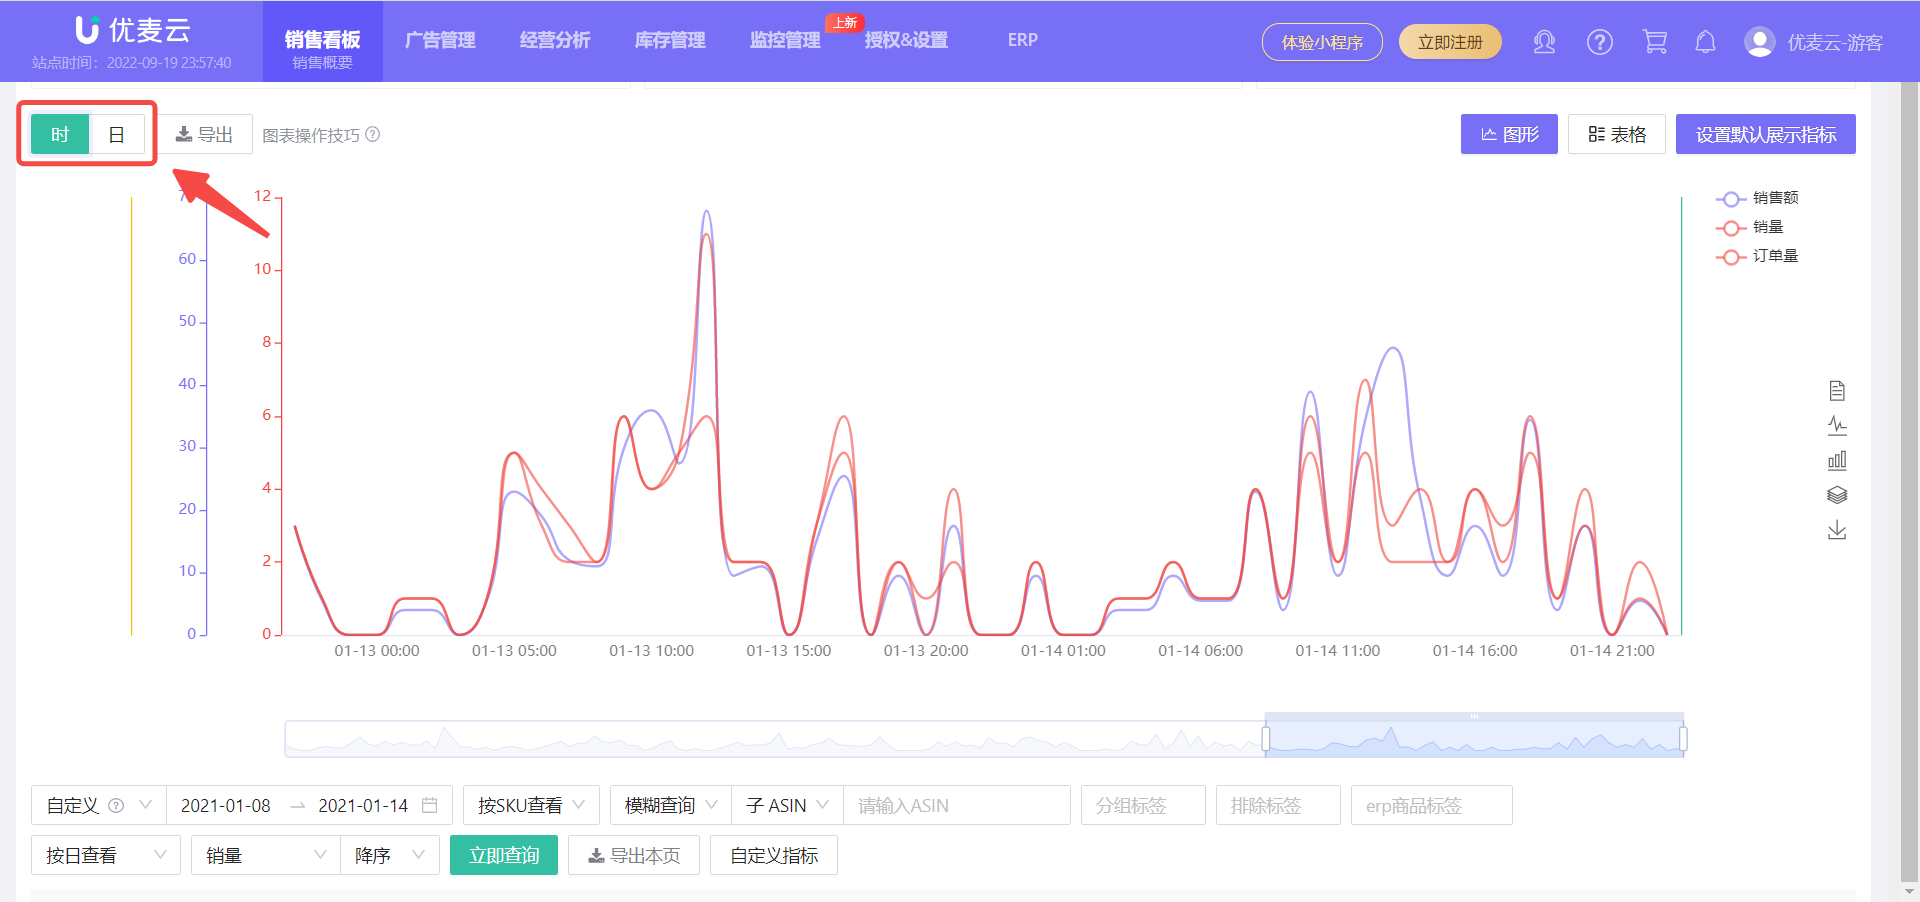
First, select the time period to be analyzed. After selection, the data will be automatically displayed, and it will be displayed in chart form by default;
 +
+
We can see that:
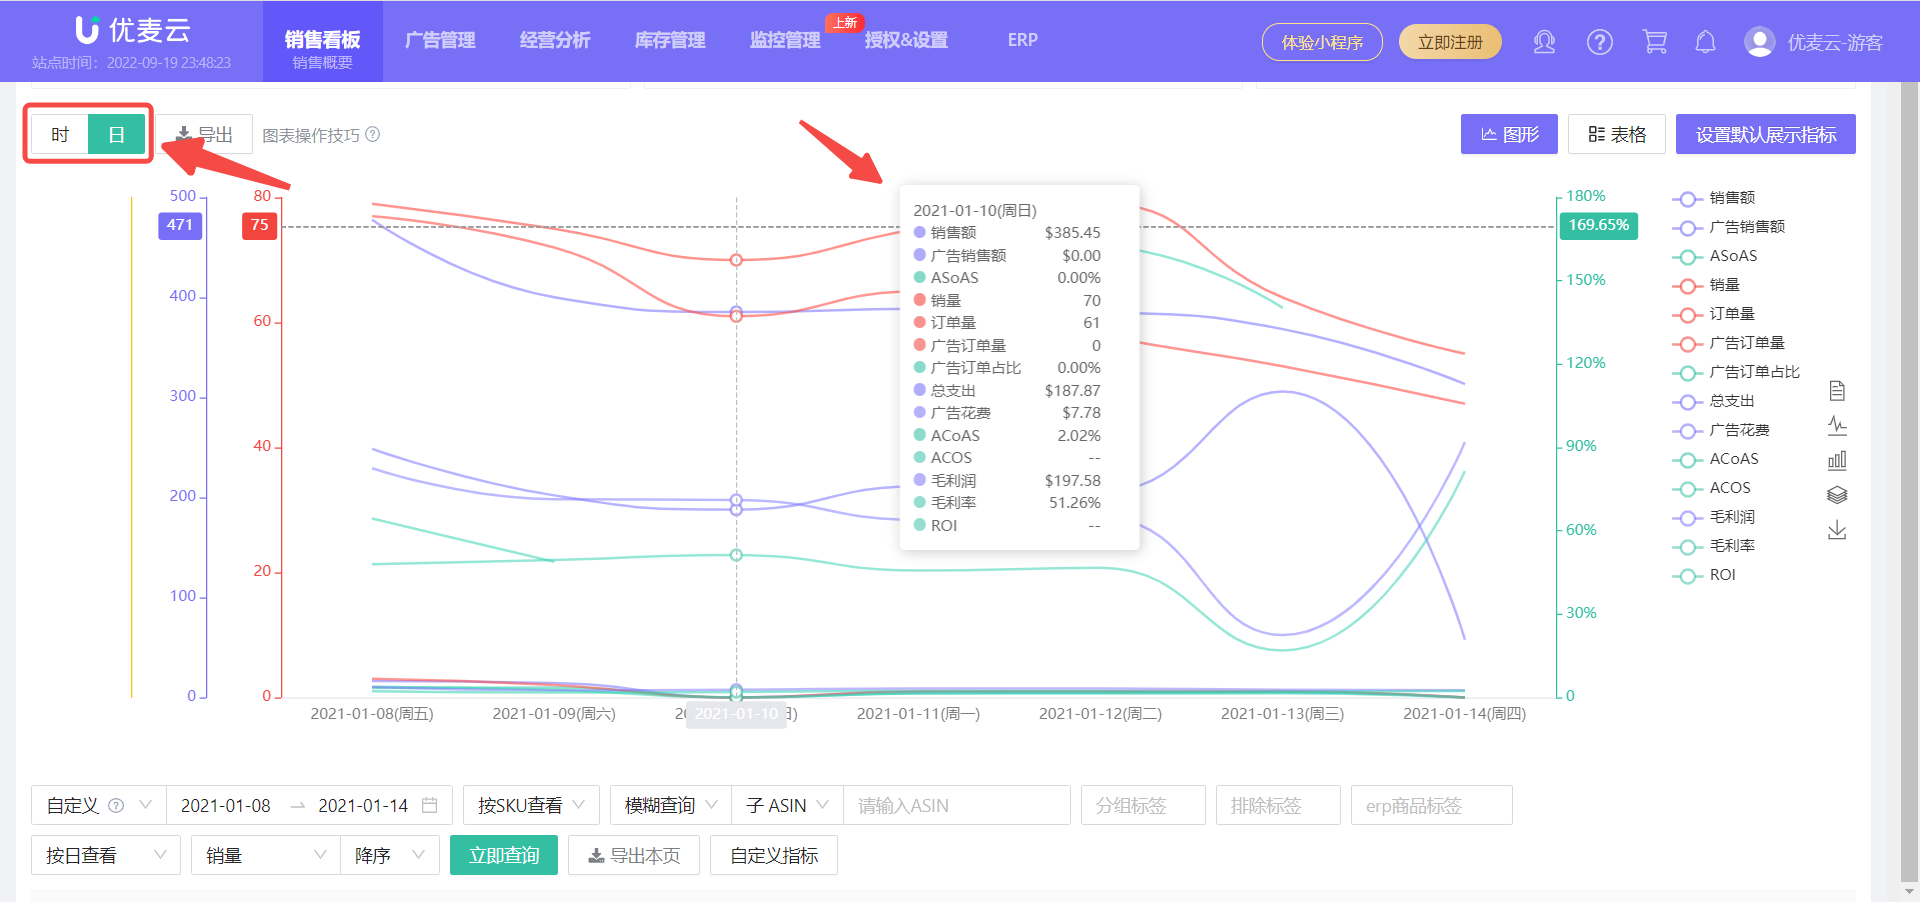
Trend data is displayed in Day dimension by default, and you can intuitively see the sales trend in the current time period. Hover over the fluctuation node to view the corresponding sales details and analyze the sales change trend.
 +
+
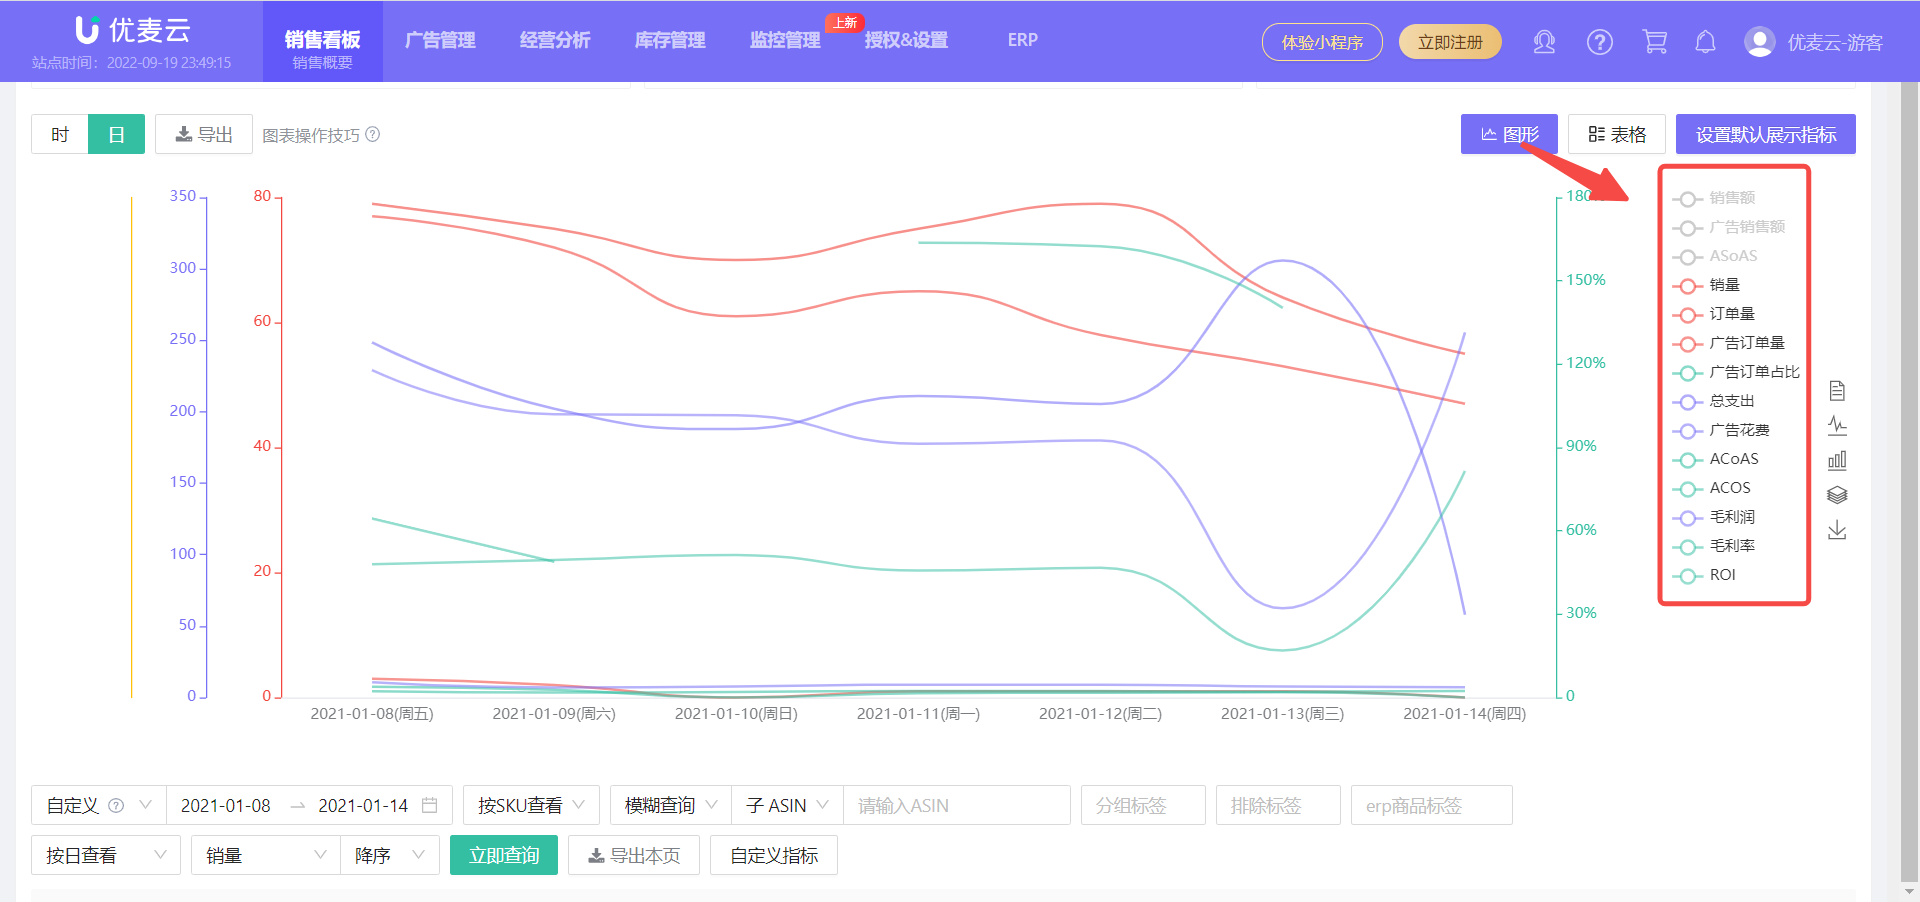
Click the metric name on the right side of the chart, or click in the blank space, you can choose to hide or display certain metric data to analyze separately or compare and analyze certain metrics;
 +
+
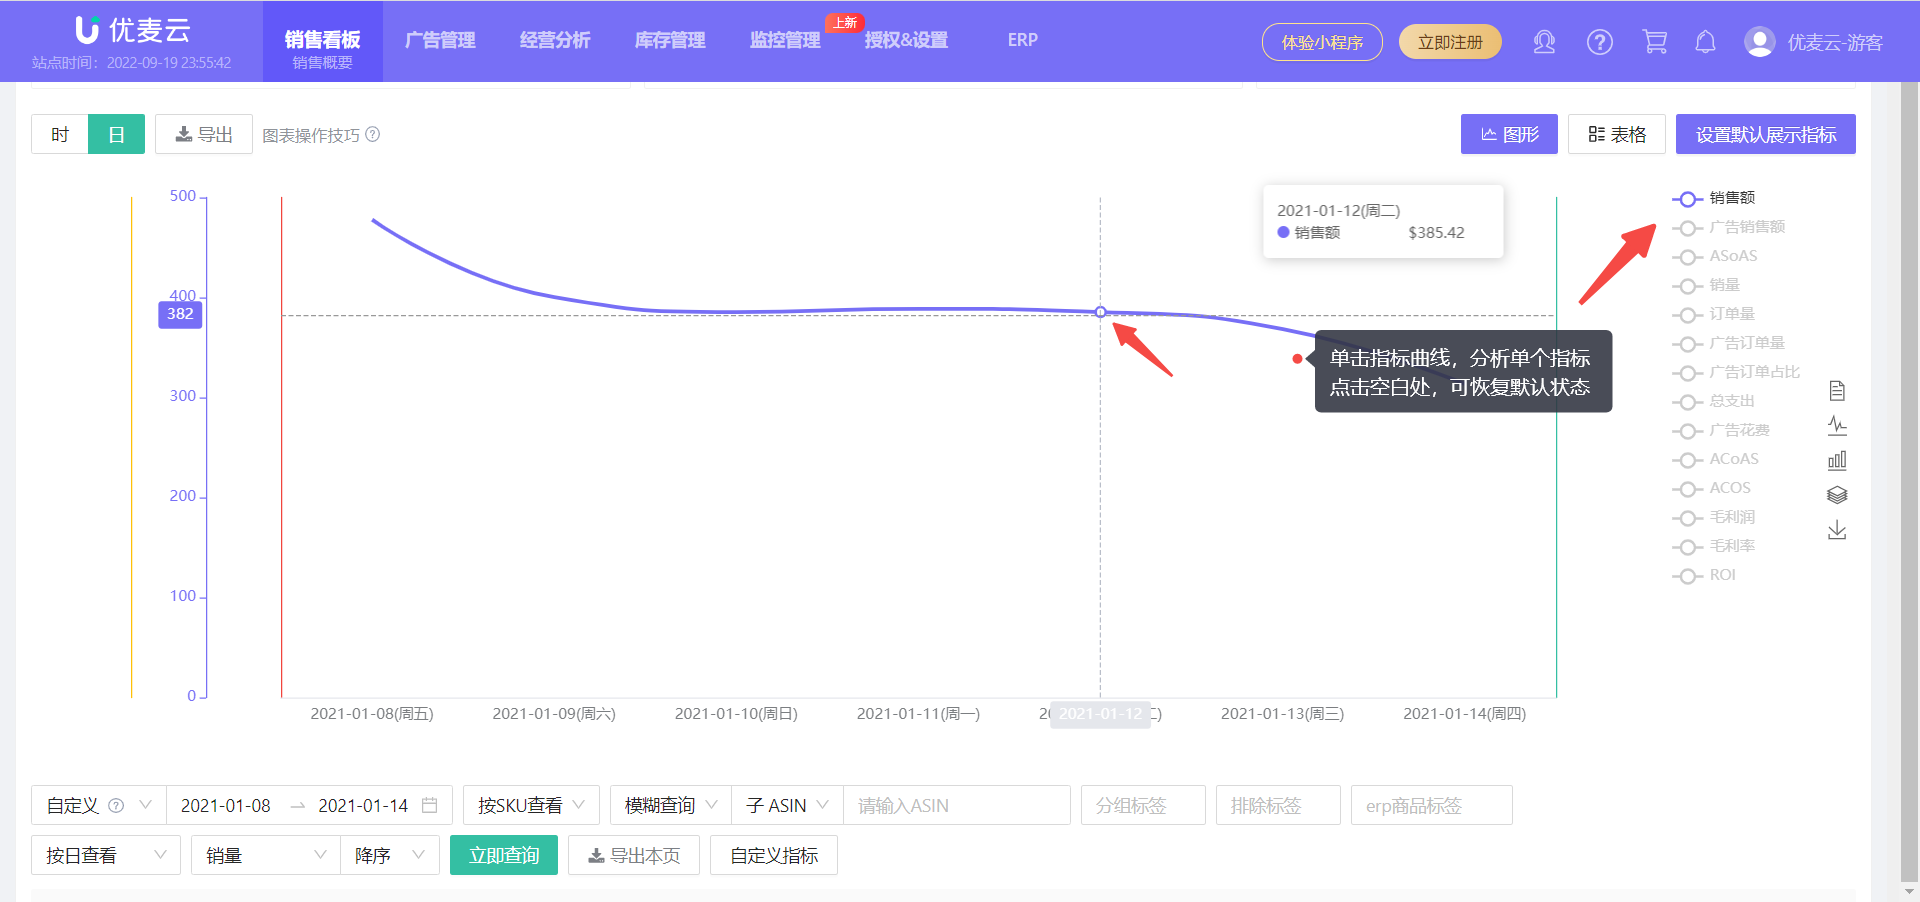
Or click a single curve to only display the data of a certain metric, analyze a single metric, and click in the blank space to restore;
 +
+
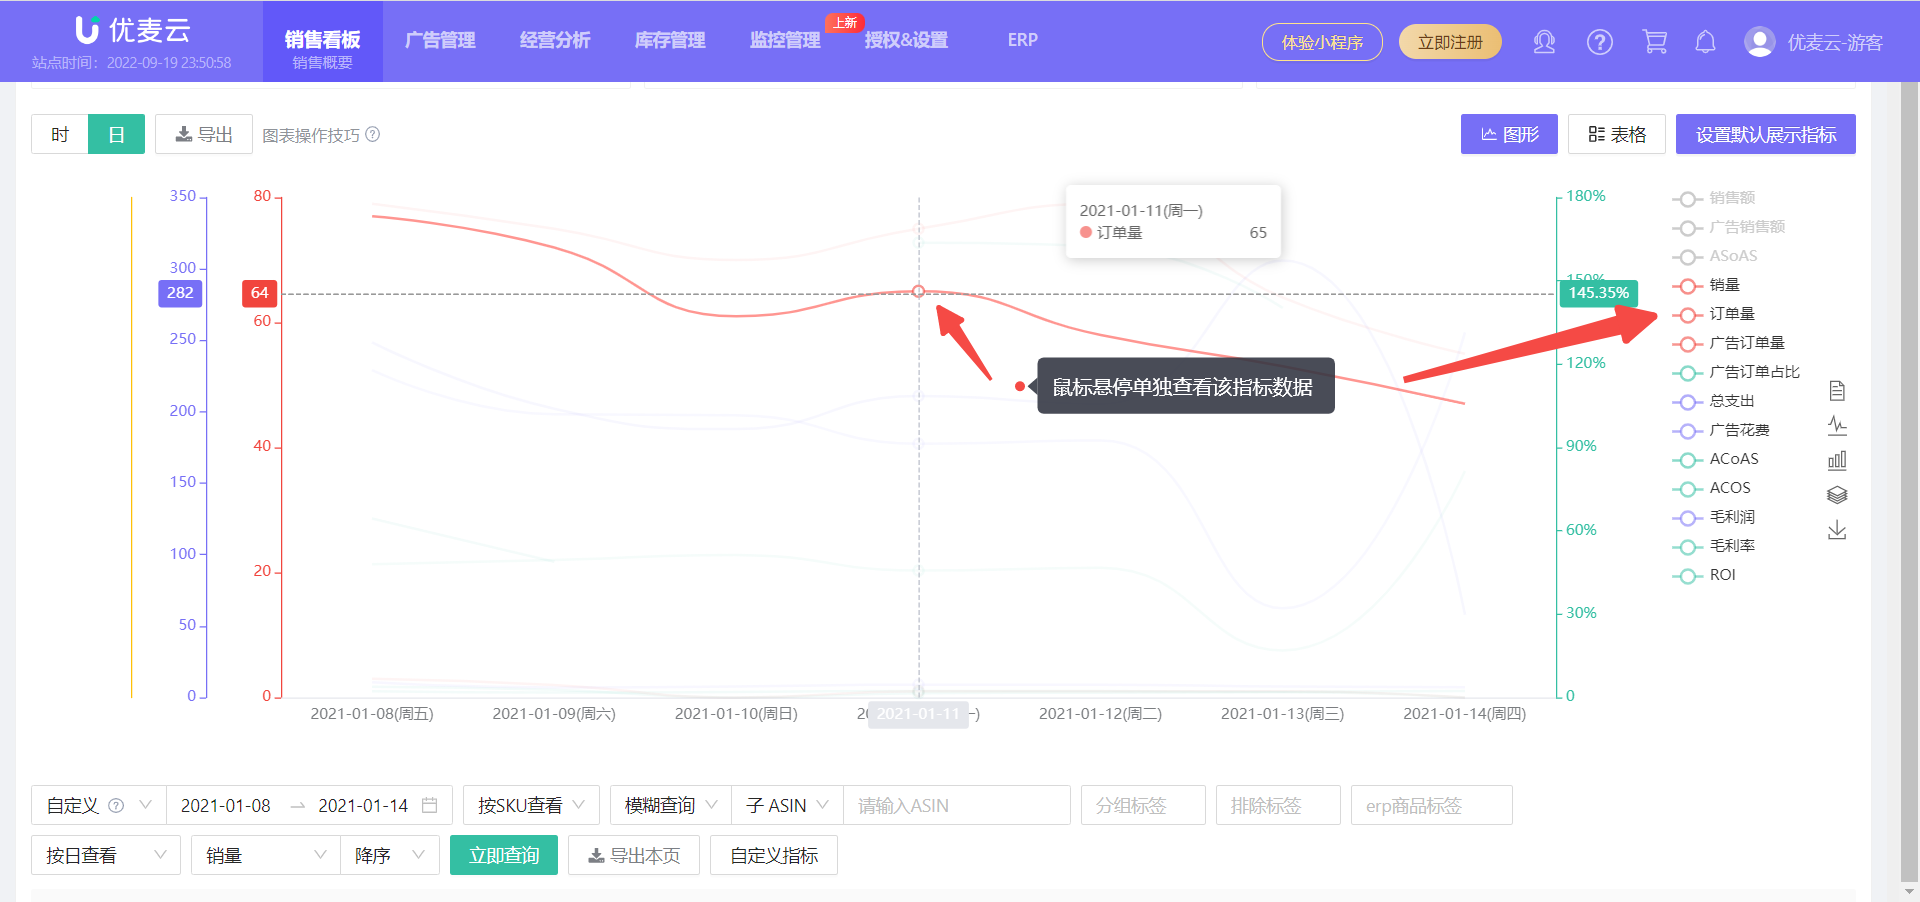
Hover the mouse over the metric name on the right or the corresponding curve to also view the data of that metric separately. Move the mouse away to restore;
 +
+
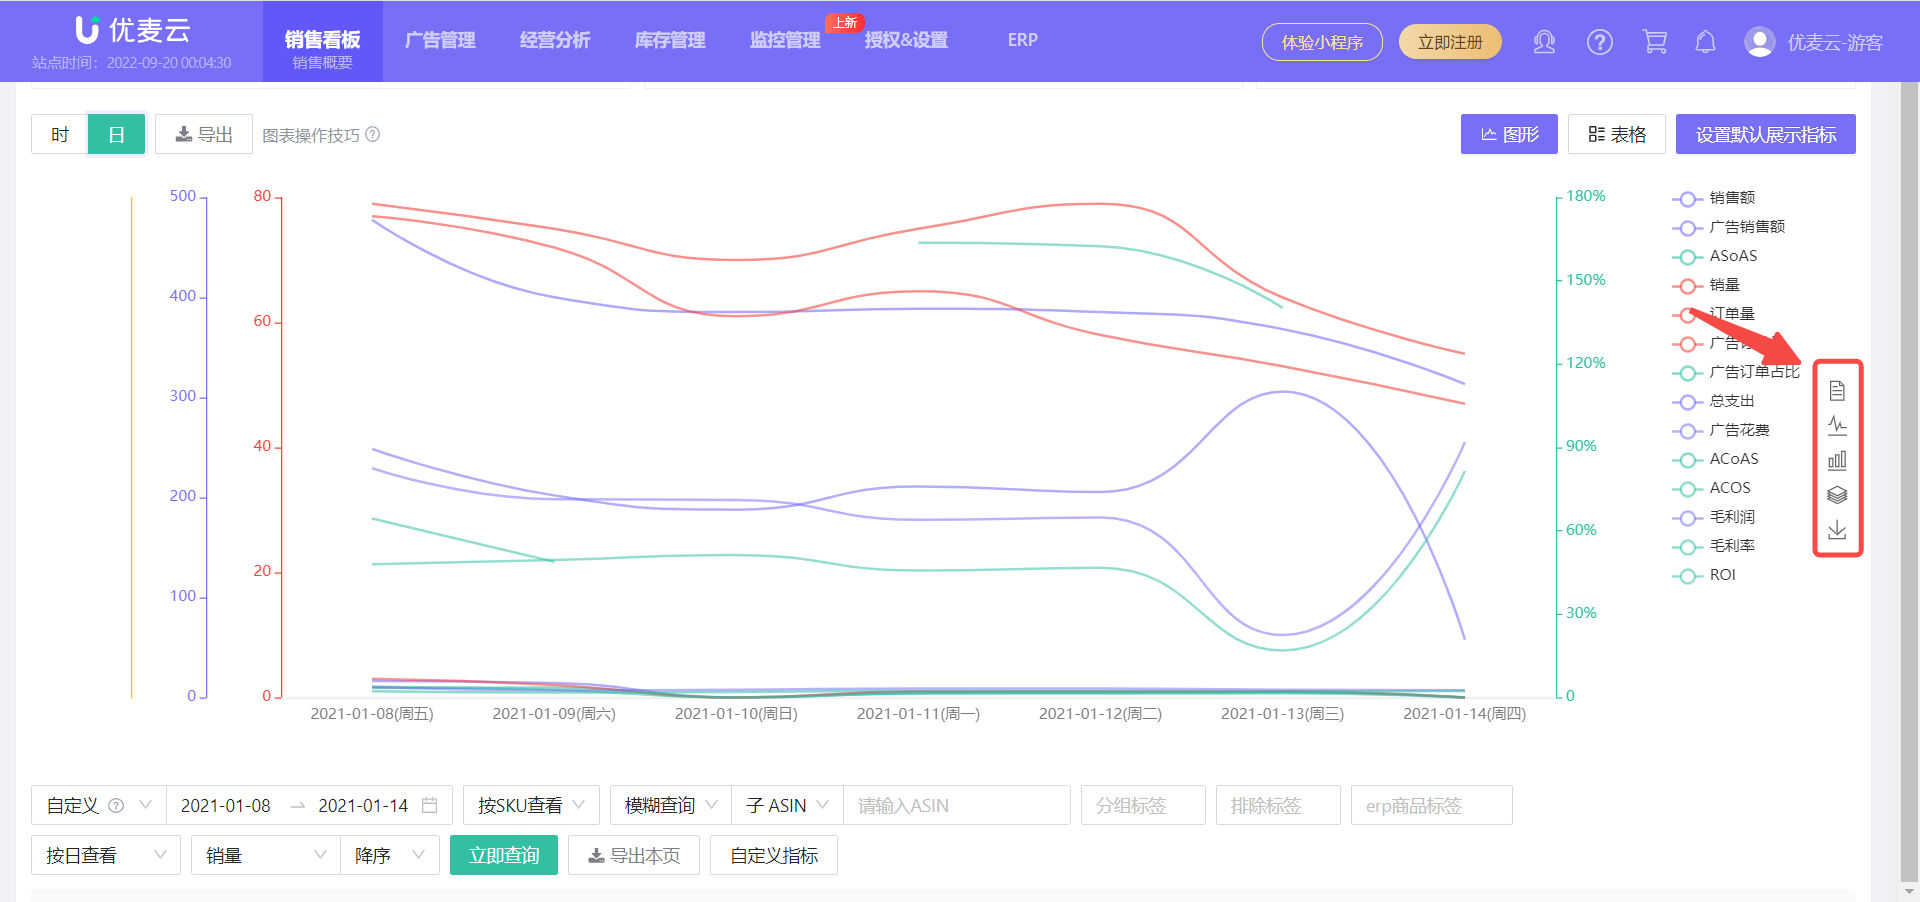
Click the icon on the right to switch the chart mode and analyze sales data from multiple perspectives (consistent with the chart data analysis operation of the Instant Sales function).
 +
+
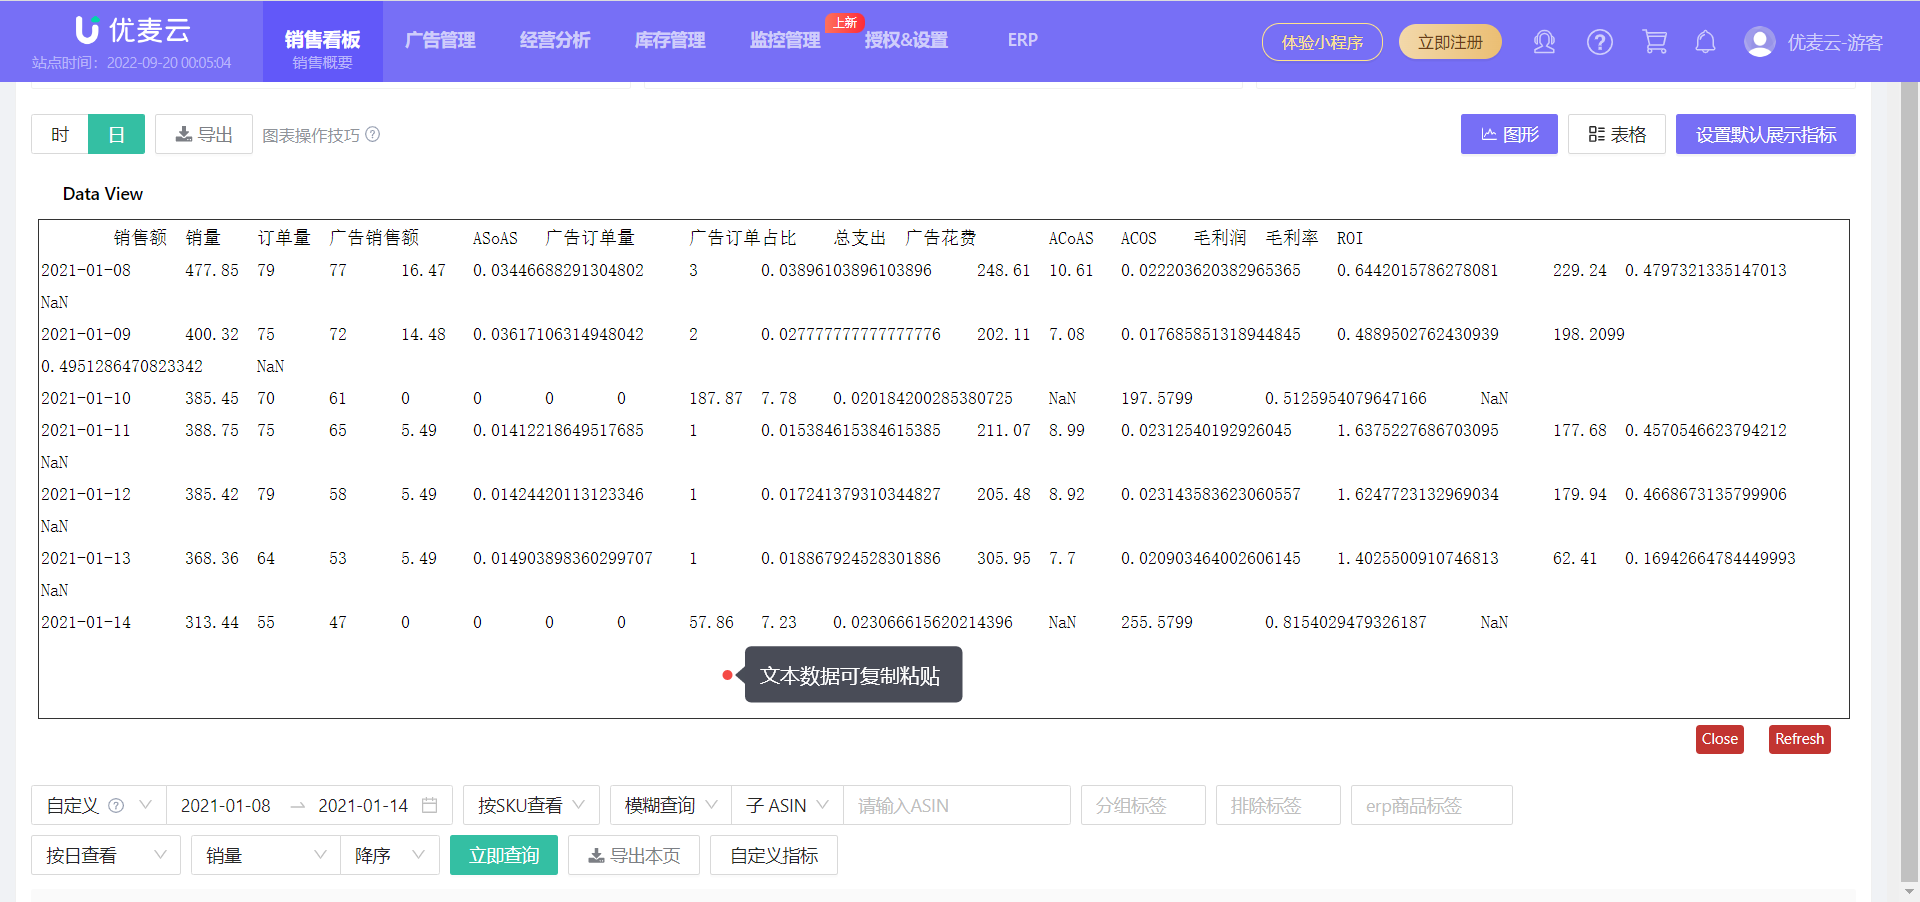
Text: Text data (data returned to the system by Amazon) can be directly copied and pasted into a spreadsheet for secondary analysis.
 +
+
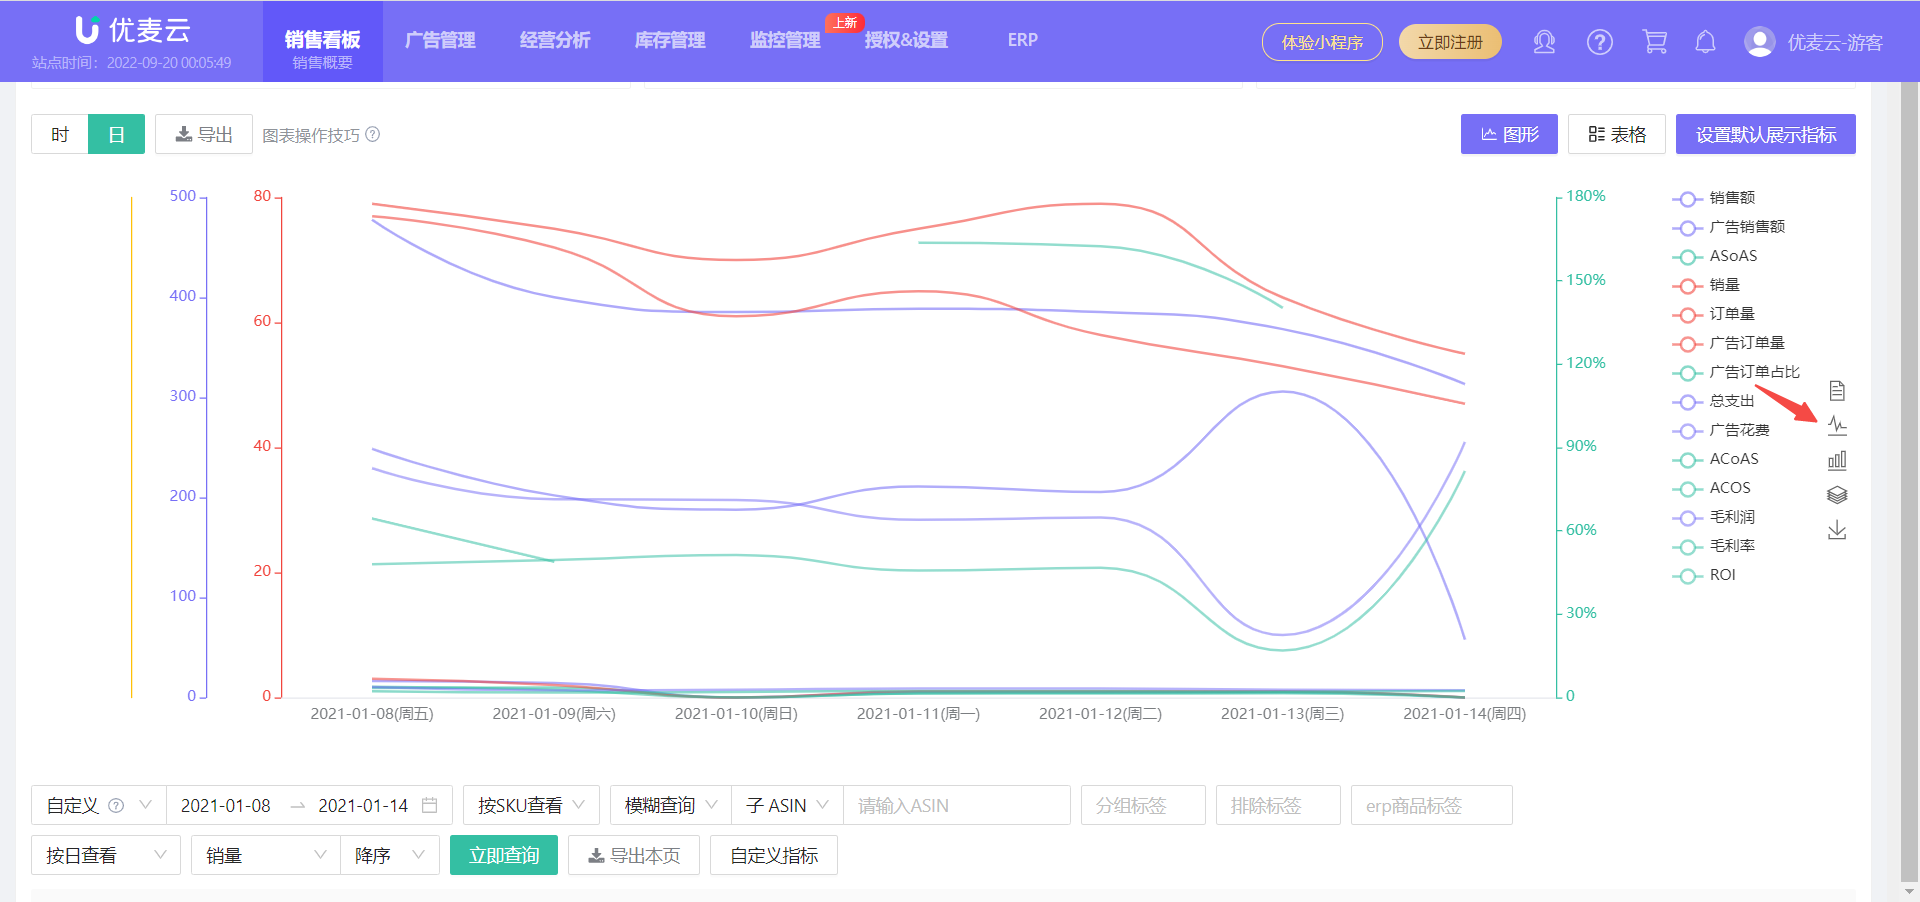
Line Chart: Shows the trend of each metric over time.
 +
+
Basic Bar Chart: Compares the size of each metric.
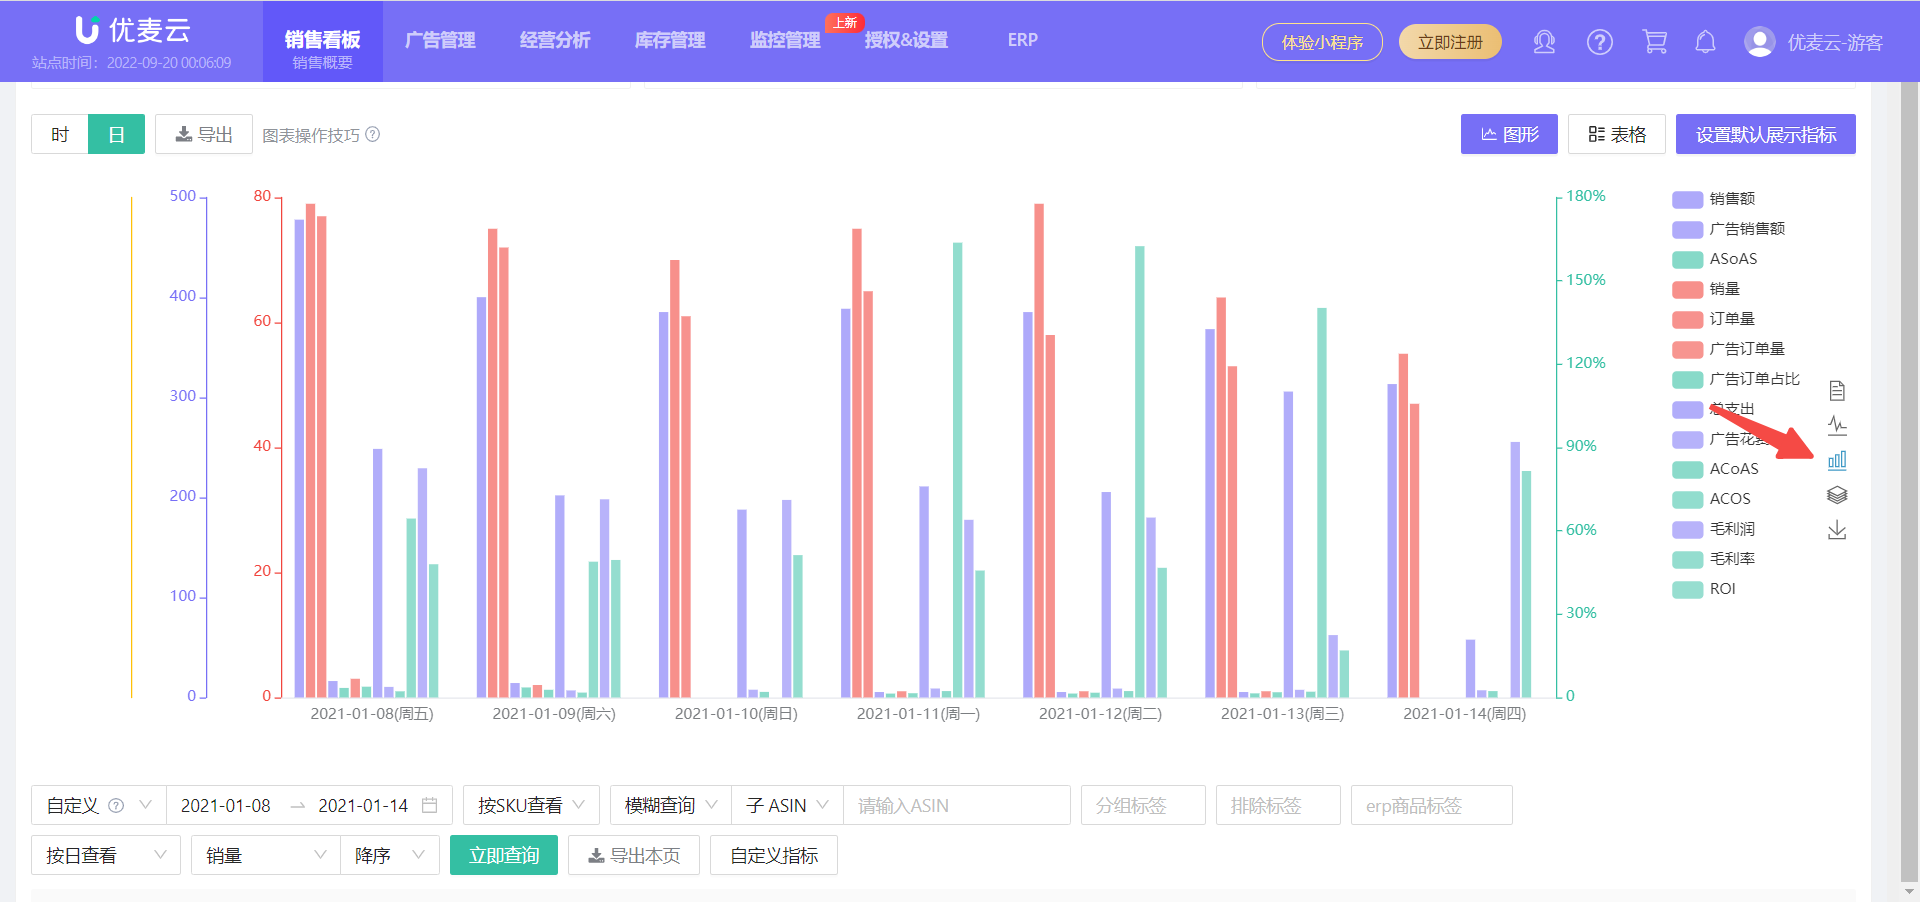 +
+
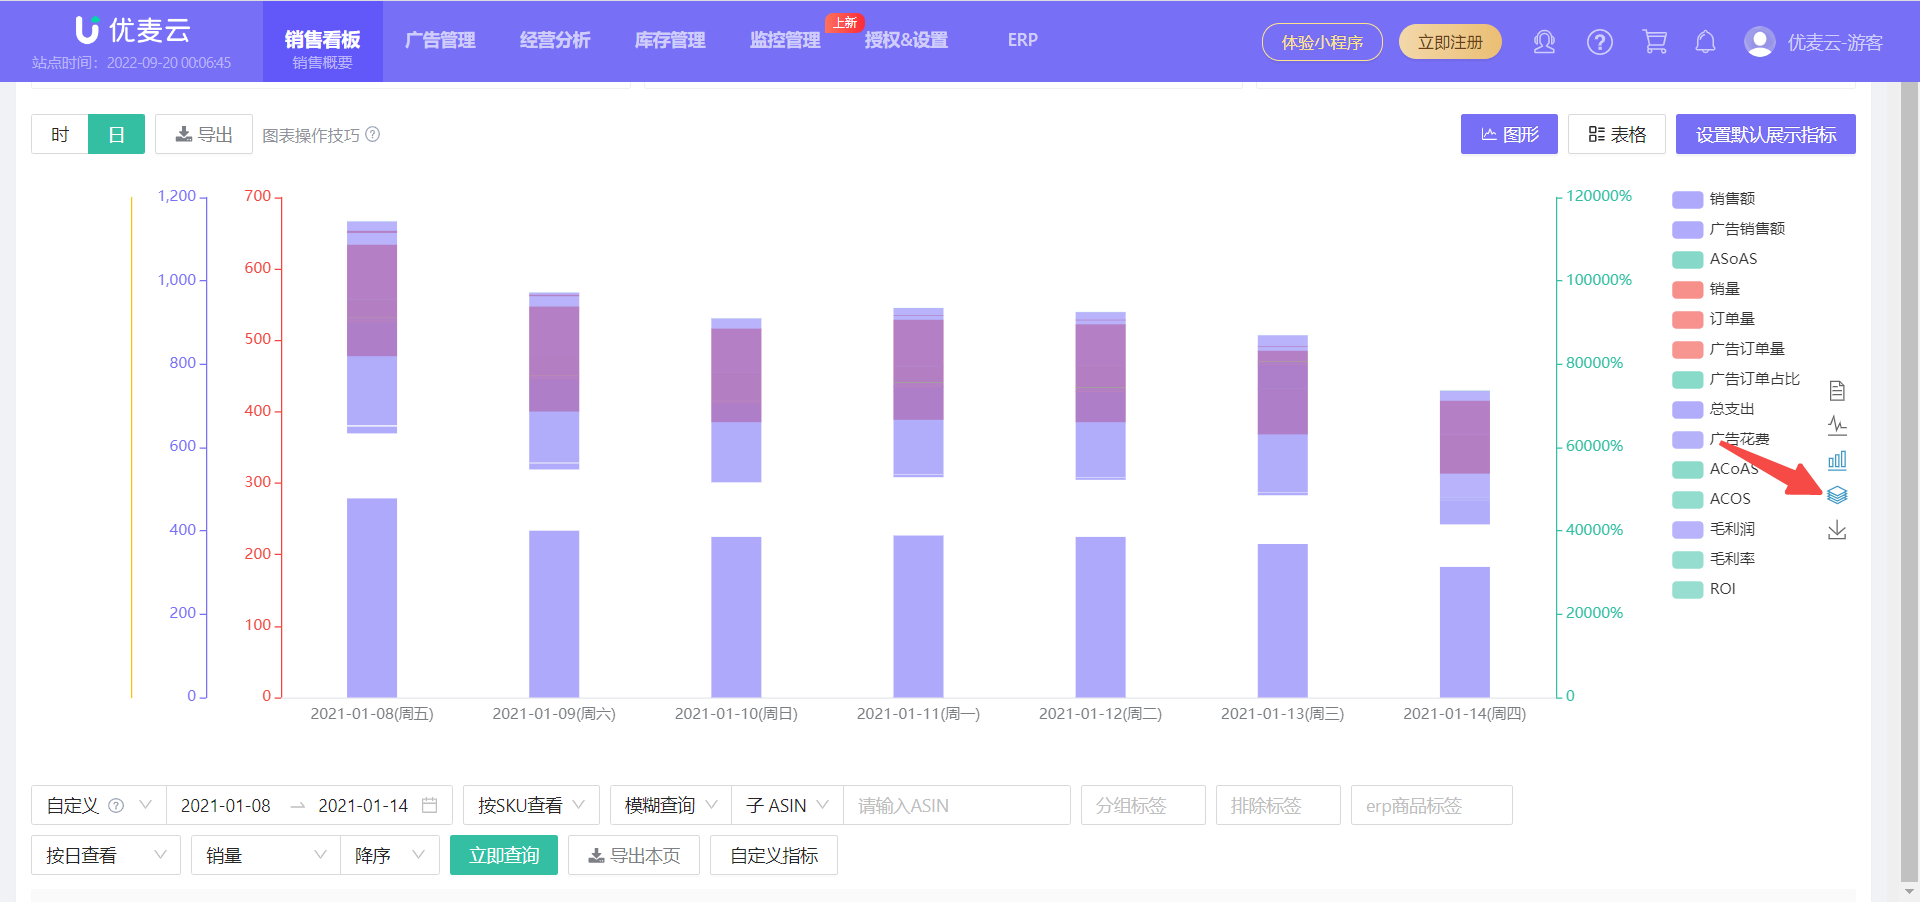
Stacked Bar Chart: Compares the composition and size of metrics in the same category.
 +
+
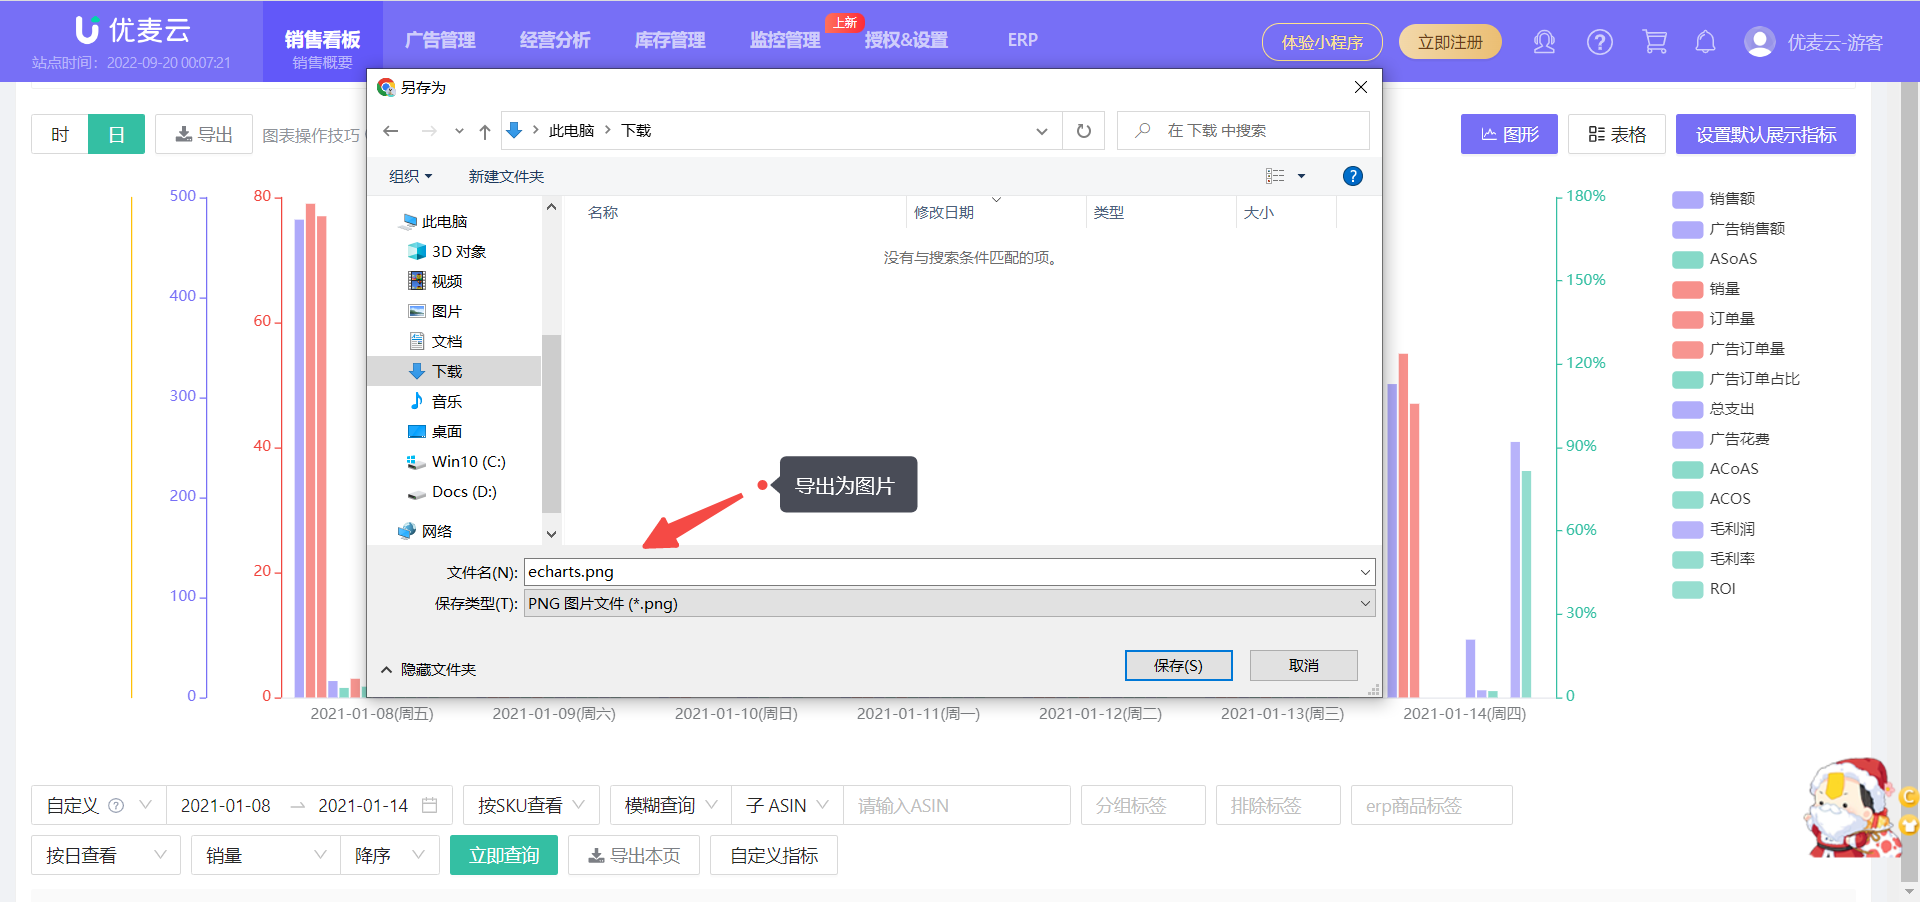
Download & Export: The above three chart types can be downloaded as images and saved to your local computer.
 +
+
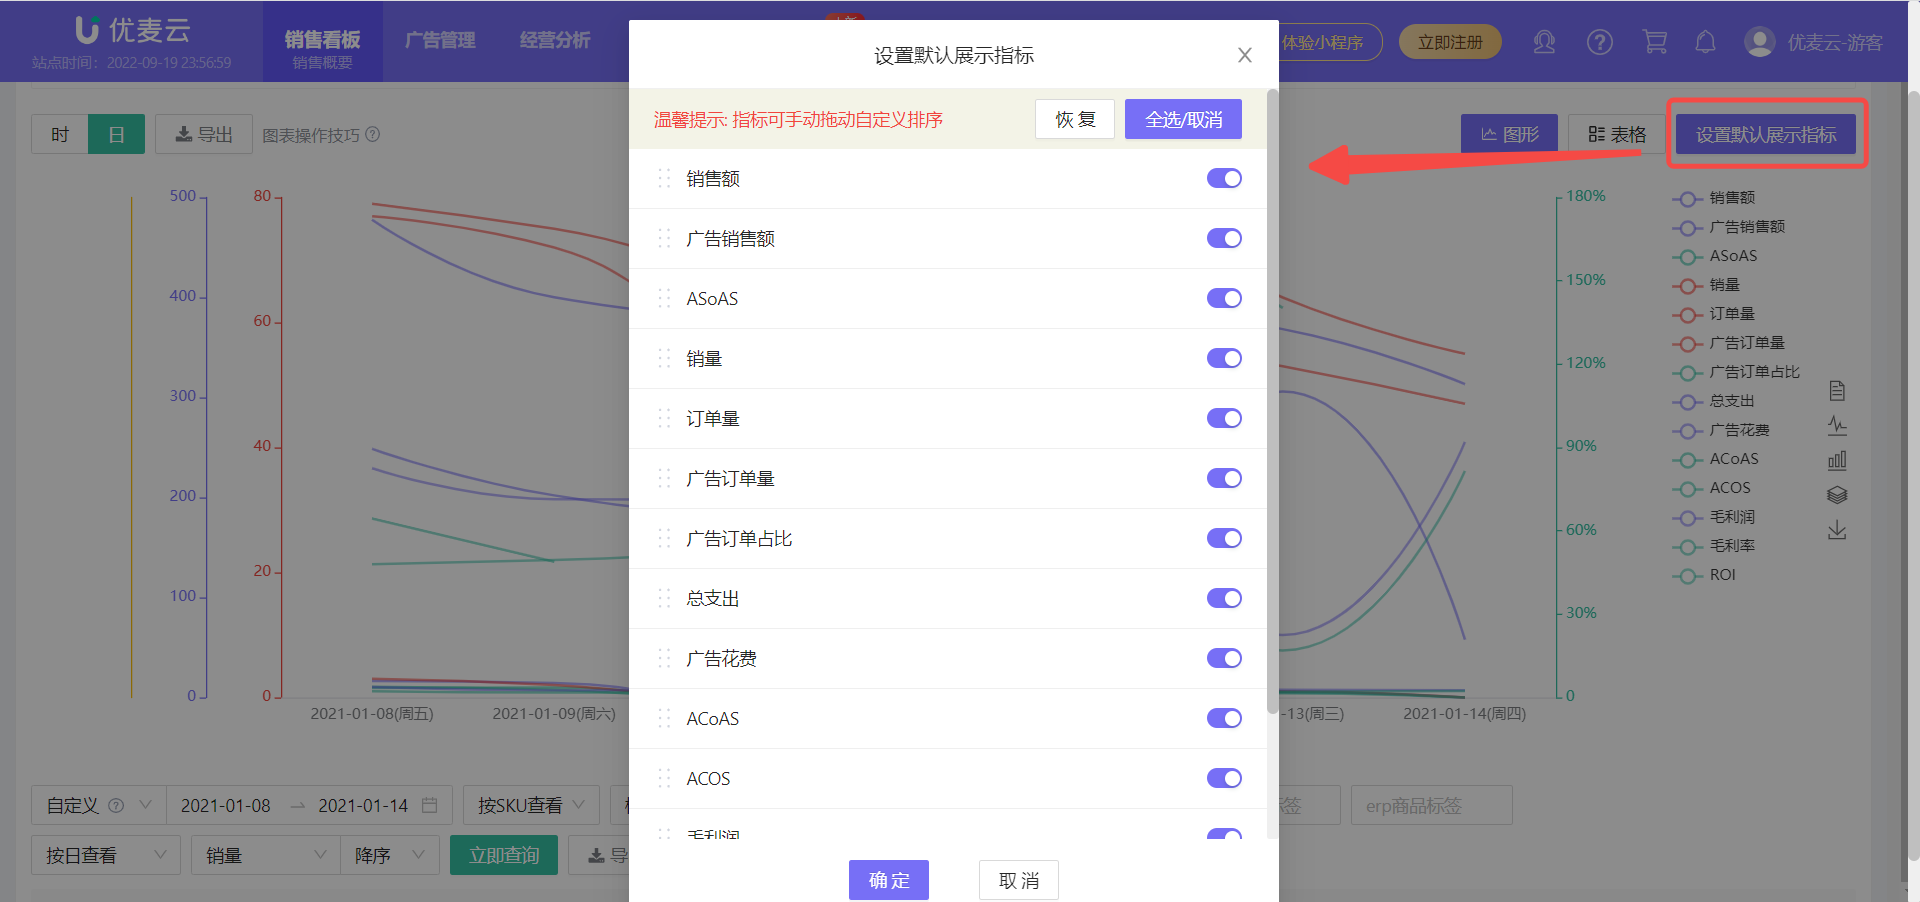
We can also click 【Set Default Display Metrics】 in the upper right corner to set the default display metrics for the chart in this module. After setting, the Sales Chart will default to displaying the selected metrics next time you enter.
 +
+
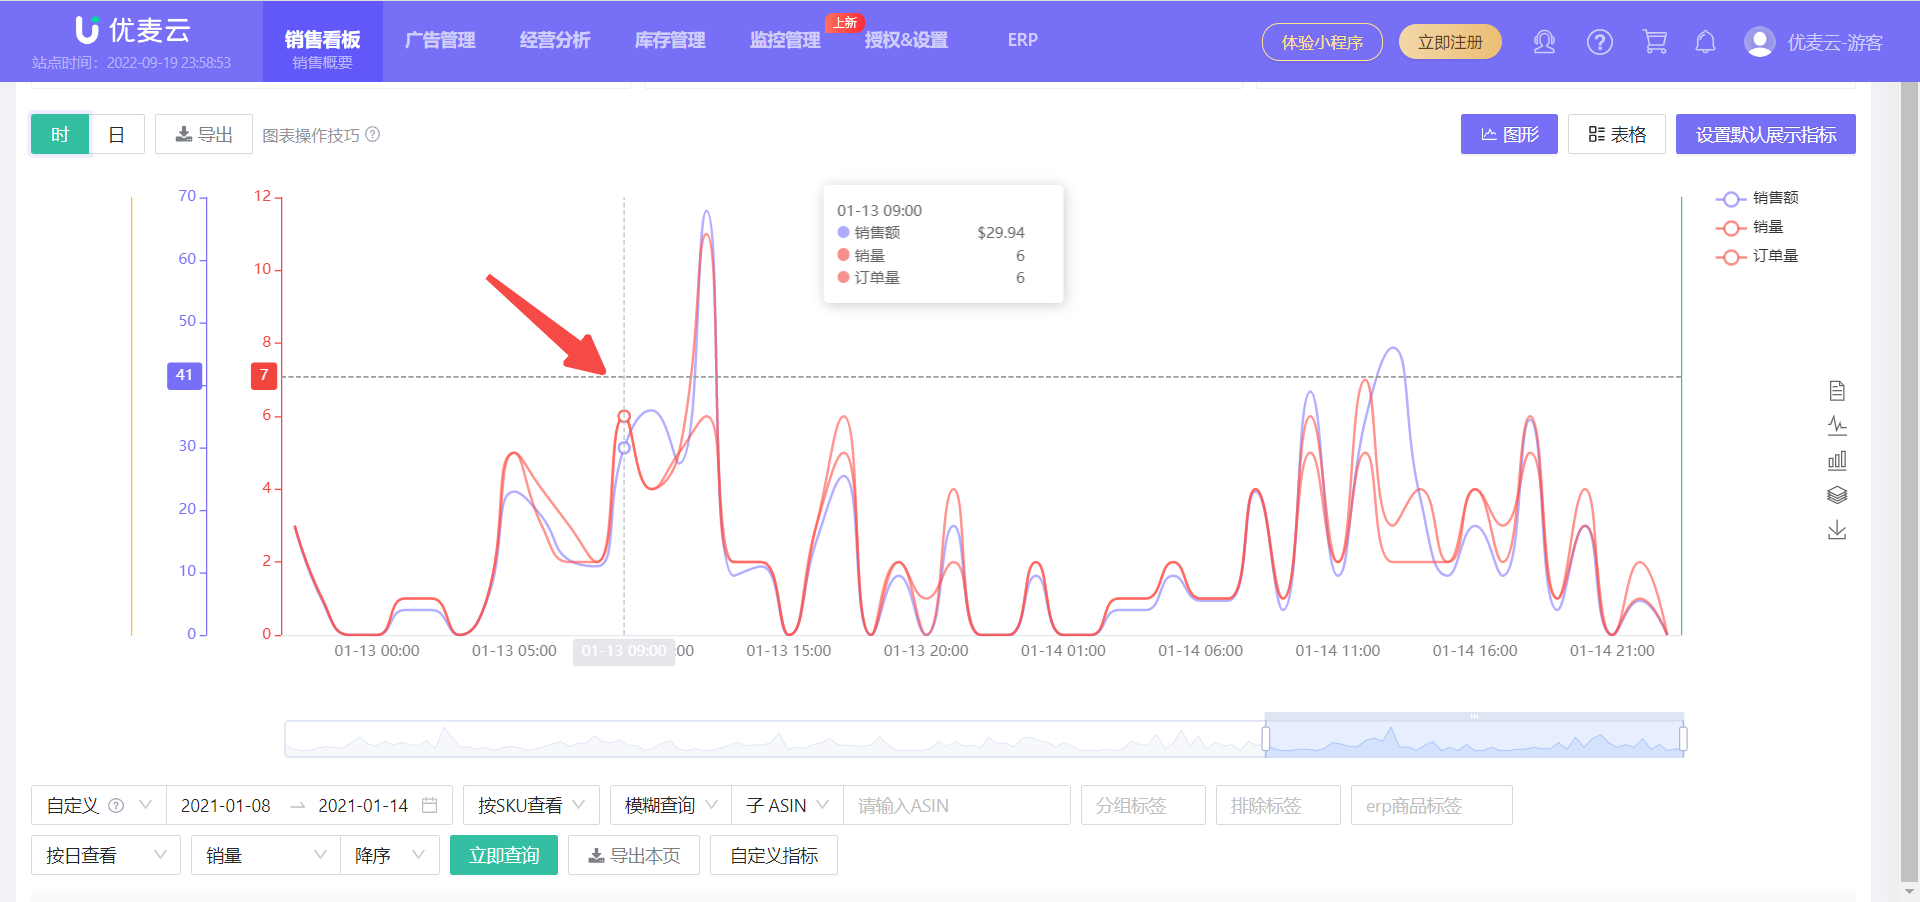
In addition to the daily sales trend, you can also view the hourly sales trend data of the store here to analyze the sales changes every hour.
Click 【Hour】 here to switch.
Hourly data includes: Sales Amount, Sales Quantity, and Order Quantity.
 +
+
Hovering over the fluctuation node can also view the corresponding details;
 +
+
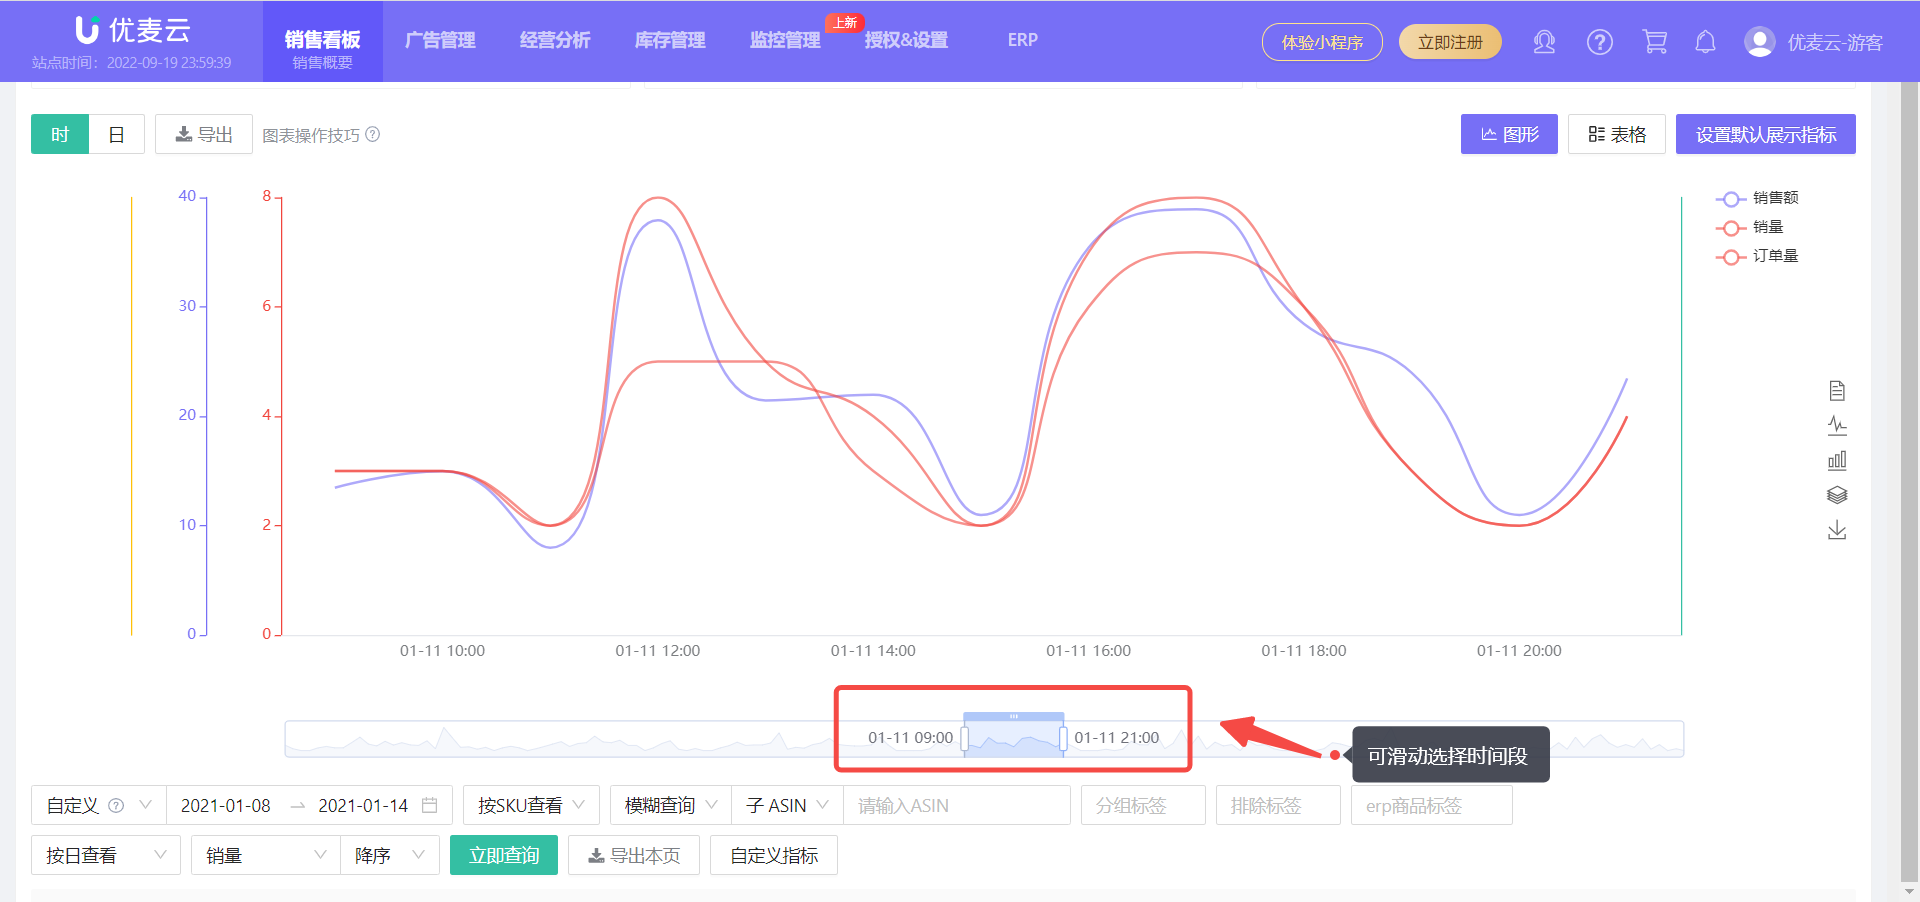
If you think the current time period is too large, slide the time bar below to further select the time period and analyze the corresponding hourly sales data.
 +
+
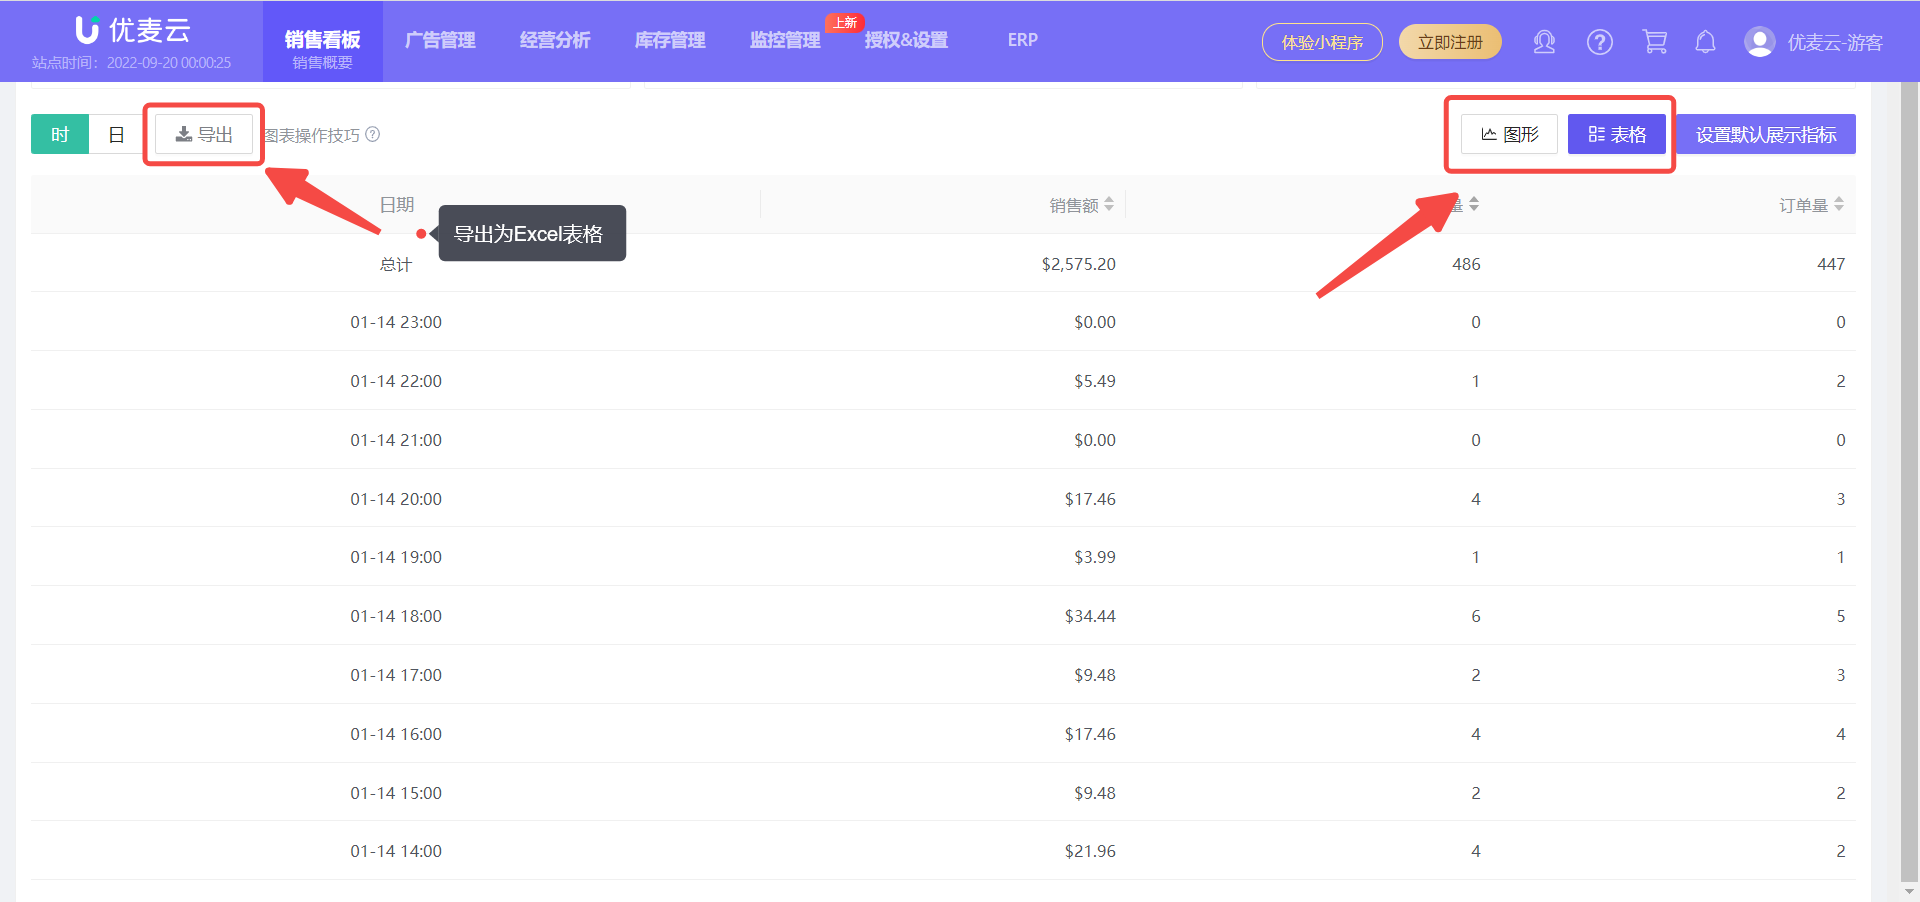
In addition to graphical trends, these metric data also support viewing in tabular form. Click 【Table】 in the upper right corner to switch.
Sales Chart data supports export. Click 【Export】 to export the data in tabular form, which is convenient for further sorting and analysis.
 +
+
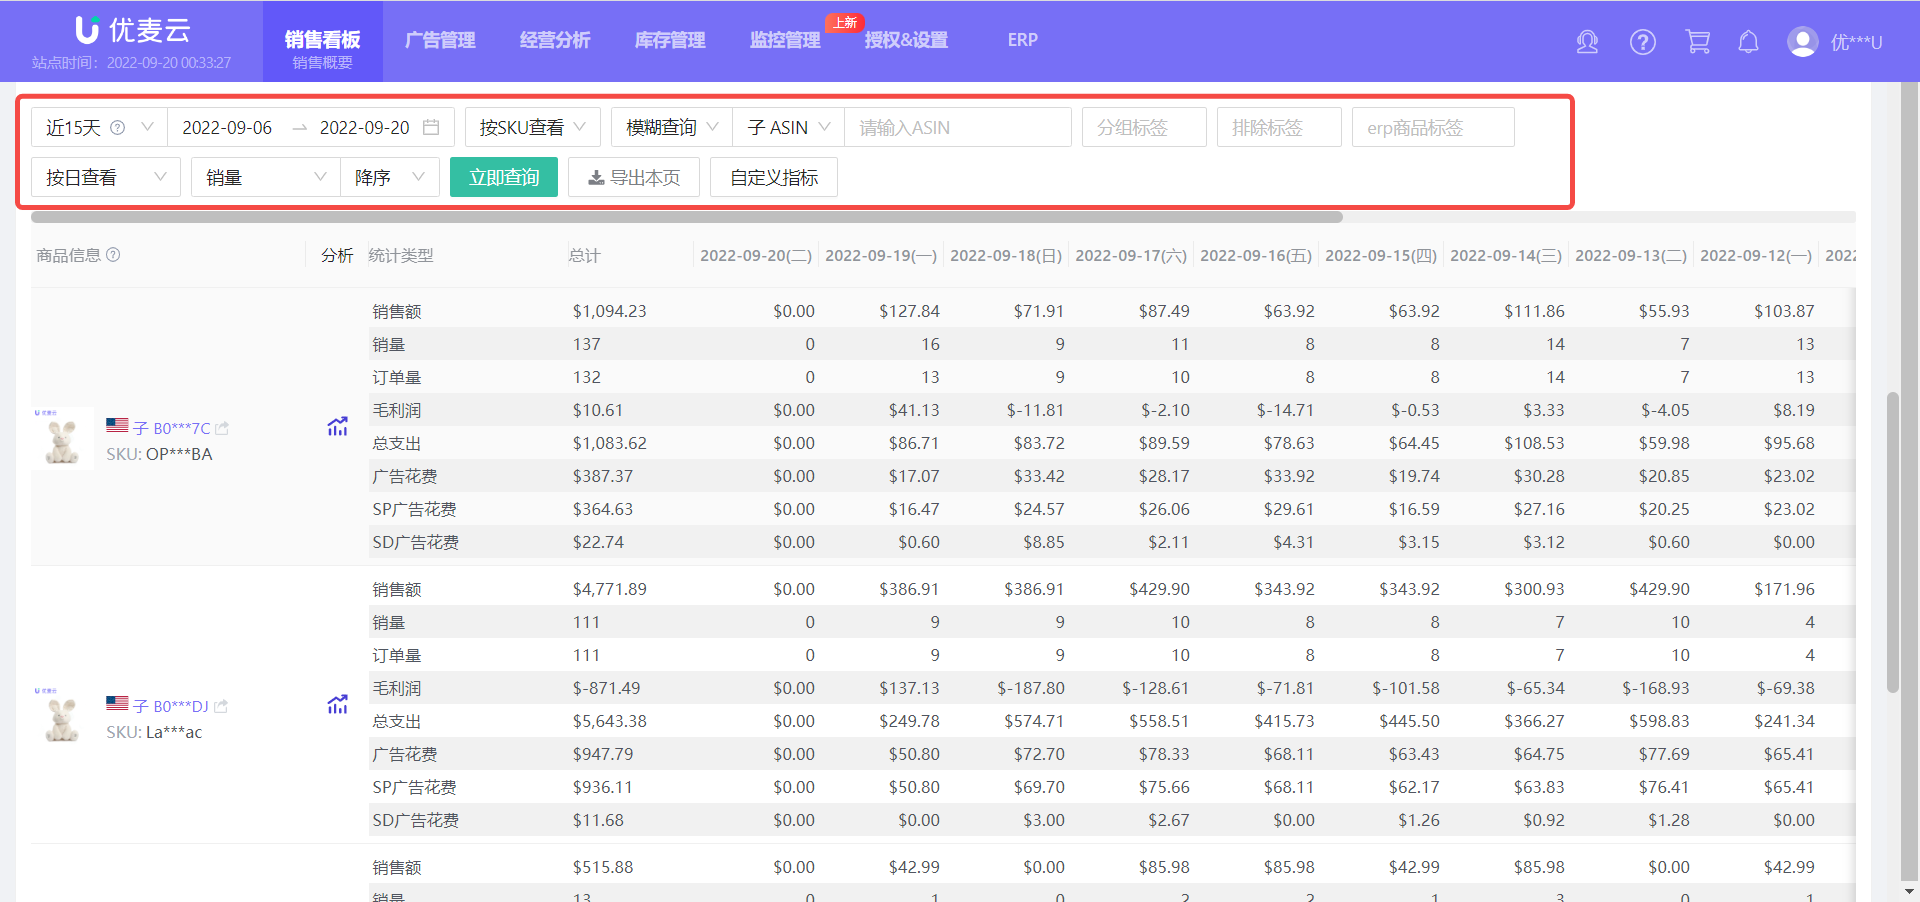
3. Sales Products
The Sales Products section defaults to displaying the product sales details of the current store for the last 15 days (only displays data for products with sales), including a total of 33 sales metrics. Using the query bar above the data, we can refine the analysis dimensions and deeply analyze the sales situation of products.
Through Sales Products, we can understand the sales situation of each product in the store in detail, and analyze its performance: Is it a potential bestseller? Does it need to be optimized? Does it need to be eliminated? and so on, to help us better plan the product listing and promotion rhythm in the store.
 +
+
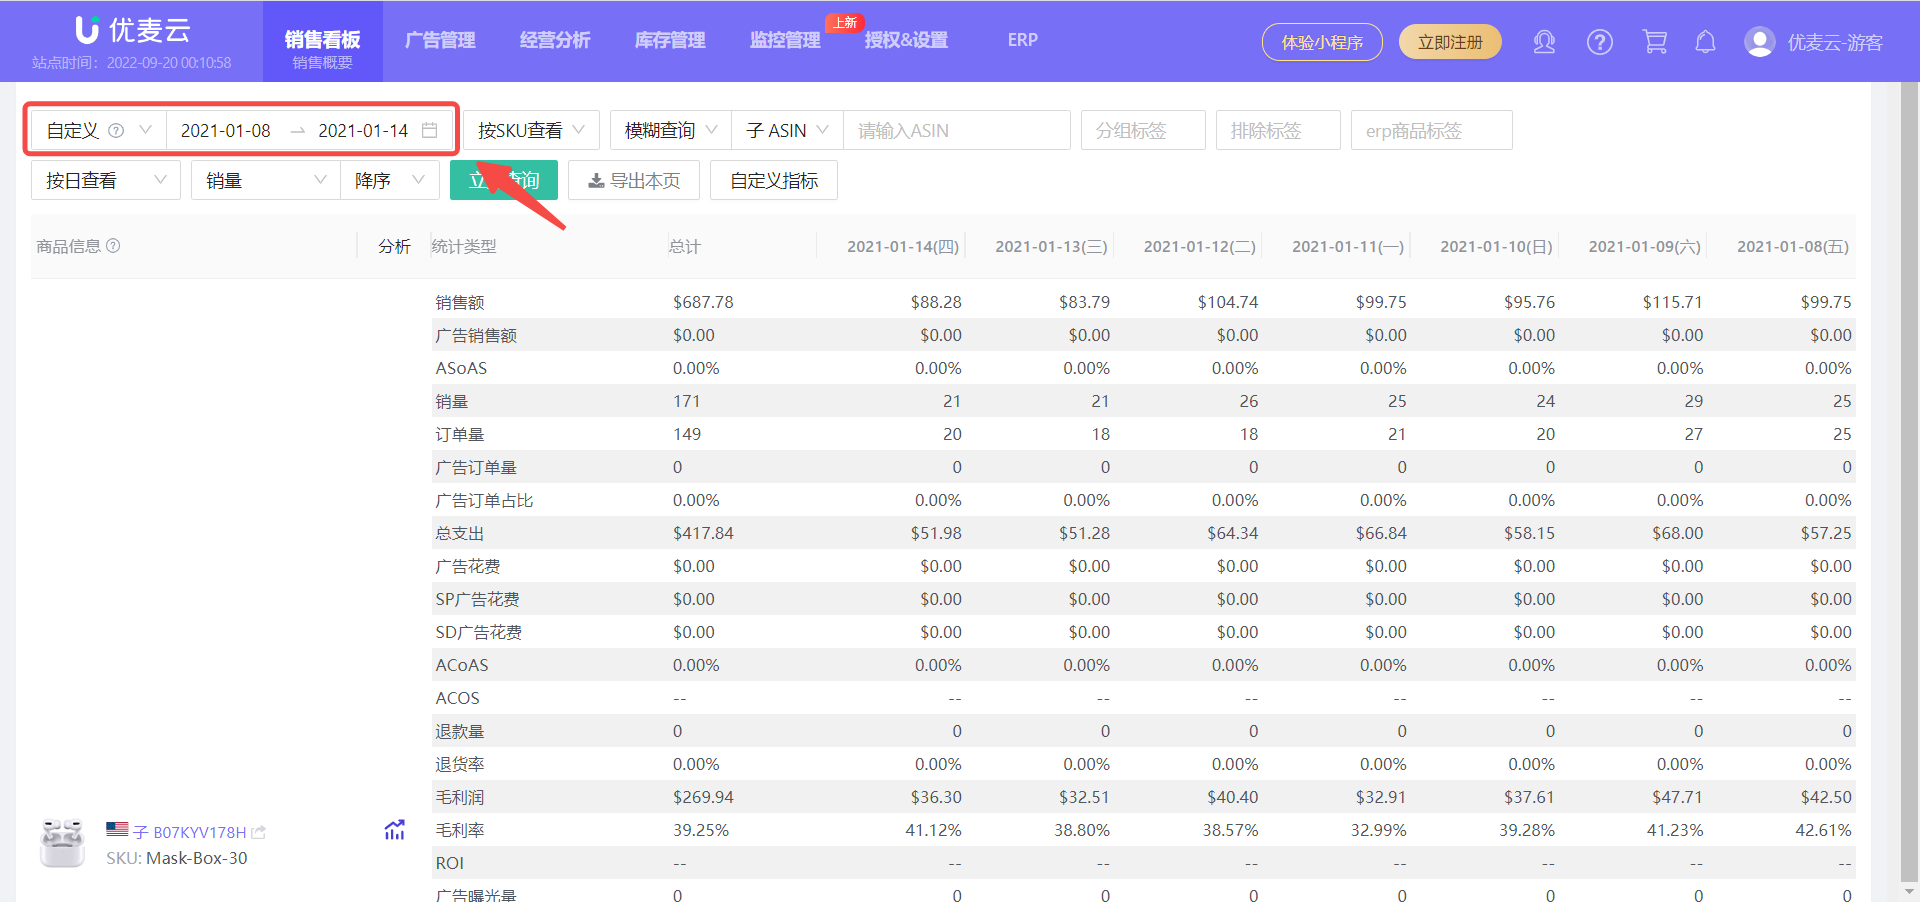
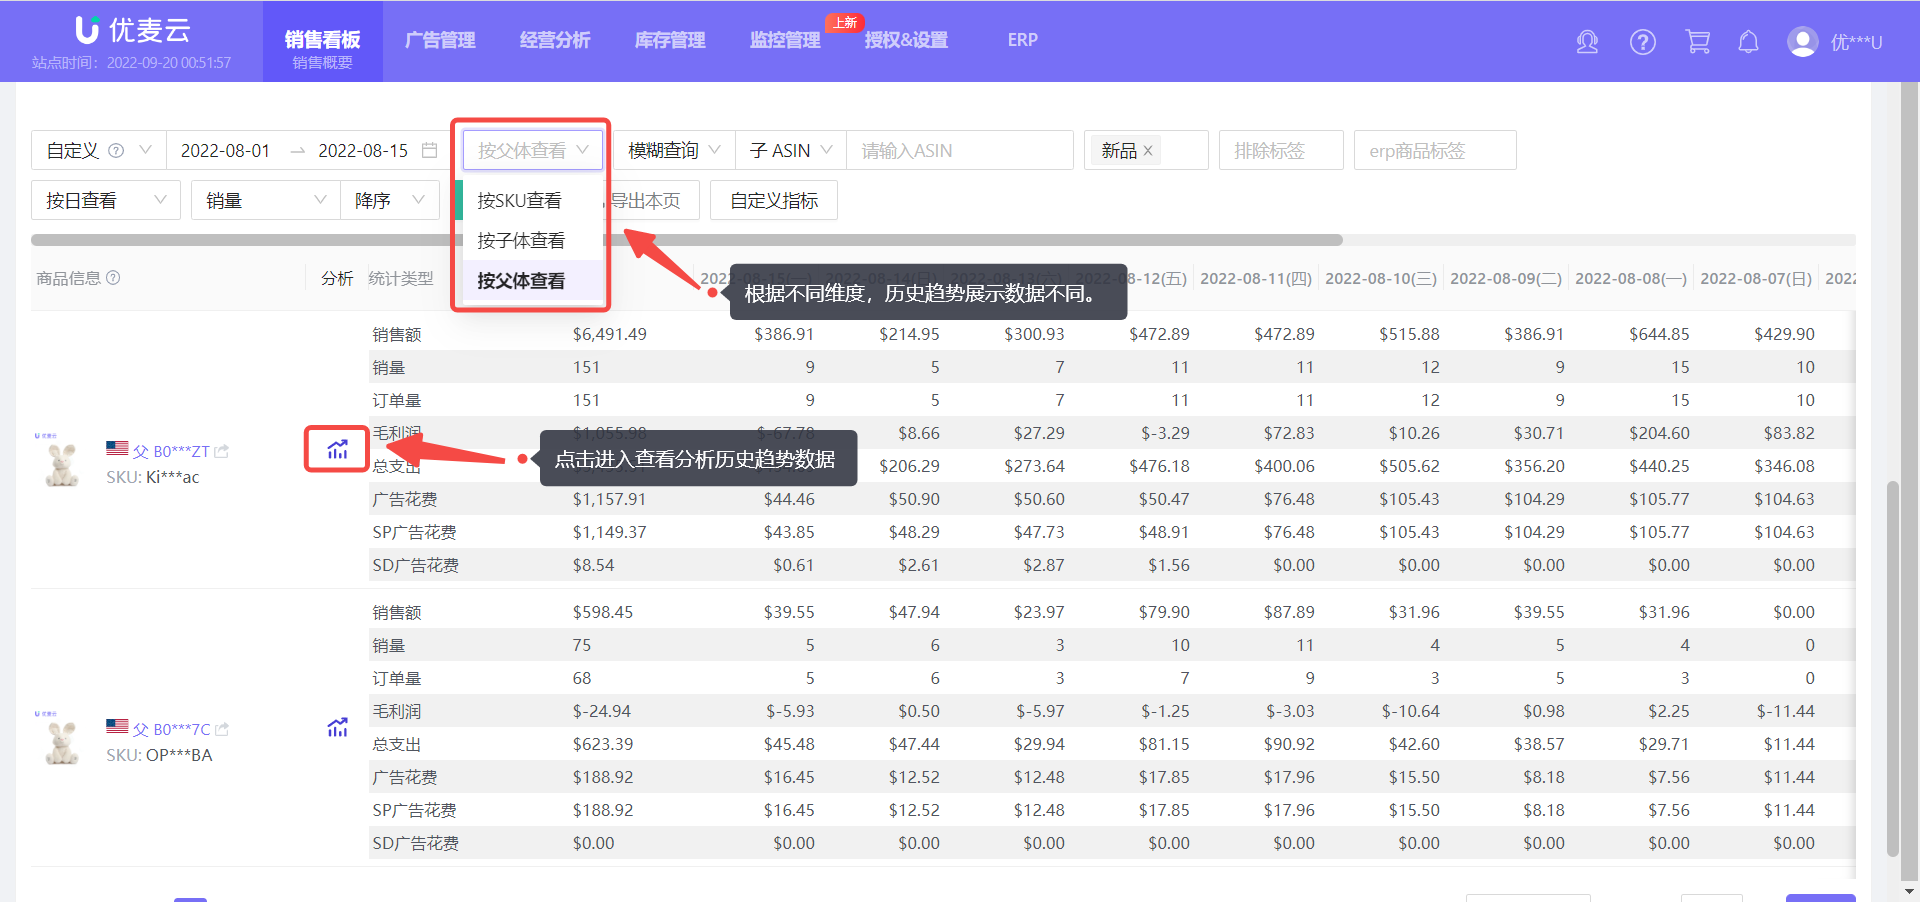
The time bar in the upper left corner can customize the date range, but the span between the start and end dates cannot exceed 1 month.
For example, we view the product sales data for the period from 2022-8-1 to 2022-8-15.
 +
+
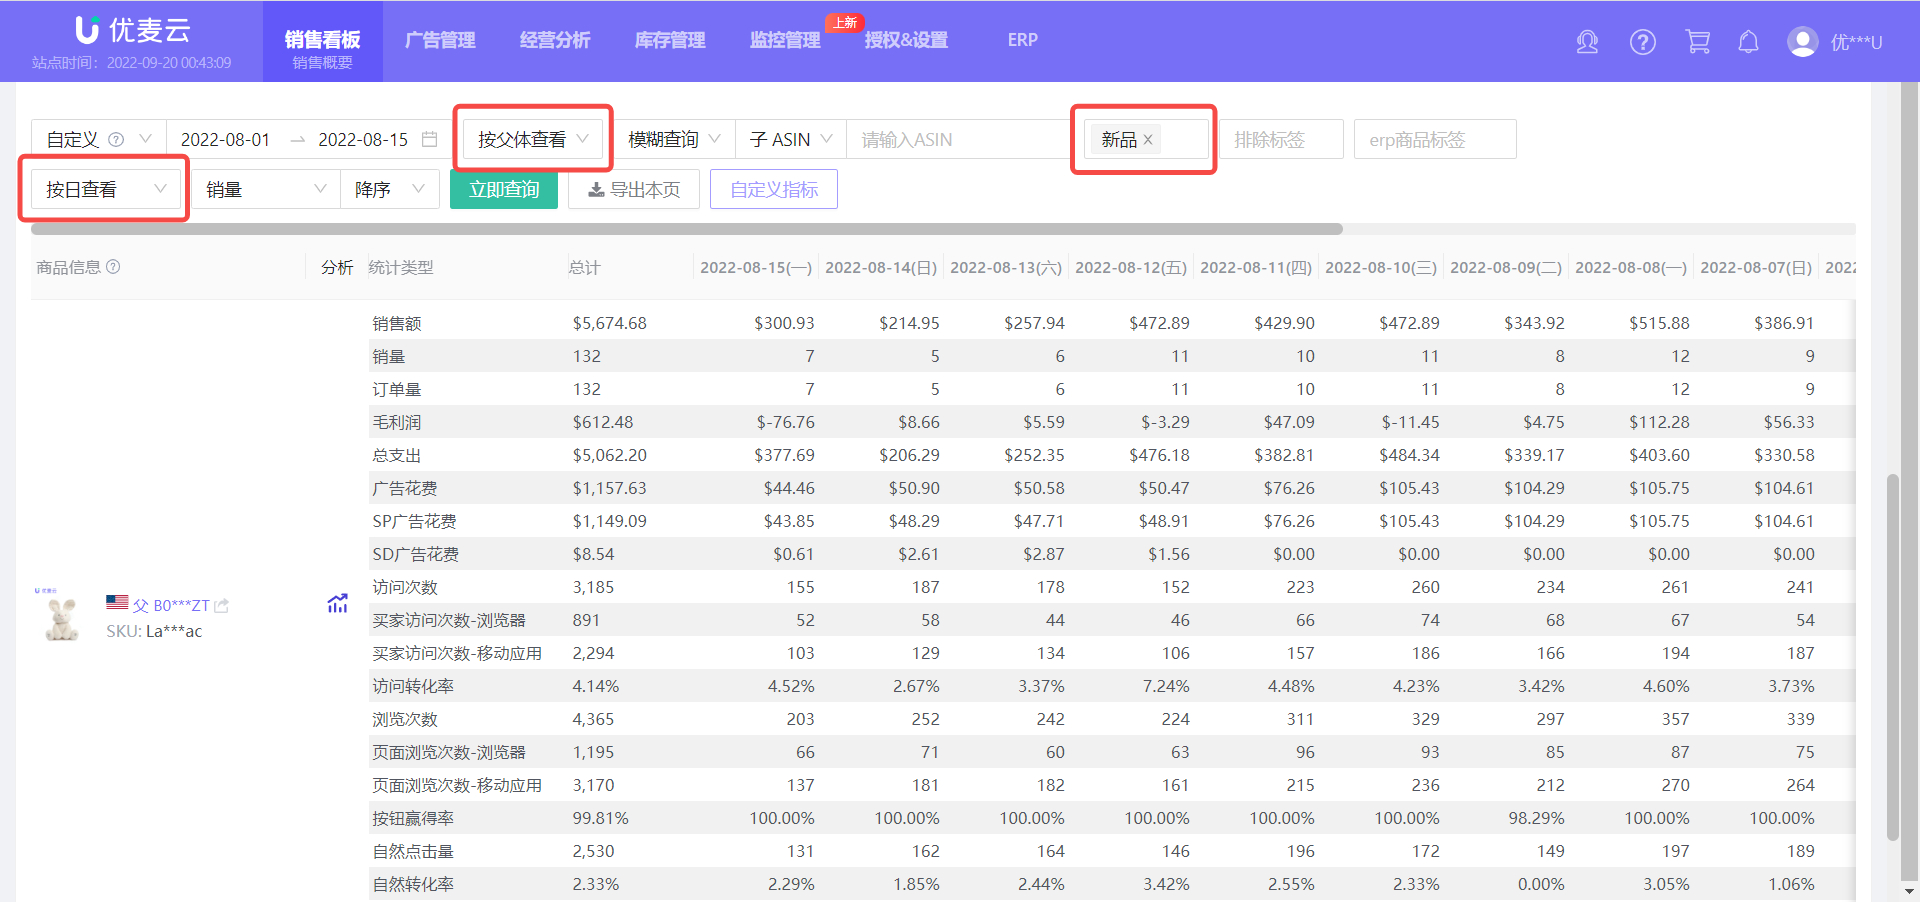
After selecting the time,
We can further limit the conditions, choose to view sales product data by Parent ASIN, by Child ASIN, or by SKU; or directly search for a certain product; or view and analyze the sales details of corresponding products by limiting product tags.
At the same time, you can also further limit the analysis time dimension: view by day or week; sort by a certain sales metric.
For example, we choose to view by Parent ASIN, view products with the tag "New Products", and the time dimension is viewed by day;
In this way, we can search out the parent-child variation products with the tag "New Products" in the store, and the sales details for the week of "2022-8-1 to 2022-8-15". Of course, we can also switch other conditions to find the corresponding product data we need;
 +
+
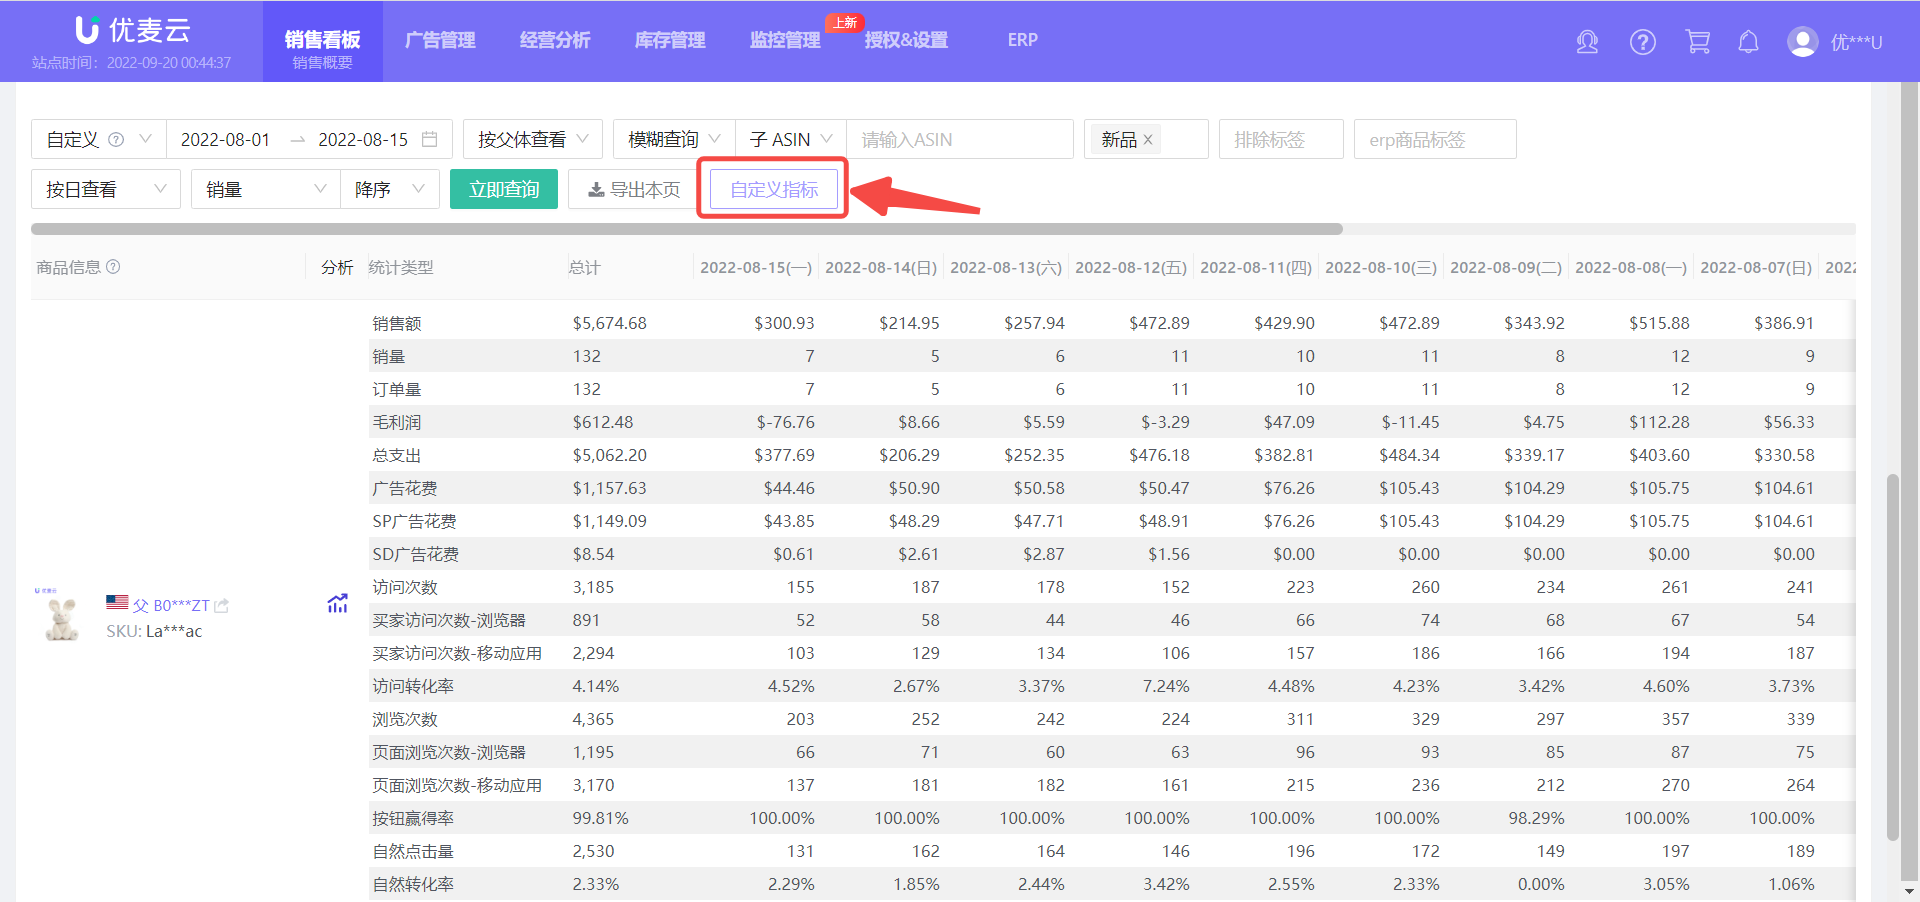
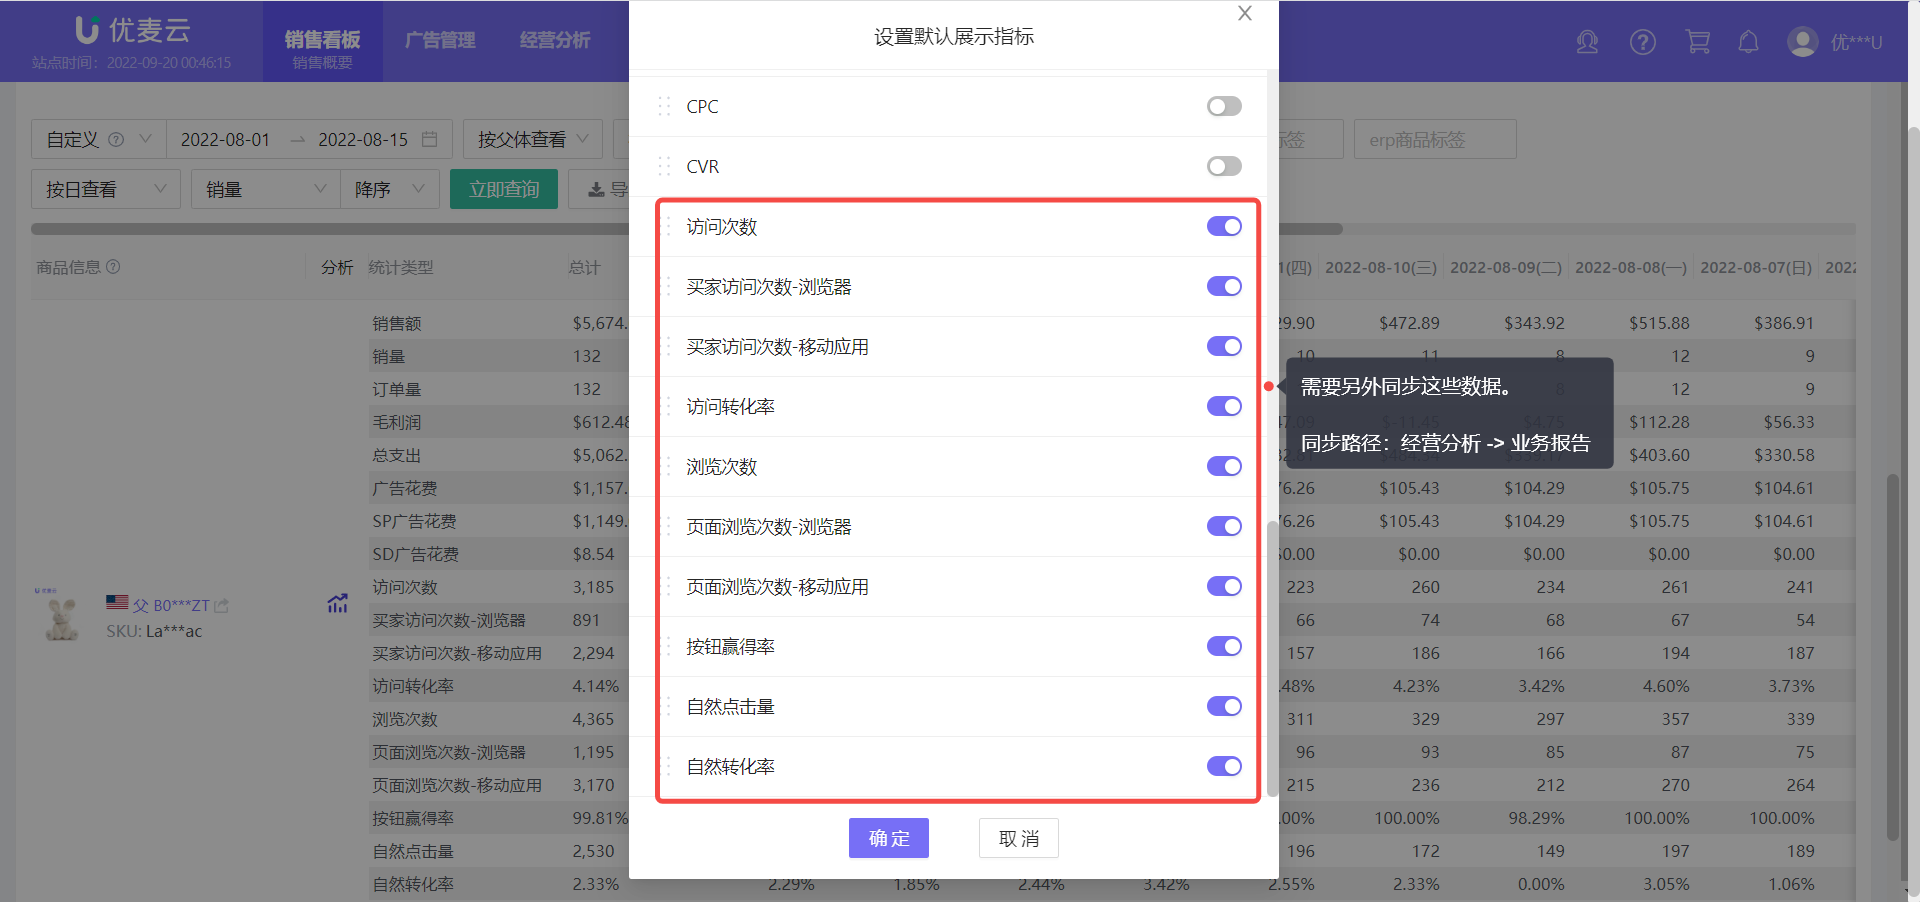
The searched product details include a total of 33 metrics. Click 【Customize Metrics】 to enter and set the metrics to be analyzed (the setting operation is consistent with 【Customize Columns】 of other functions).
 +
+
Among these 33 metrics, we can see metrics such as Page Views, Conversion Rate, etc. These are Business Reports data. If you want to view these data, you need to manually upload daily Business Reports data in Business Insight - Business Reports first.
 +
+
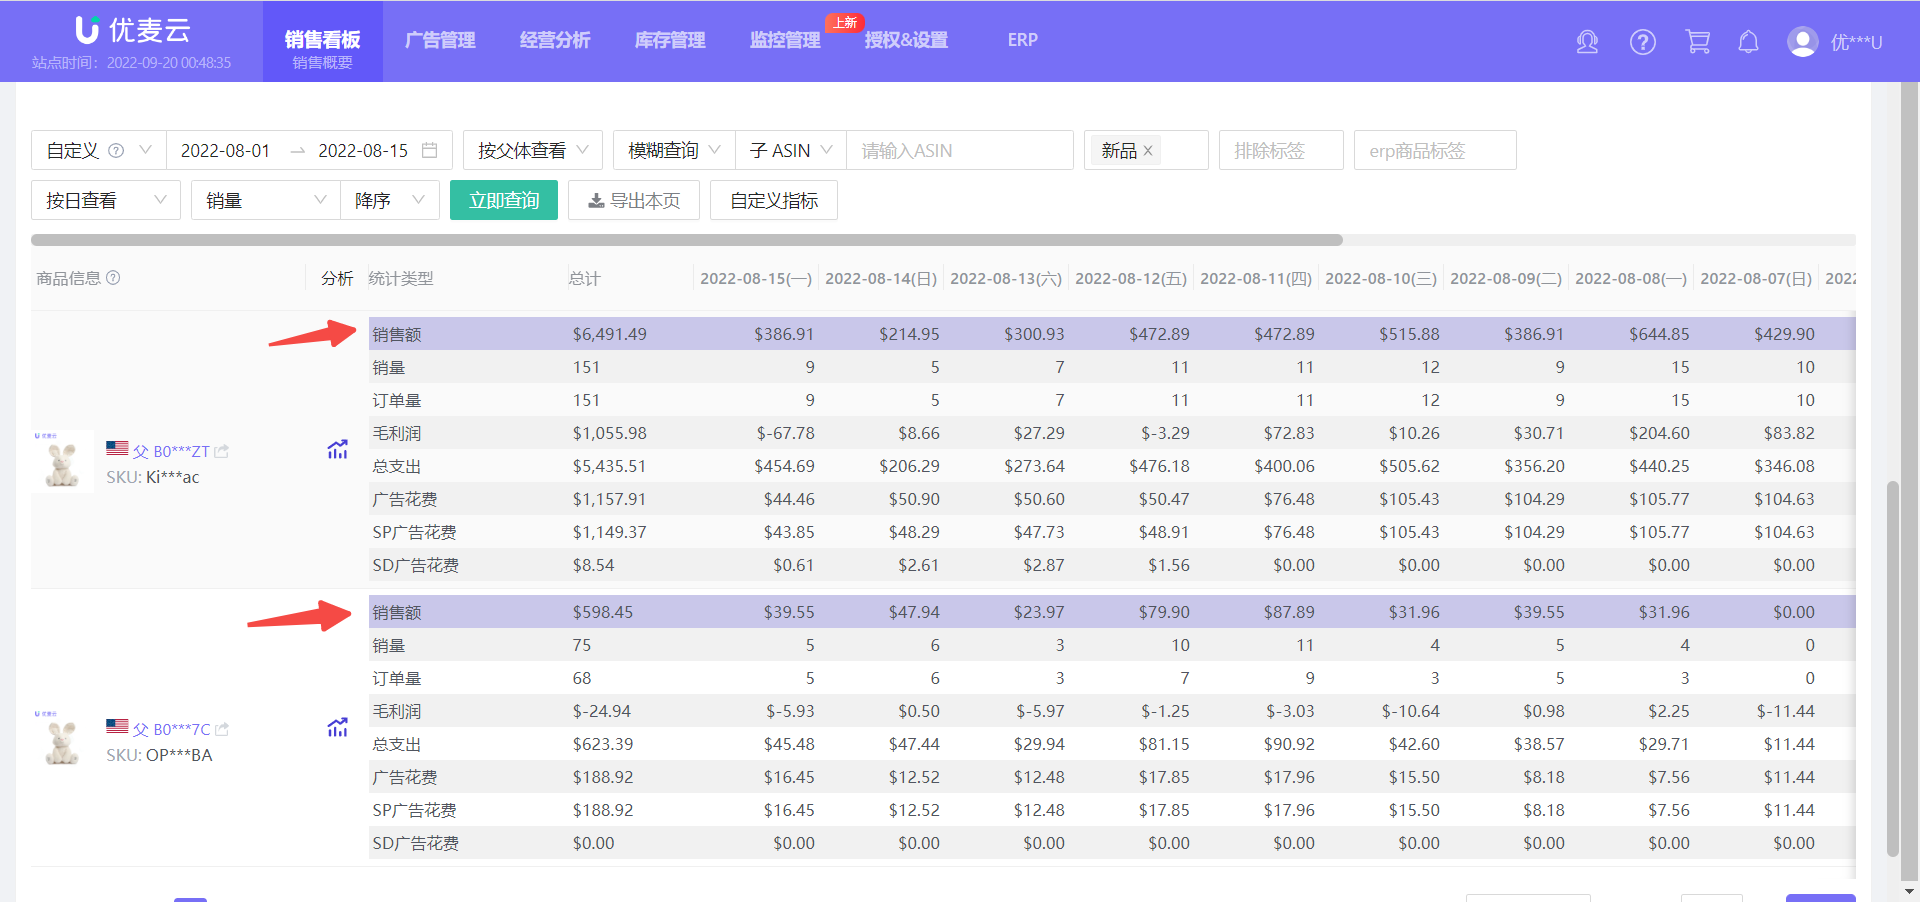
When we find the data to be viewed and compare and analyze it, click a metric in a row, and that metric for all products will be highlighted to facilitate data comparison.
 +
+
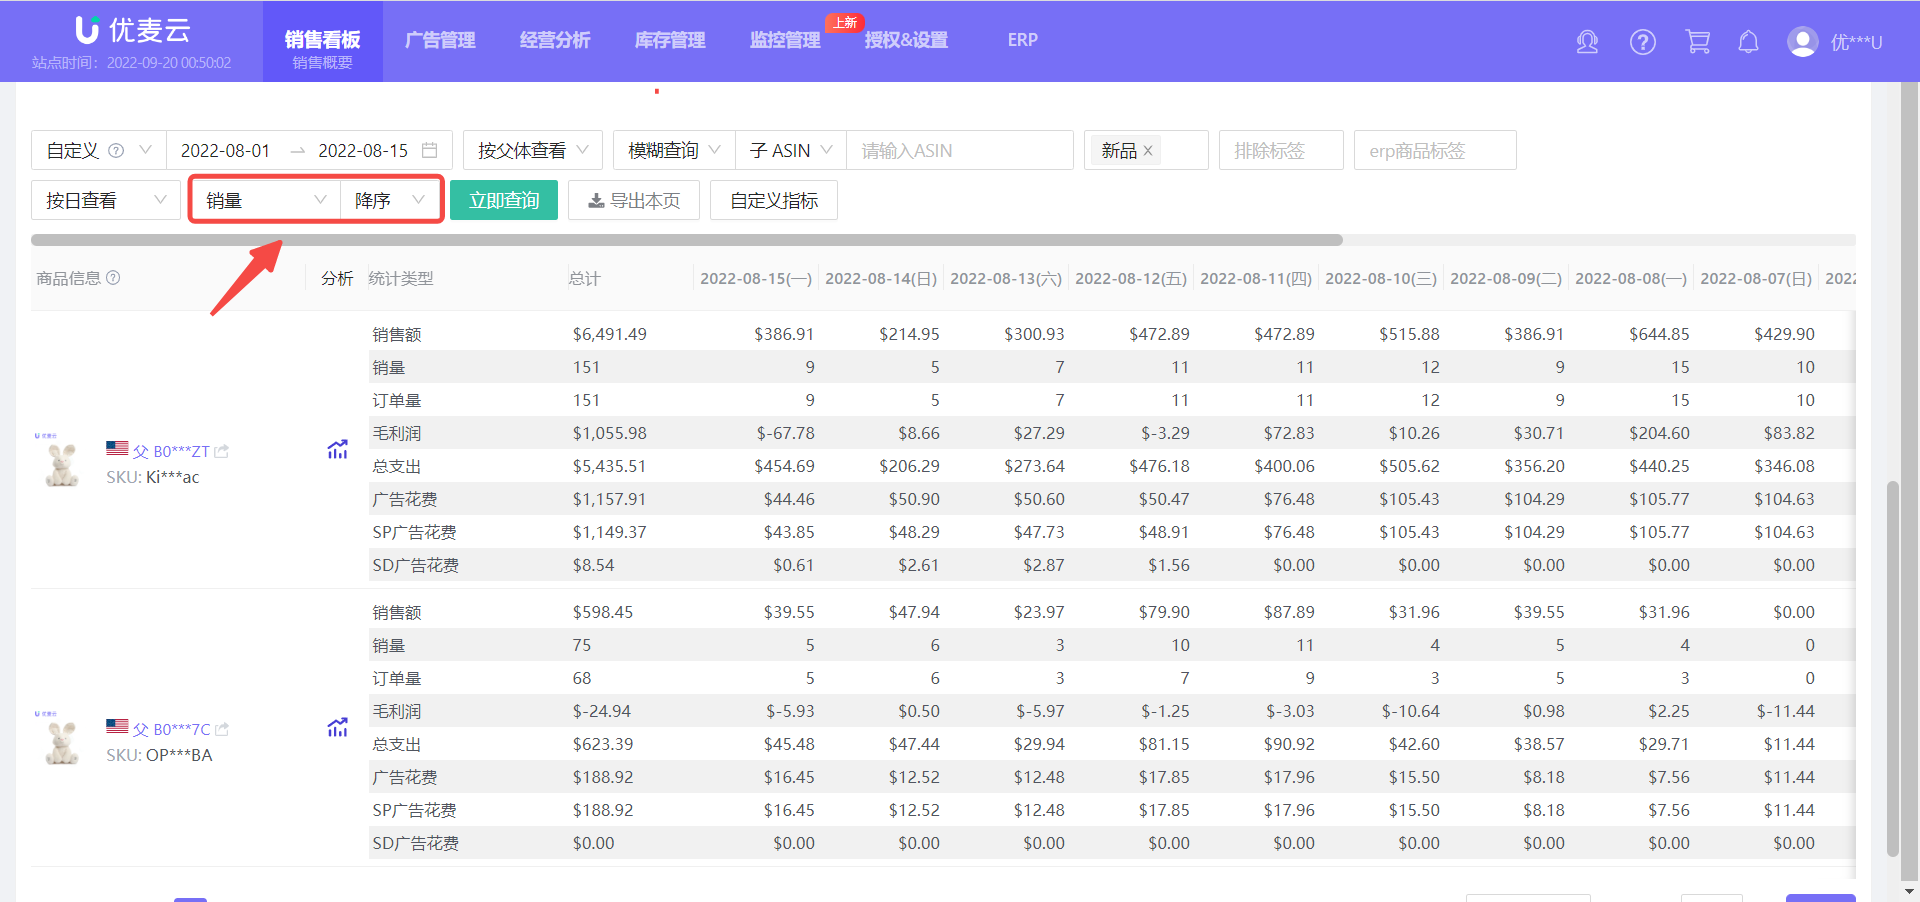
At the same time, all metric data support sorting, helping us quickly find products with corresponding performance.
For example, we choose to sort by Sales Quantity, and the sorting method is descending order. Click 【Search Now】 to find the current top-selling products.
 +
+
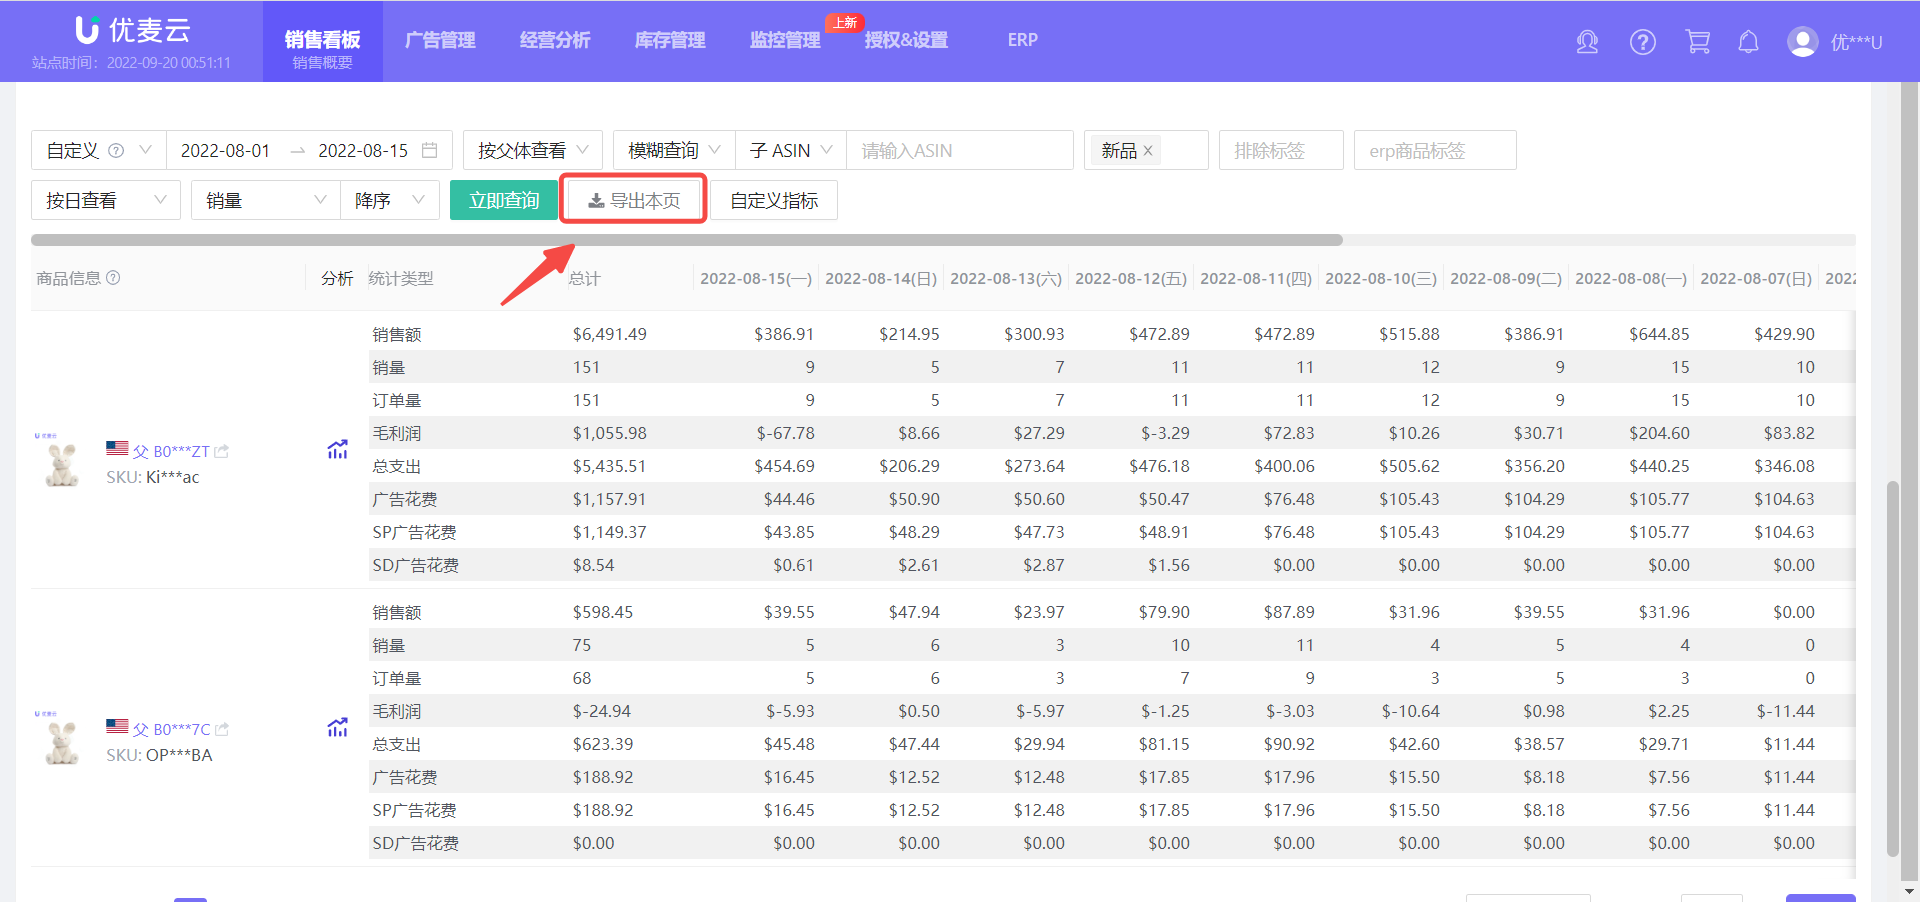
The data we are currently analyzing also supports export. Click 【Export This Page】 here to export the data in tabular form, which is convenient for us to sort and analyze again.
 +
+
Next to the product information, there is also a historical trend data viewing entry for the corresponding product. We can directly further analyze the historical sales trend of a single product here to have a comprehensive understanding of the product's performance.
Click the historical trend icon to enter and view the historical sales trend of the product;
Note here:
If the query condition is viewed by SKU dimension, then you are viewing the historical sales situation of the SKU;
If the query condition is viewed by Child ASIN or Parent ASIN dimension, then you are viewing the historical sales situation of the Child ASIN or Parent ASIN.
 +
+
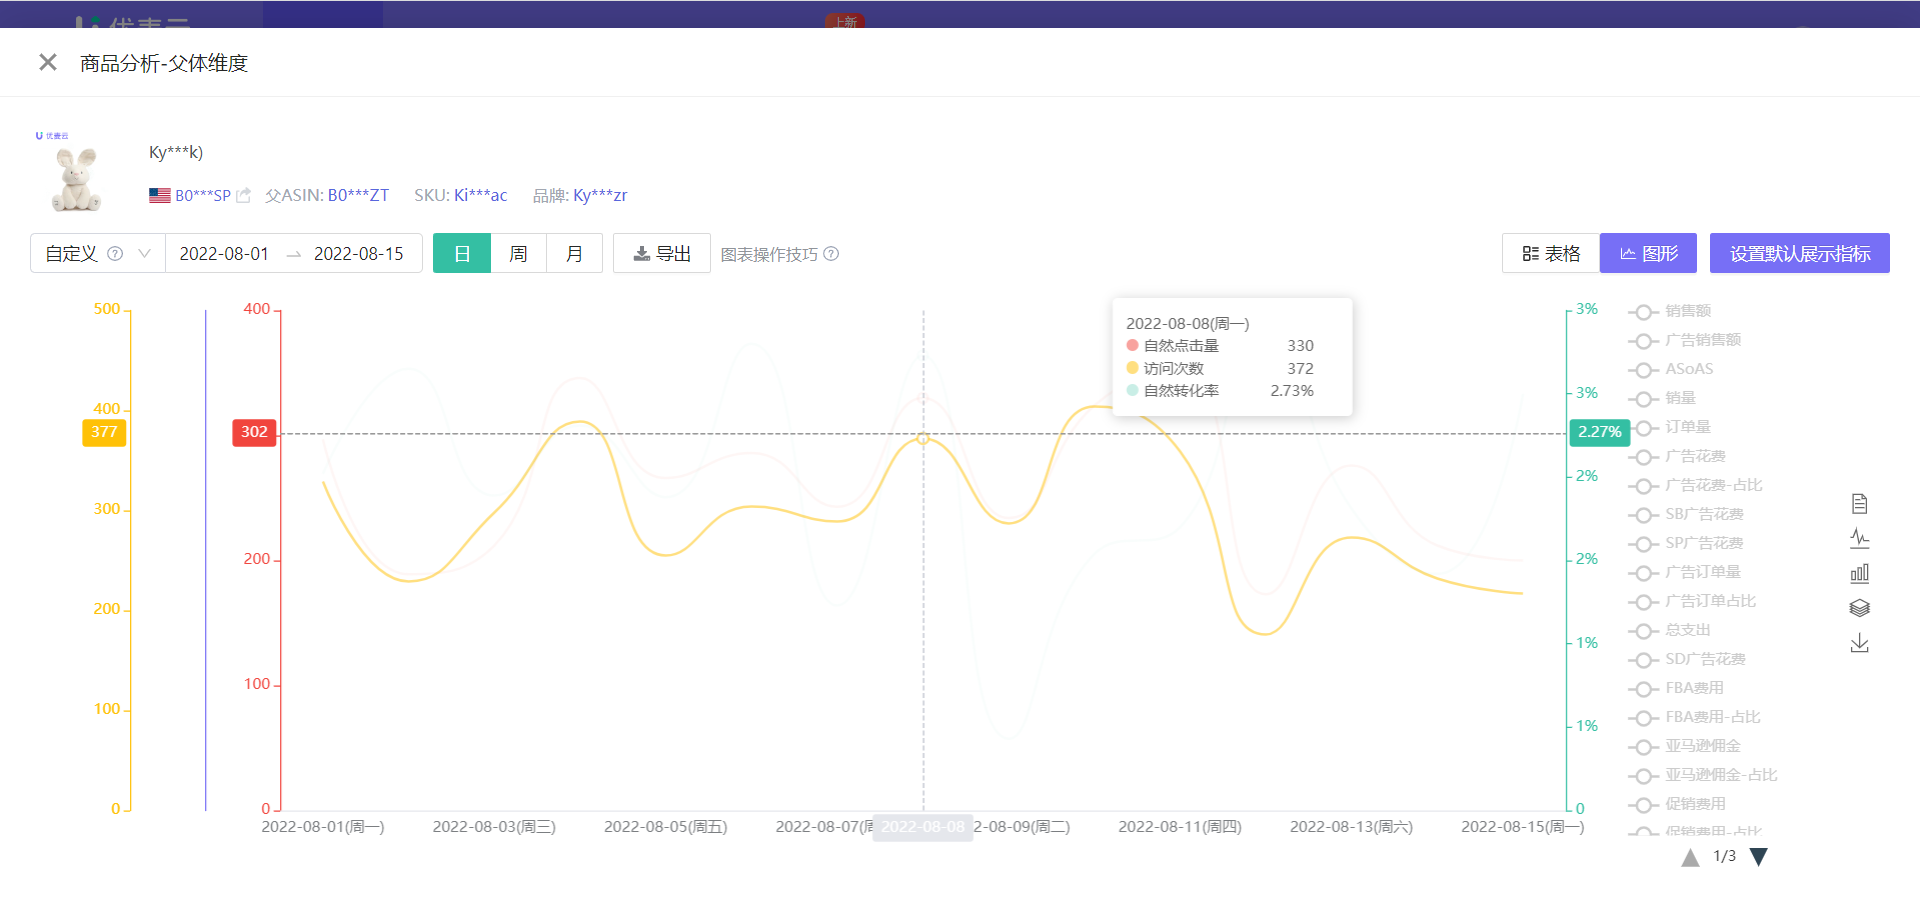
The historical trend data of products is also in chart form and also supports export;
It defaults to displaying the data of the current time period of the sales product, and we can also select or customize other time ranges here.
In addition, the viewing and analysis operations are consistent with "Sales Chart".
 +
+