


2025/03/21Number of reading(9502)Number of comments(0)
I. Target Audience
Operations
II. Feature Introduction
SellerSpace's Marketplace Analysis feature helps you analyze the performance of each marketplace or store from a marketplace/store dimension perspective.
With the Marketplace Analysis feature, you can choose to view and compare data for a single marketplace/store or multiple marketplaces/stores for the same period, as well as select summarized data for marketplaces.
The data includes almost all operational analysis metrics:
Sales: Amazon Backend Order Volume, Amazon Backend Units Sold, Amazon Backend Sales Revenue, Order Volume, Units Sold, Sales Revenue, Order Amount, Returns
Business: Visits, Buyer Visits - Mobile, Buyer Visits - Desktop, Visit Conversion Rate, Page Views, Page Views - Mobile, Page Views - Desktop, Organic Clicks, Organic Conversion Rate
Profit: Gross Profit, Gross Profit Margin, ROI (Return on Investment), Return Rate
Expenses: Total Expenses, FBA Fees, Amazon Commission, Promotion Fees, Refund Amount, Product Cost Restock, Refund Fees, Amazon Other Fees, System Set Product Cost, System Set Other Costs, Advertising Costs
Advertising: Ad Impressions, Ad Clicks, Ad Click-Through Rate (CTR), Advertising Orders, Advertising Order Ratio, CVR, CPC, ROAS, ACOS, ACoAS
Inventory: Total Inventory, Sellable Inventory, SKUs to Restock, Redundant SKUs, Estimated Inventory Value
Monitoring: Negative Reviews, Hijackers.
At the same time, you can also compare the operational metric data of different marketplaces to easily compare the operational differences between different marketplaces.
III. Use Cases
- Summarize and view the sales and operational data of all stores, including almost all operational metrics
- Compare operating data trends across different marketplaces and dimensions
IV. Data Synchronization Frequency
Synchronizes every 15-30 minutes
V. Operation Guide
1. Overview of Store/Marketplace Dimension Operational Data
SellerSpace provides multi-dimensional filtering conditions. You can analyze the operational status of your store or marketplace from different times, marketplace/store dimensions, base currencies, etc., accurately identify operational loopholes, and make timely adjustments.
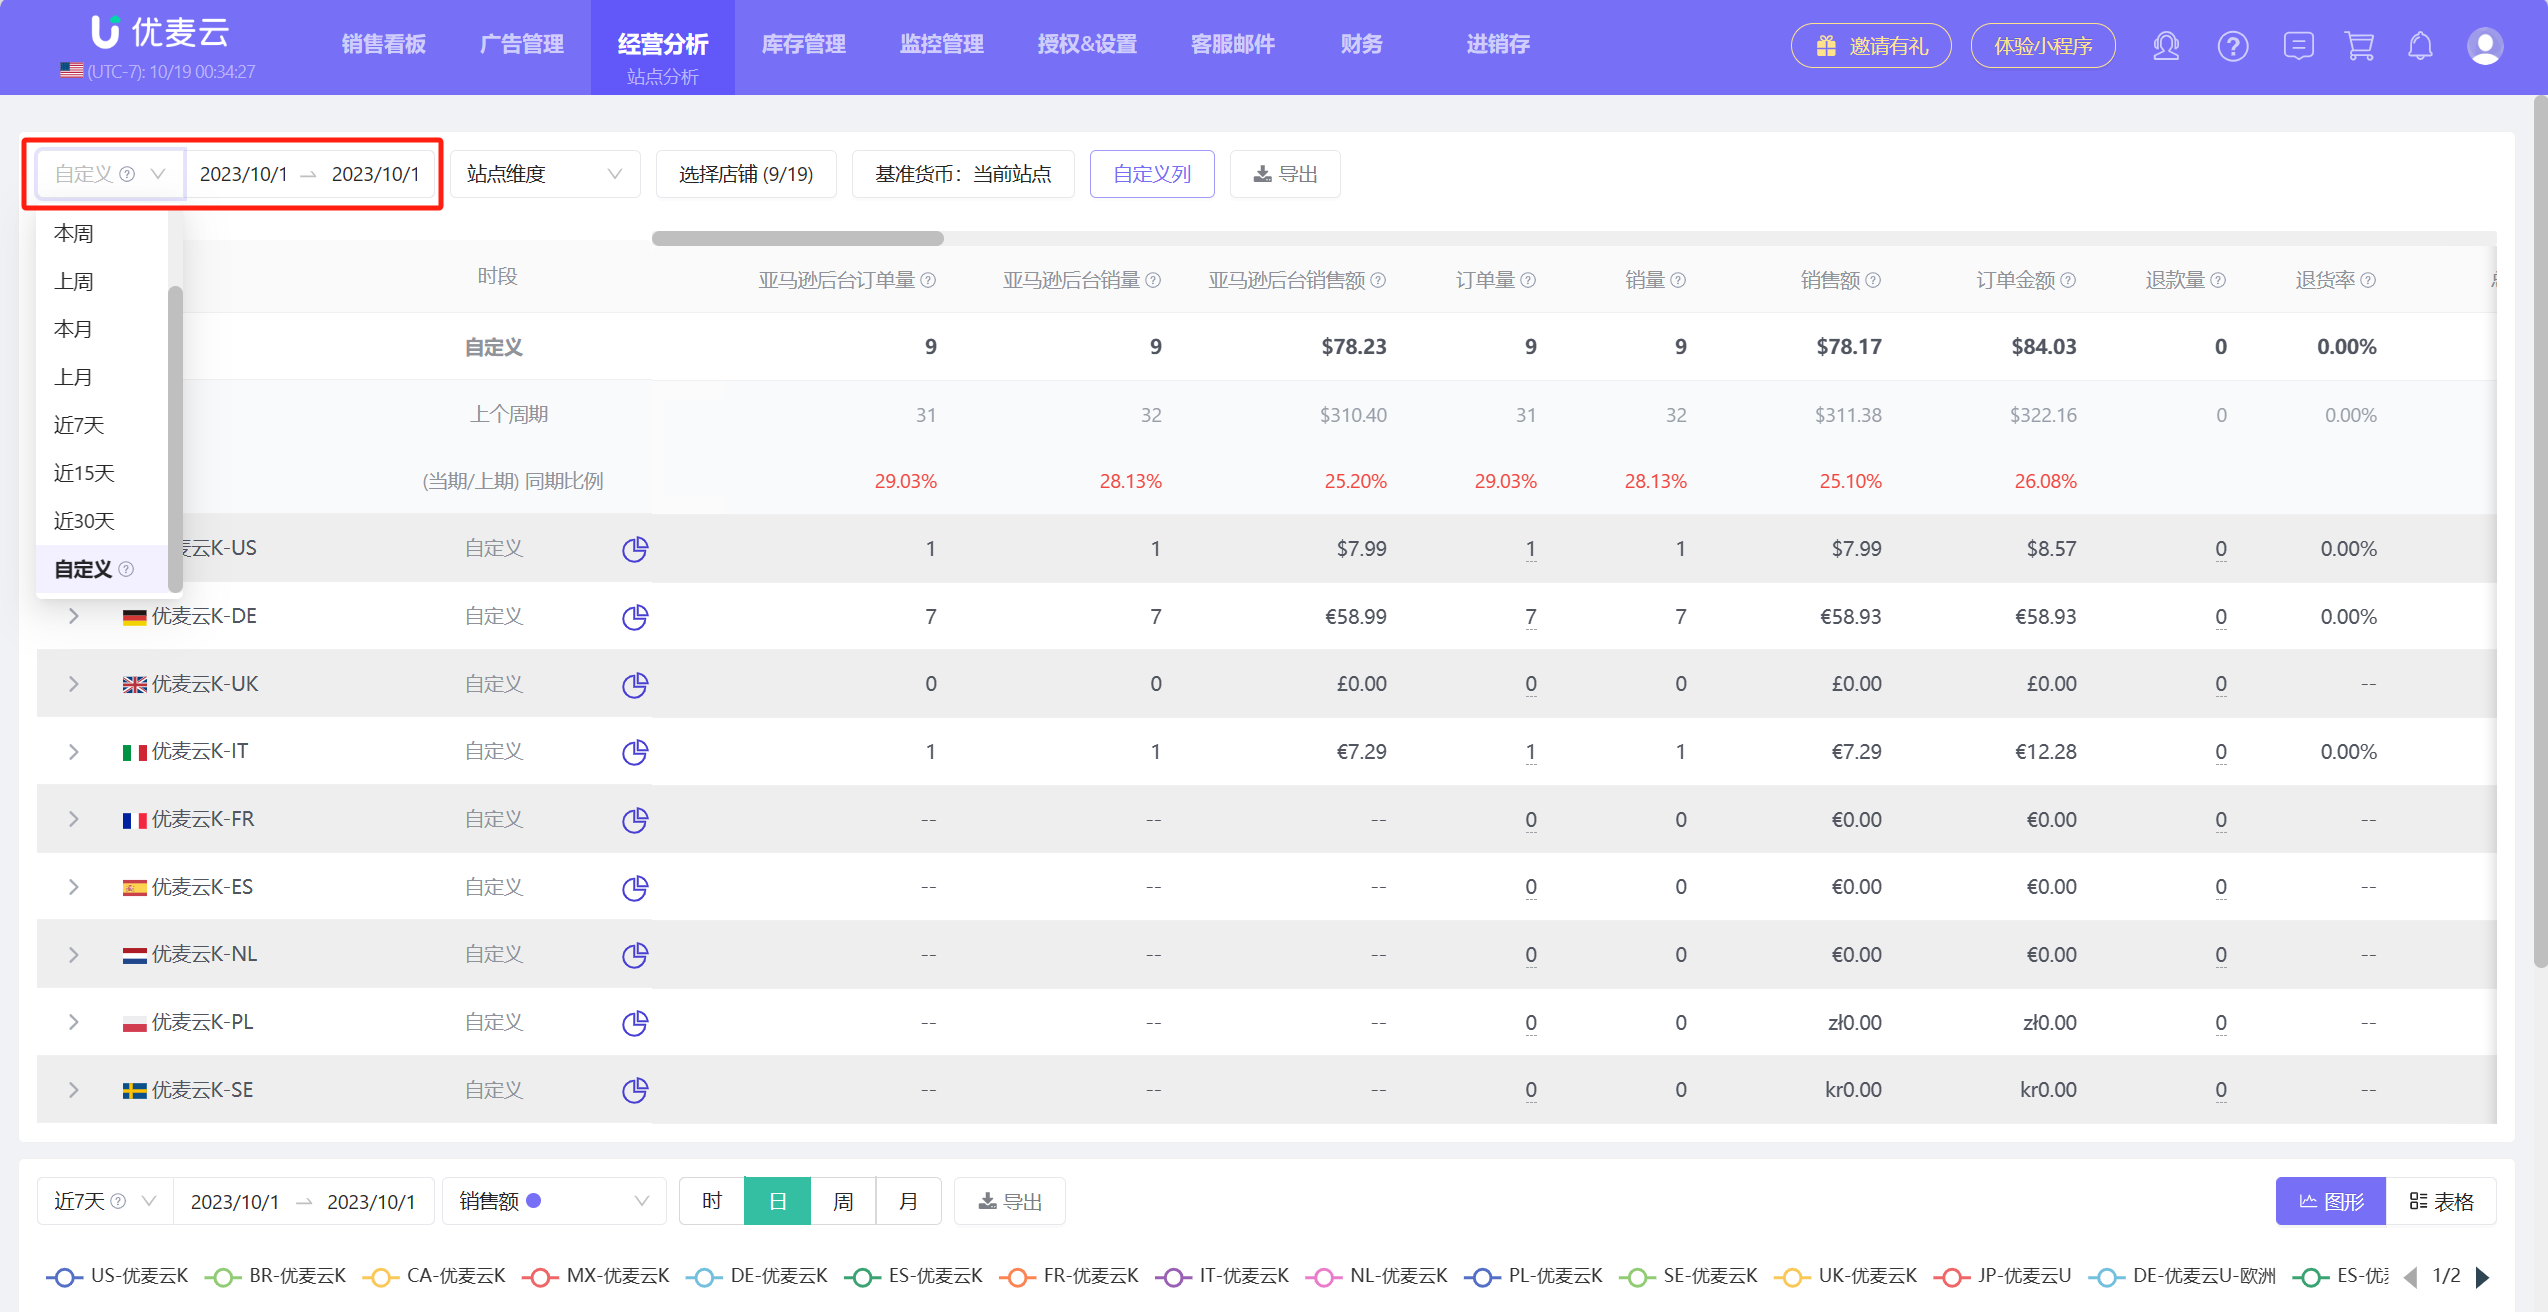
① Filter Time Range
You can choose to view data for Today, Yesterday, This Week, This Month, Last Month, Last 7 Days, Last 15 Days, Last 30 Days, or directly customize the time range.
 +
+
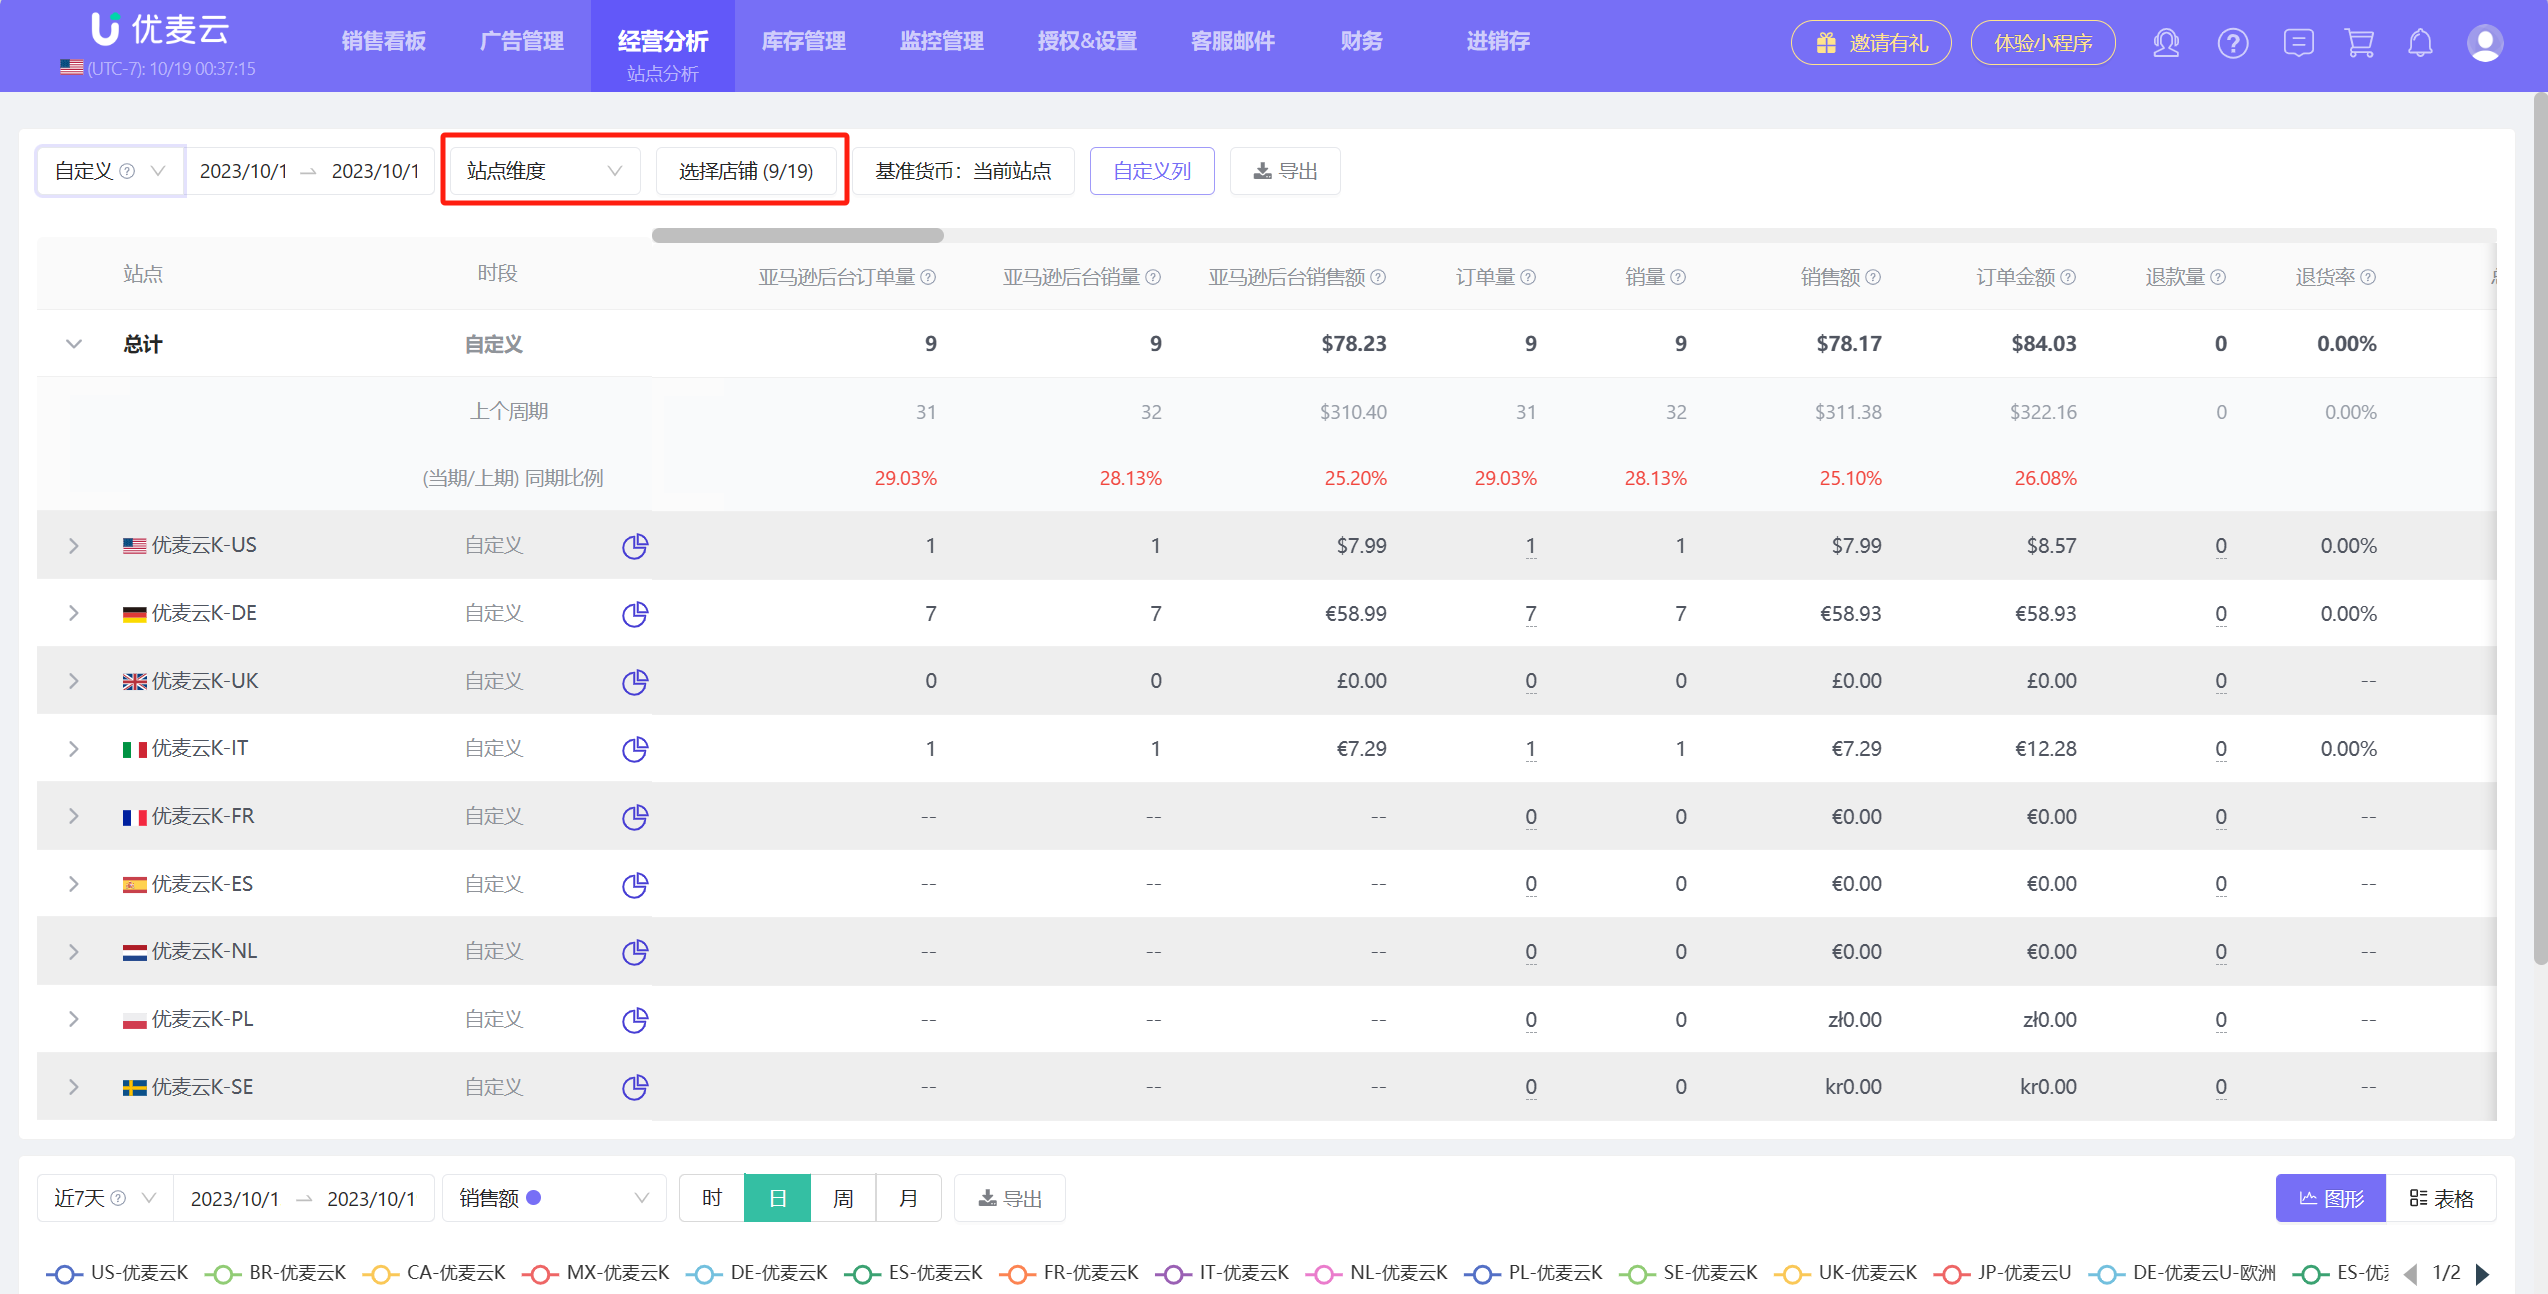
② Filter Store Dimension/Marketplace Dimension
You can choose the store dimension or marketplace dimension, and then select a single store or all stores to view data.
 +
+
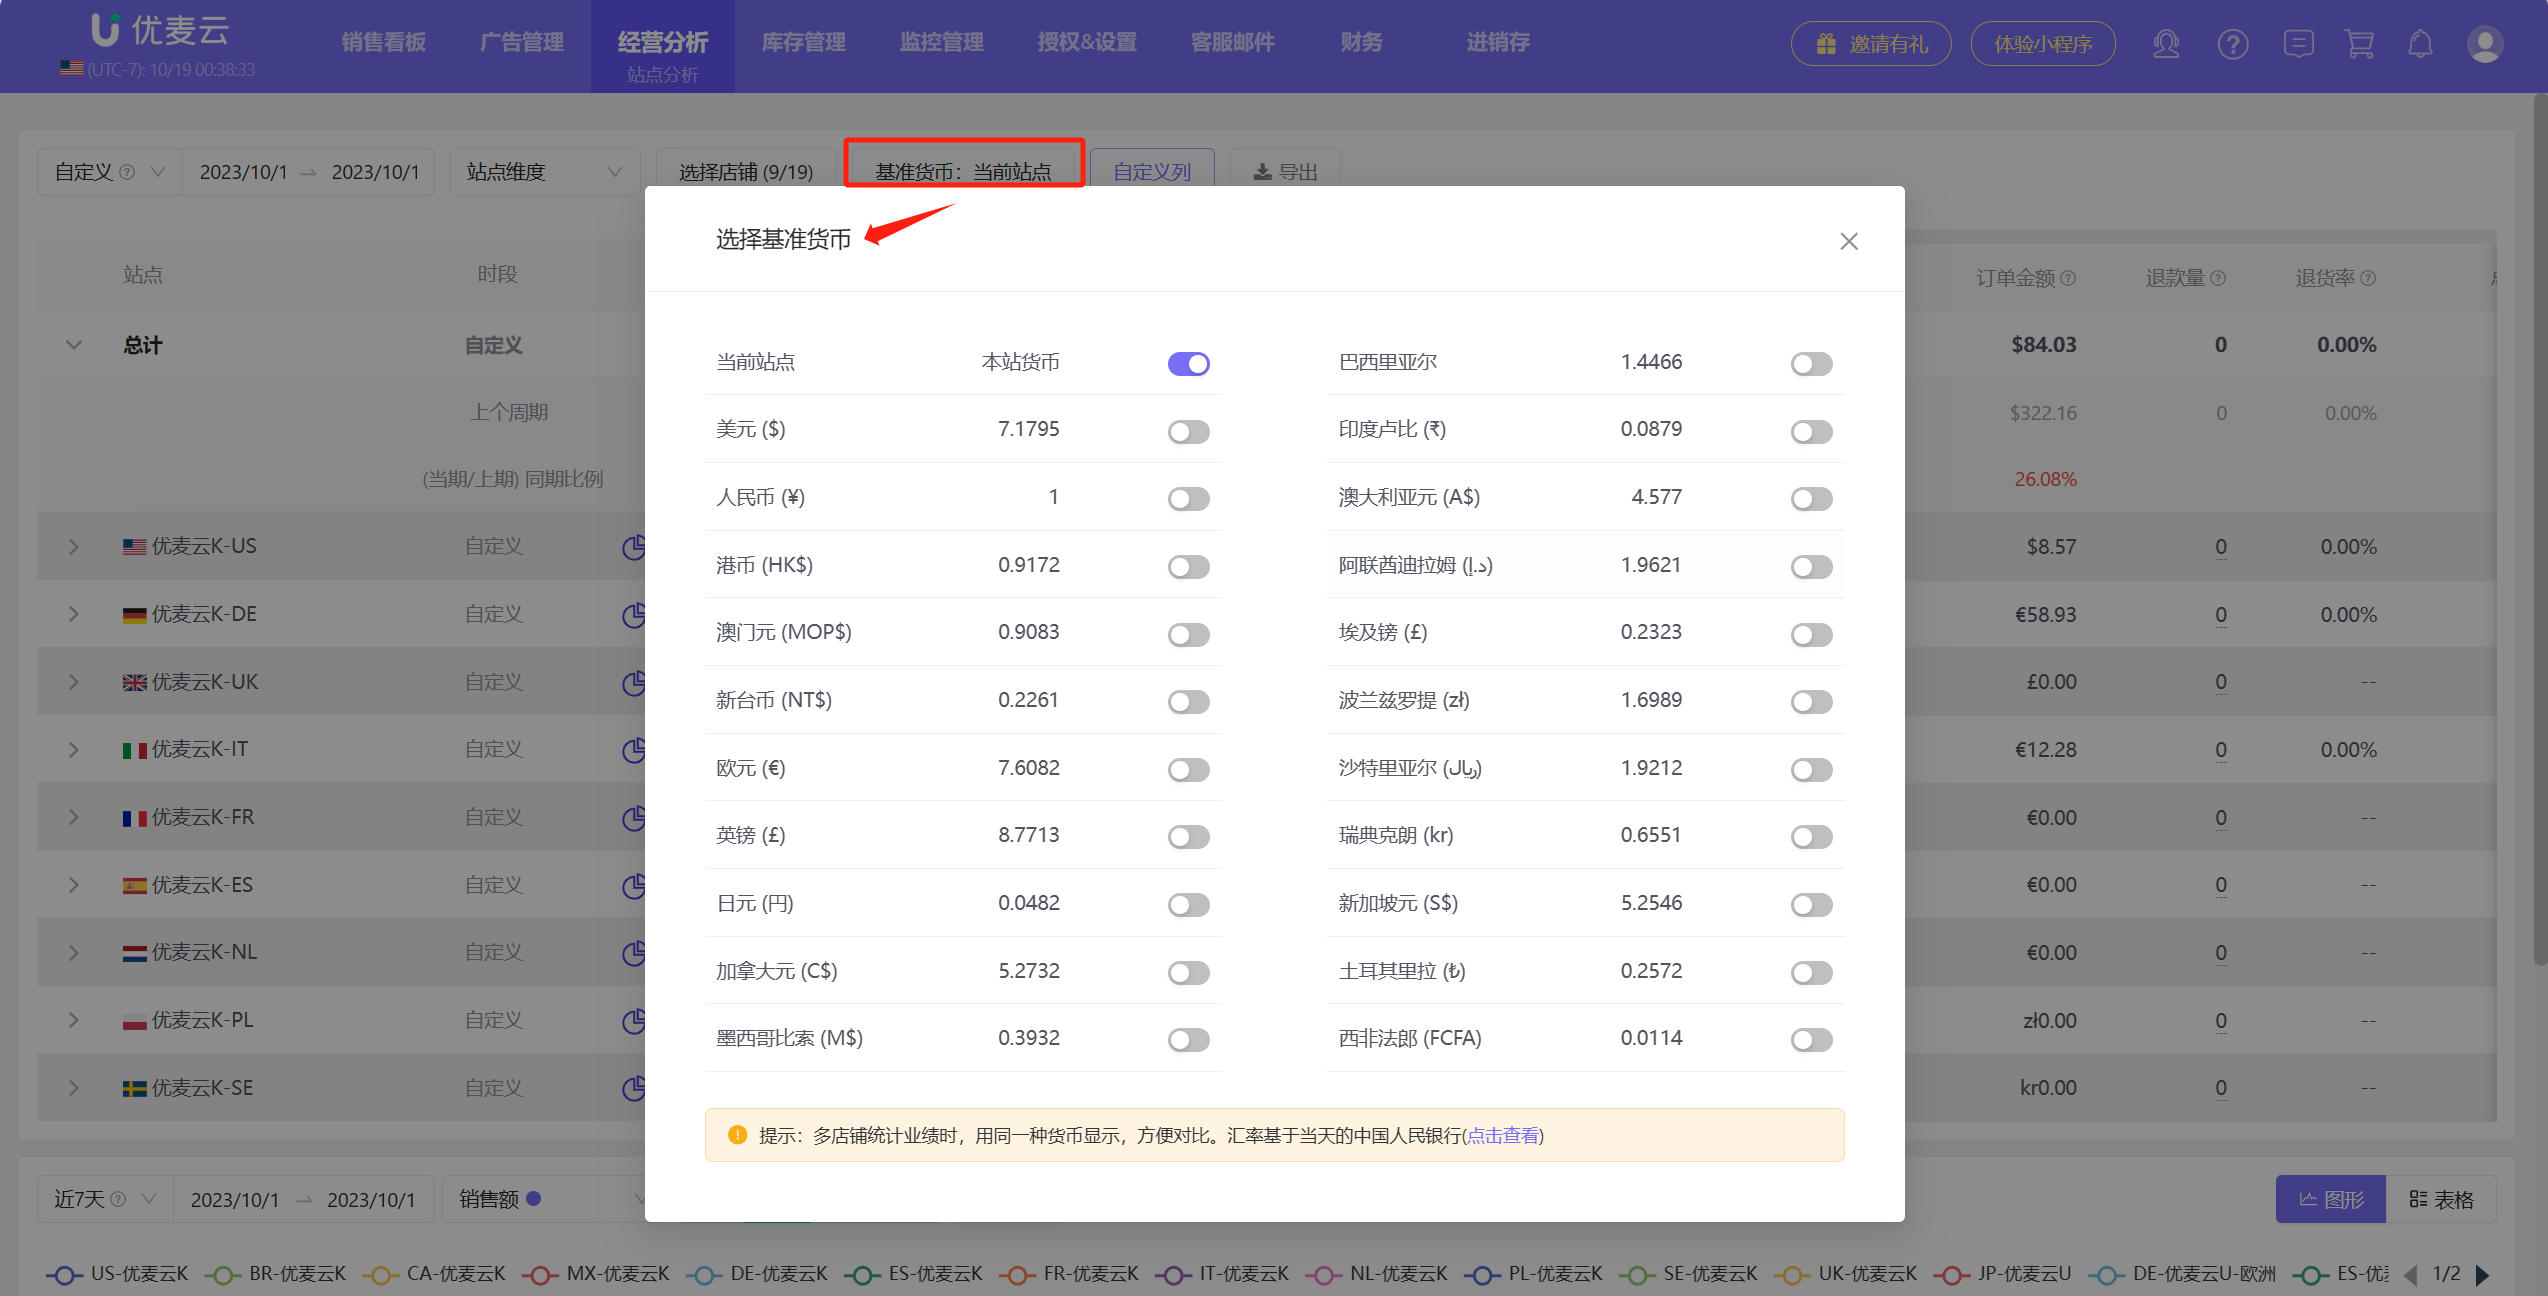
③ Filter Base Currency
You can choose to display data for all marketplaces in the same currency, which is convenient for comparing the performance of different marketplaces.
 +
+
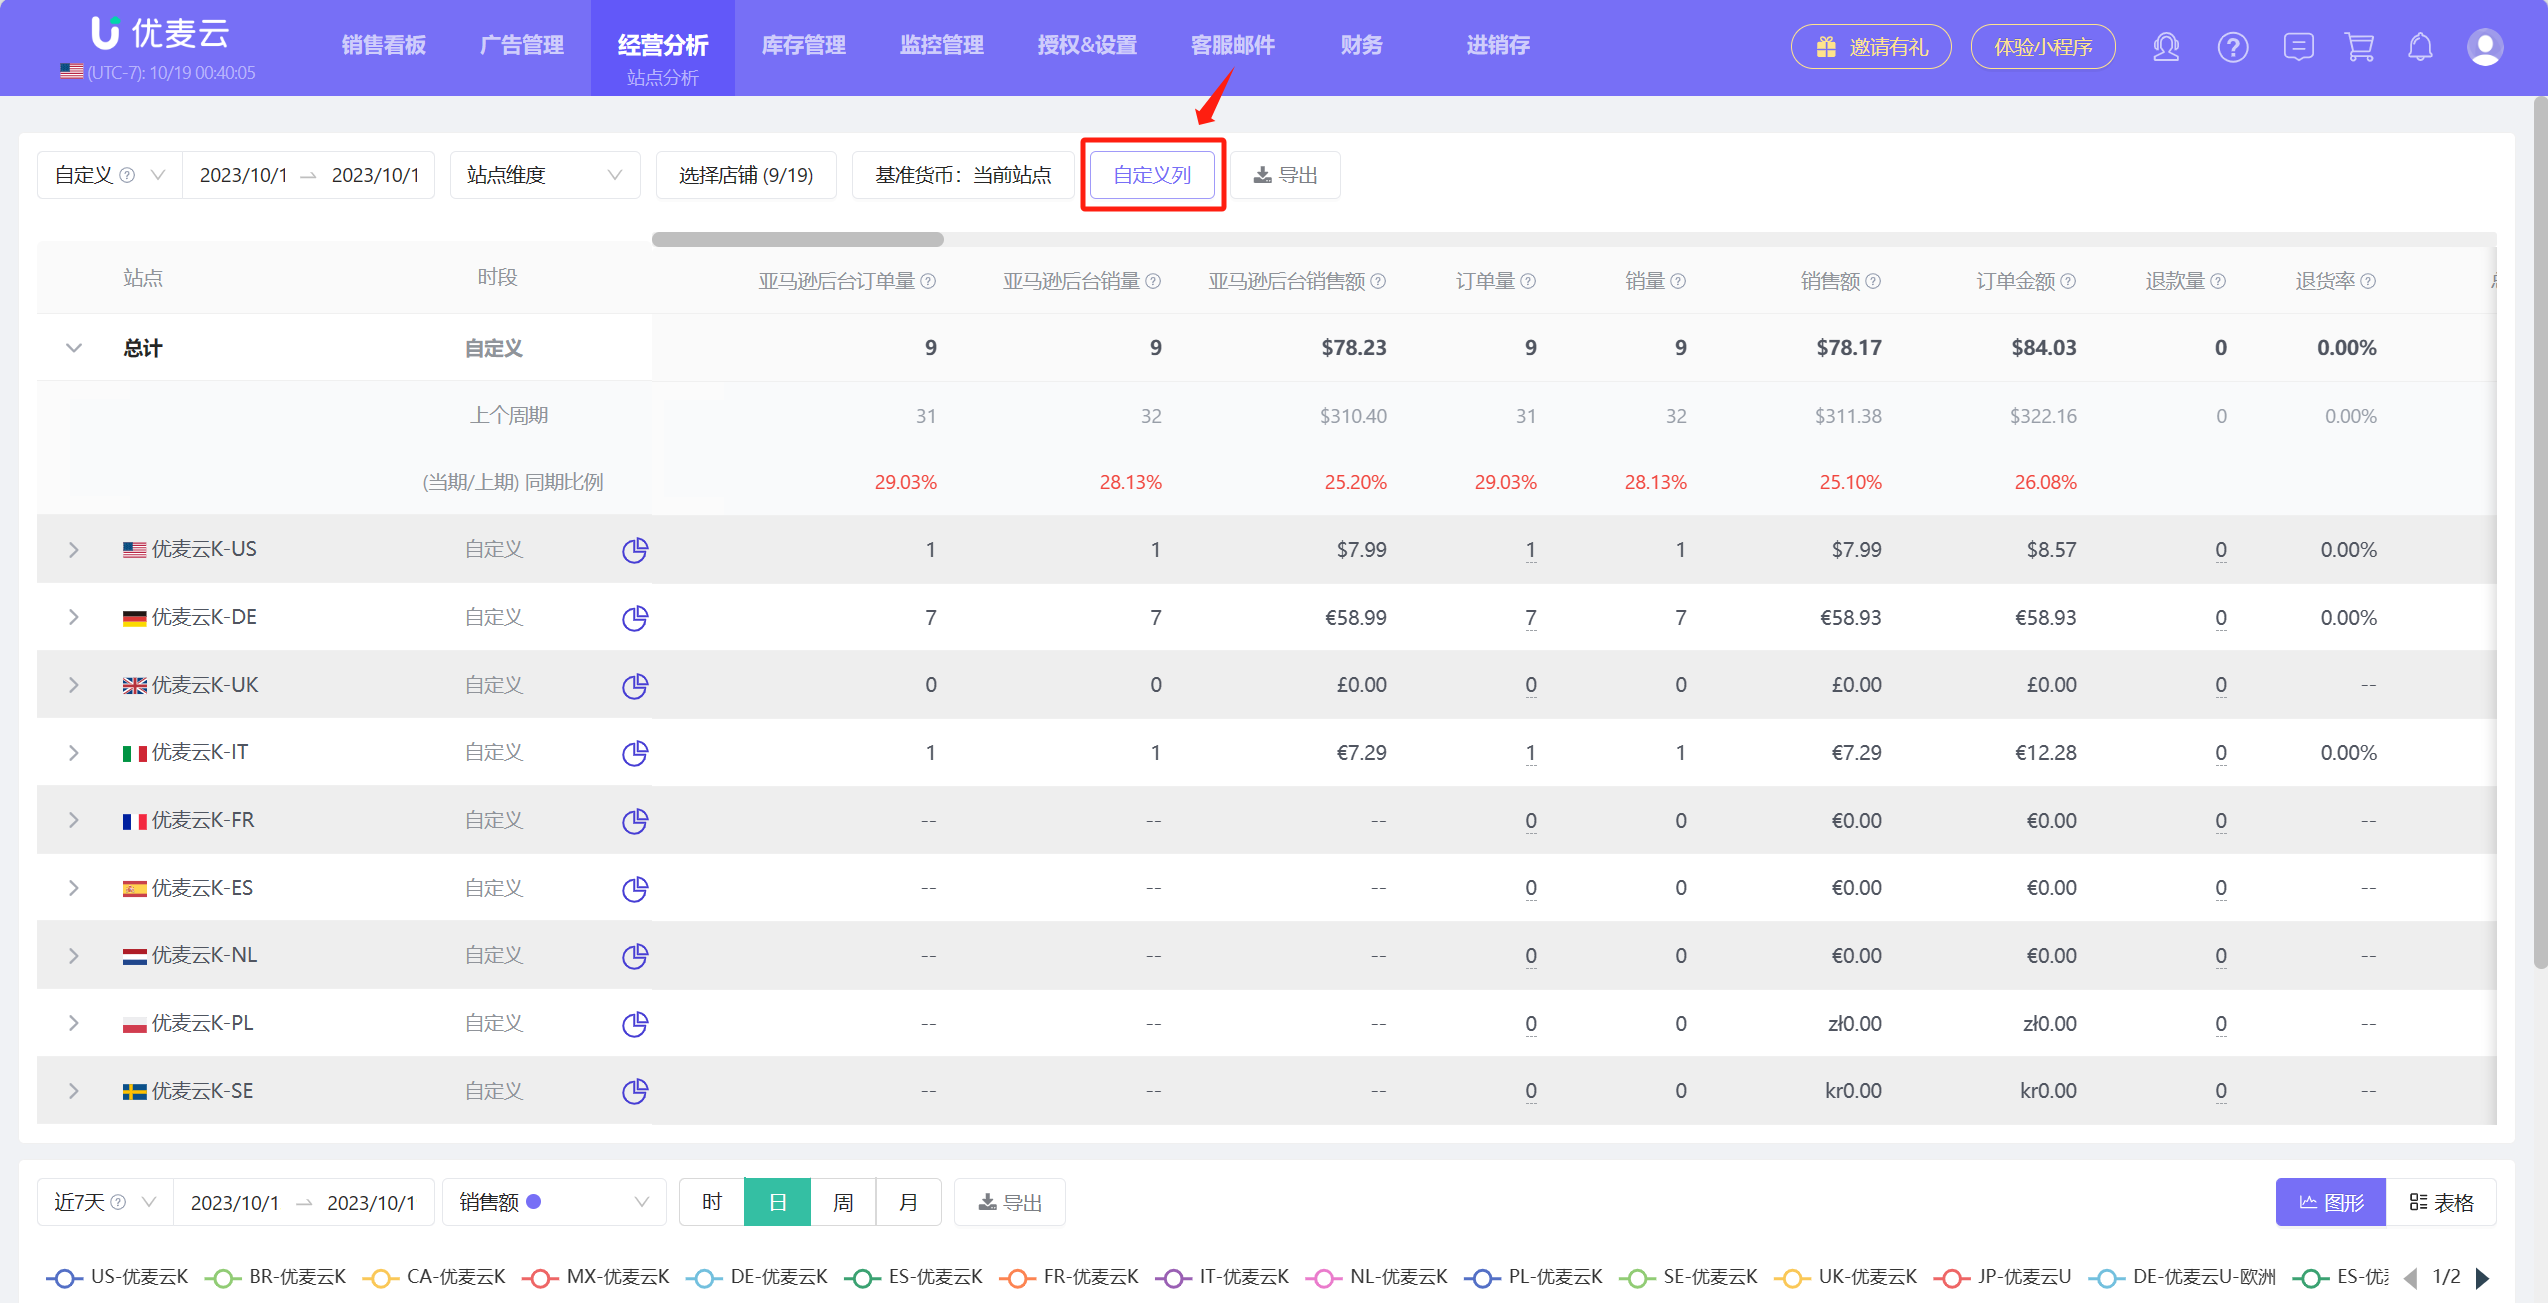
④ Customize Column Data
You can customize the order of displayed metrics (Tip: Metrics can be manually dragged to customize sorting), or select all or deselect all metrics to display, providing a more convenient data display for analysis.
 +
+
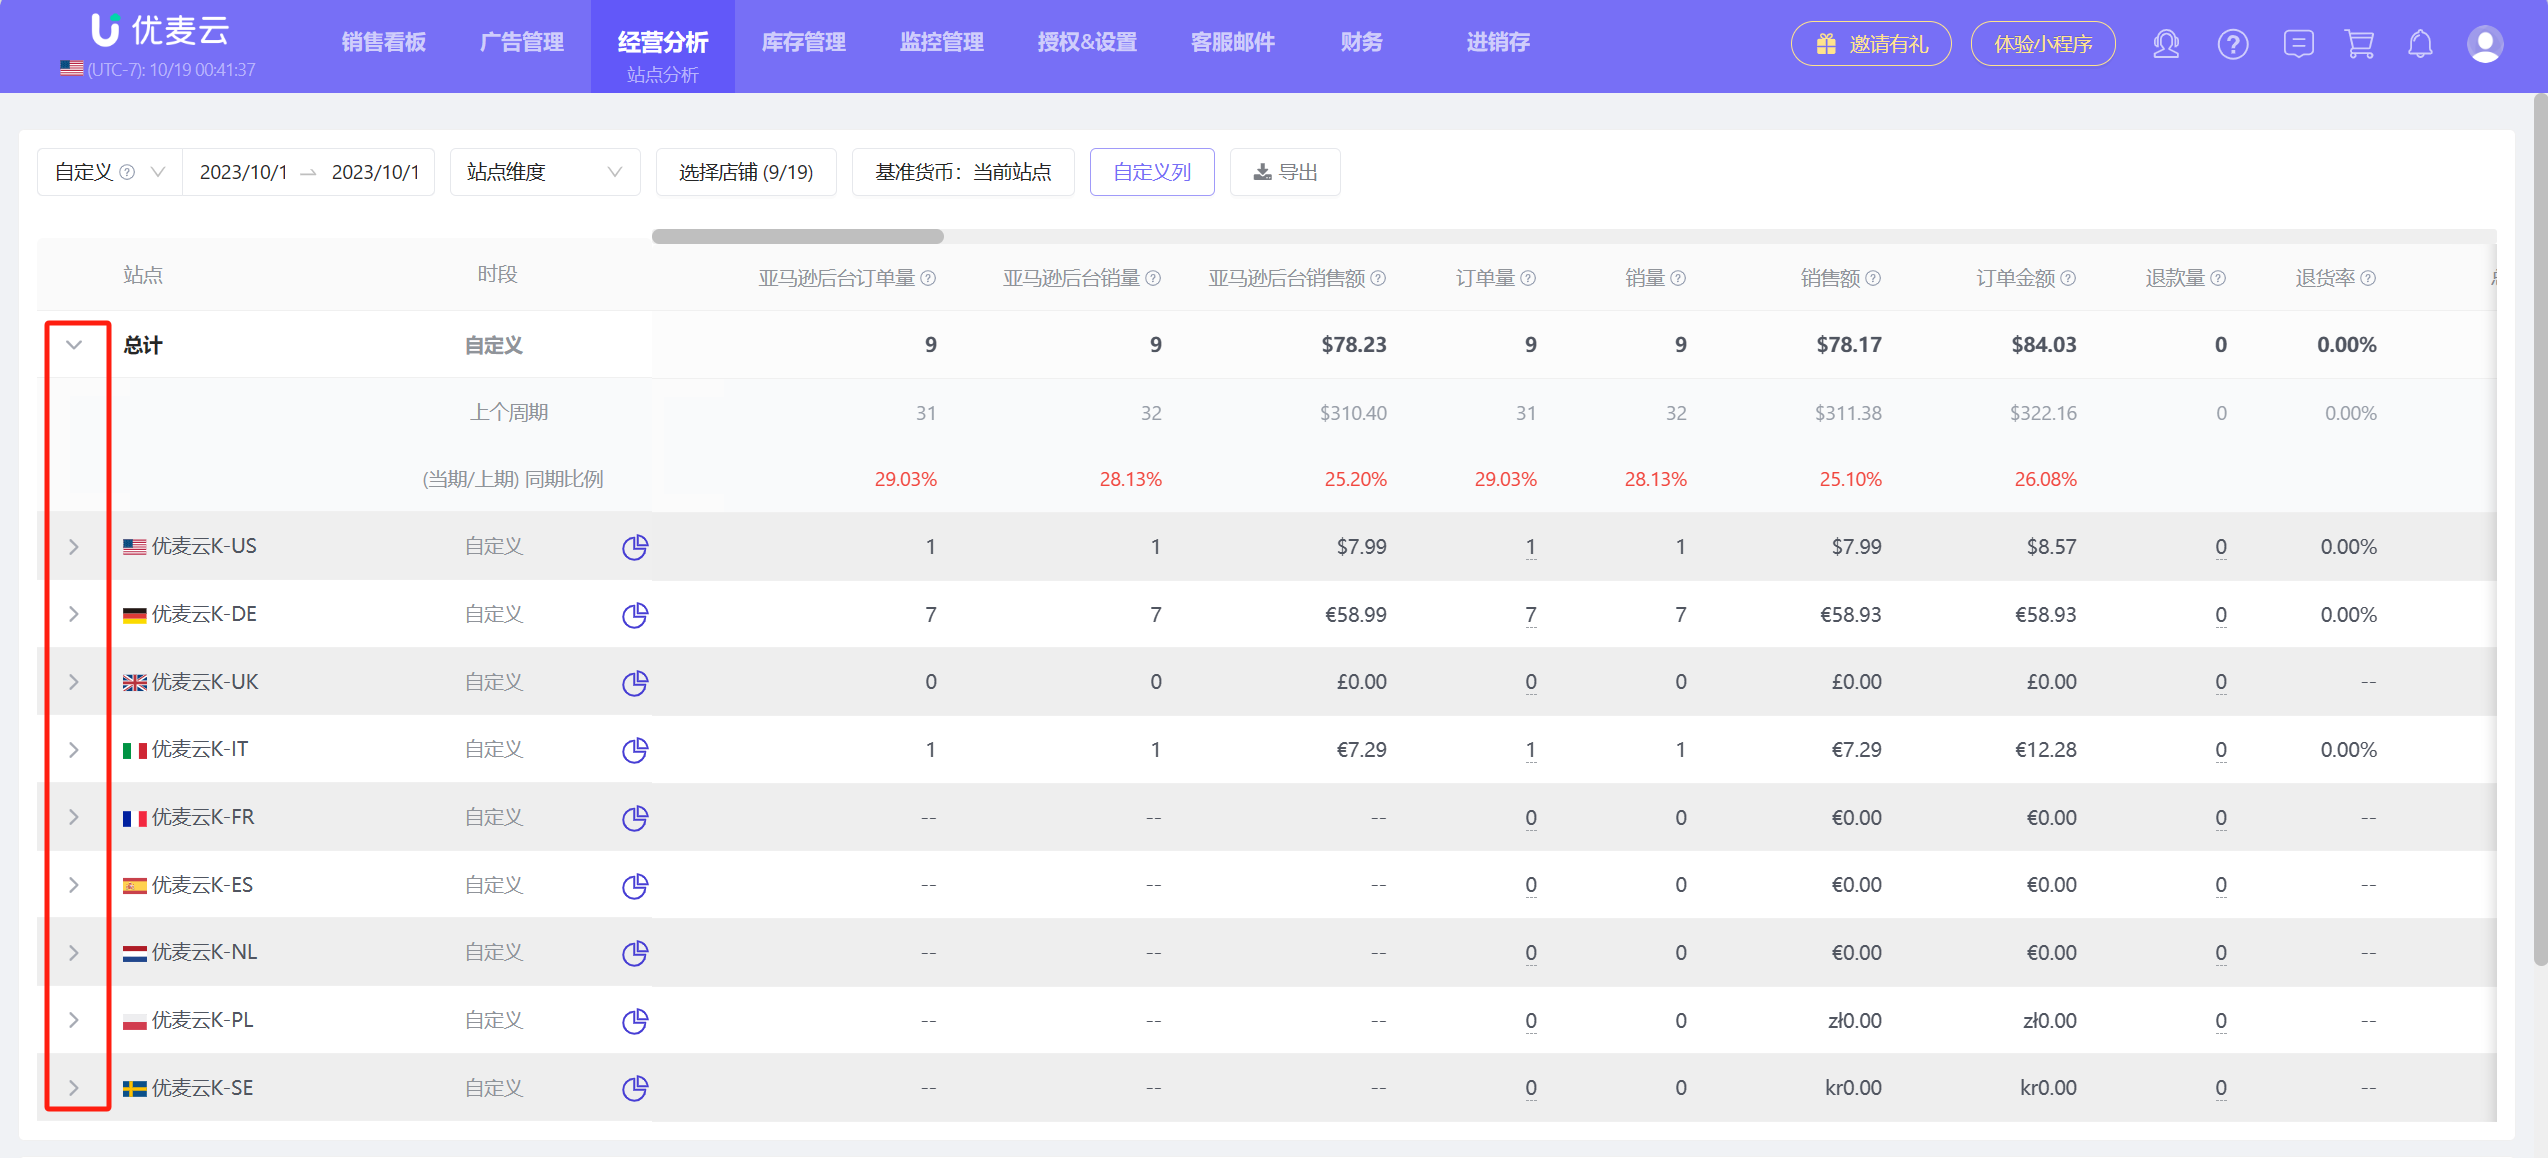
⑤ ">" Small Icon
Click the ">" small icon to compare and analyze data for the same period.
 +
+
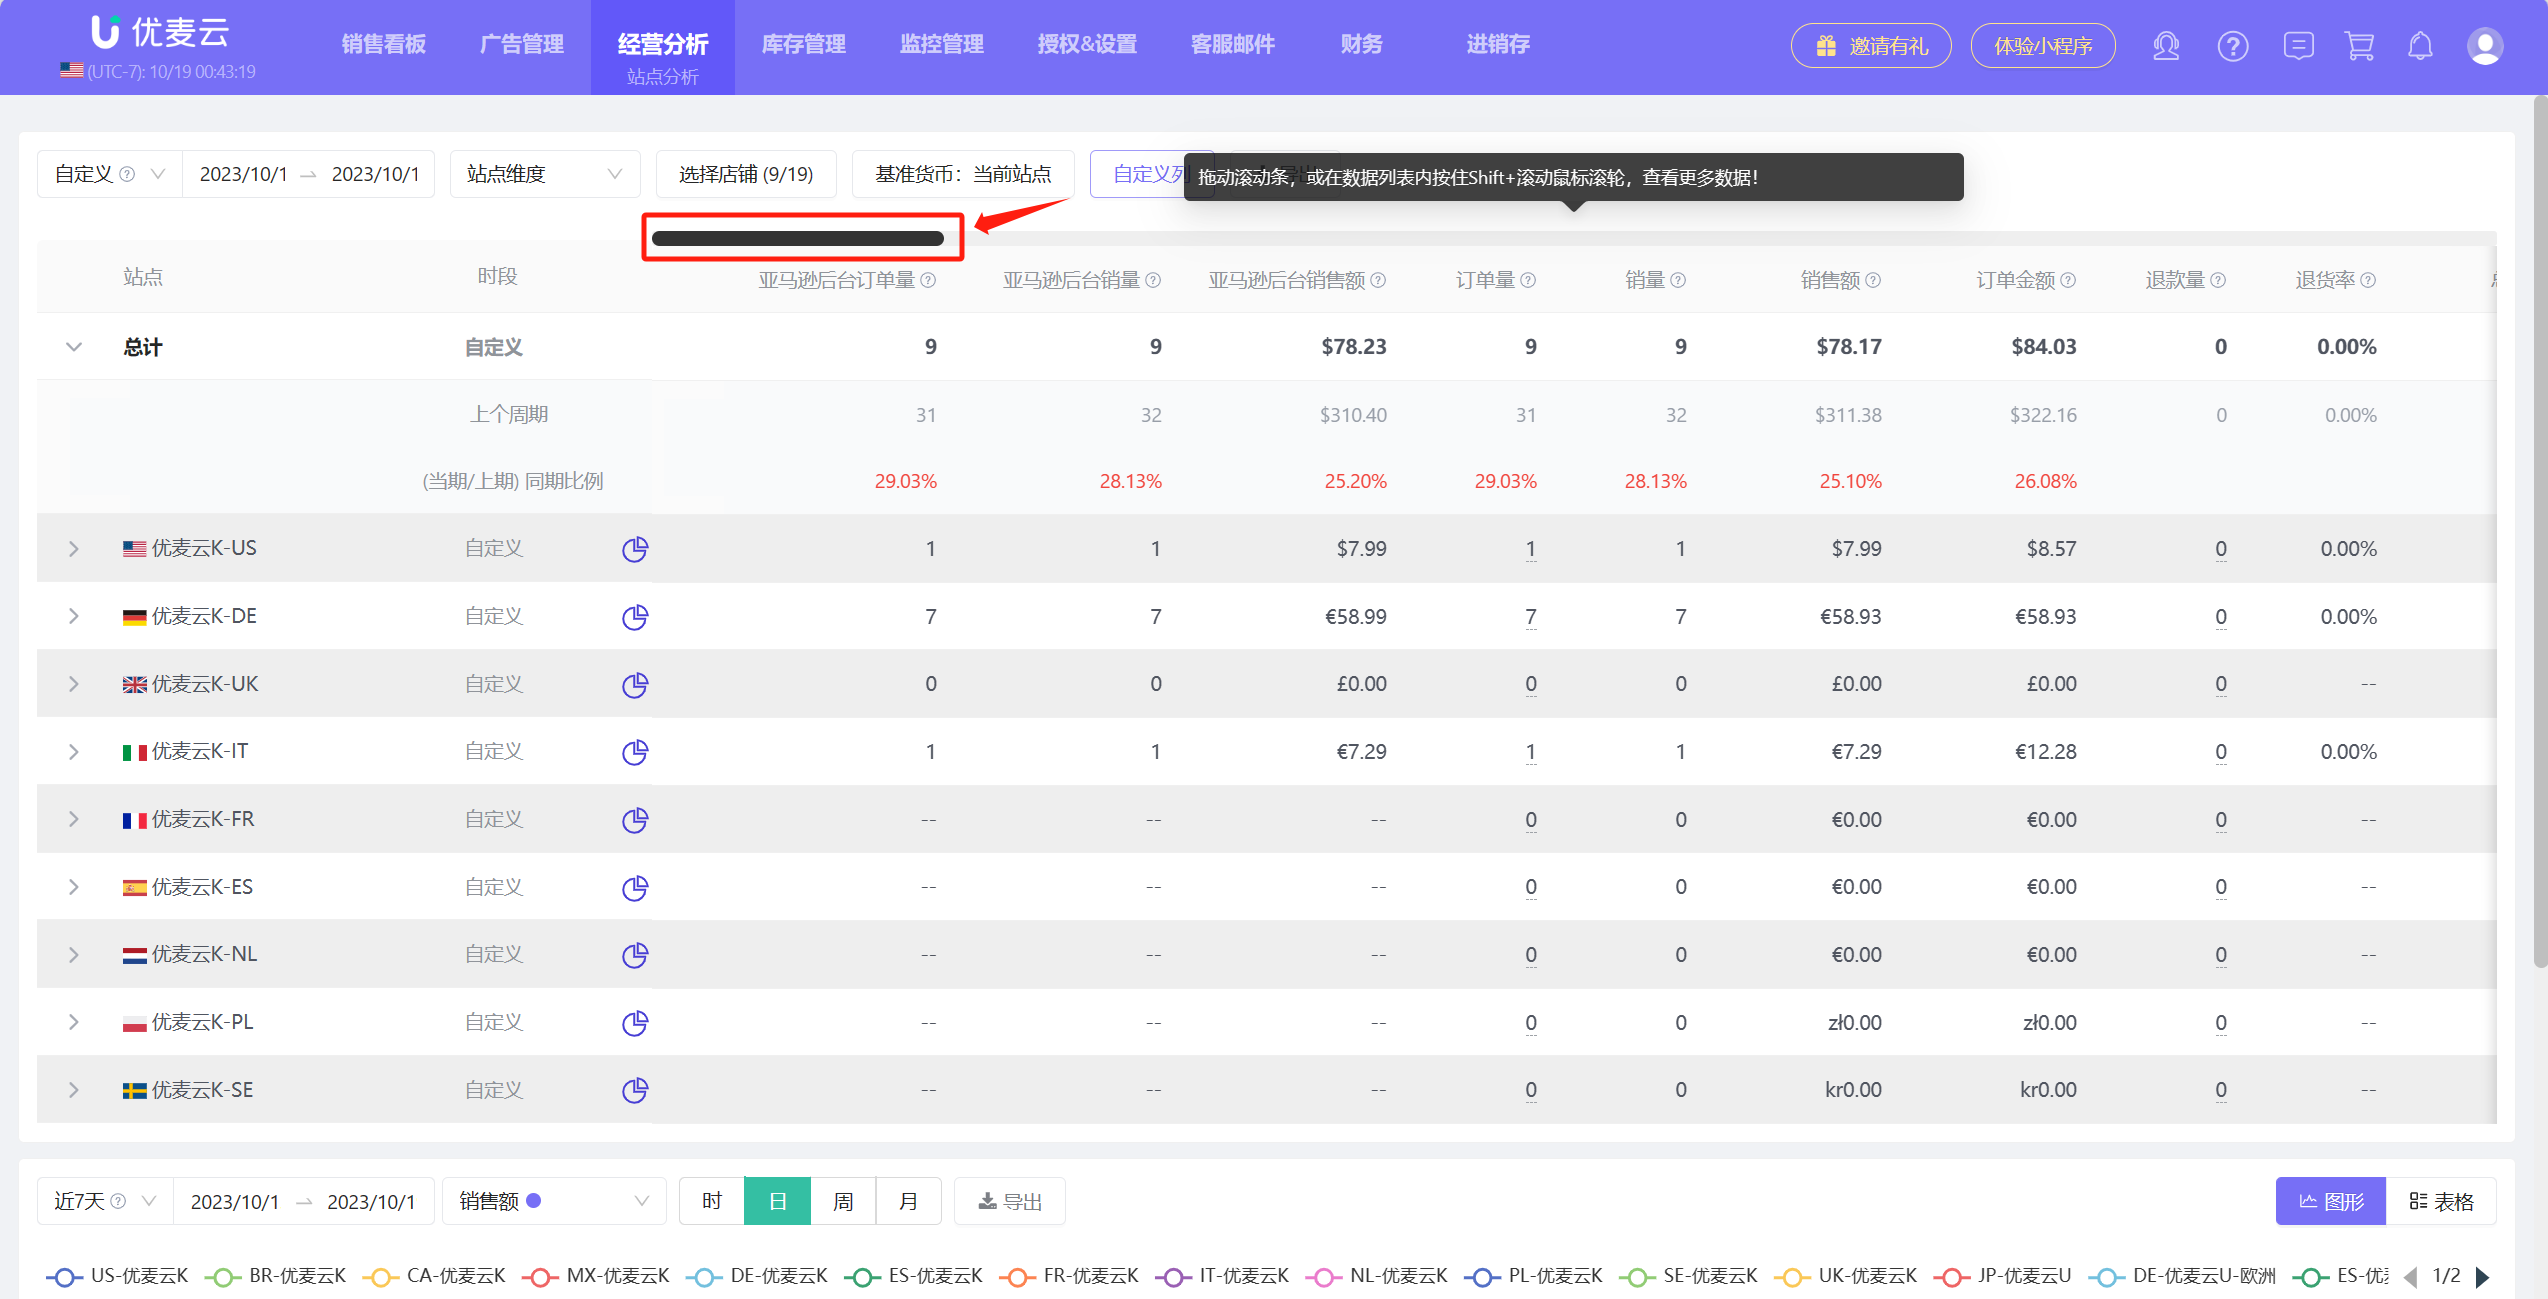
⑥ Conveniently View All Metrics
Drag the scroll bar, or hold down Shift + scroll the mouse wheel in the data list to view all metric data.
 +
+
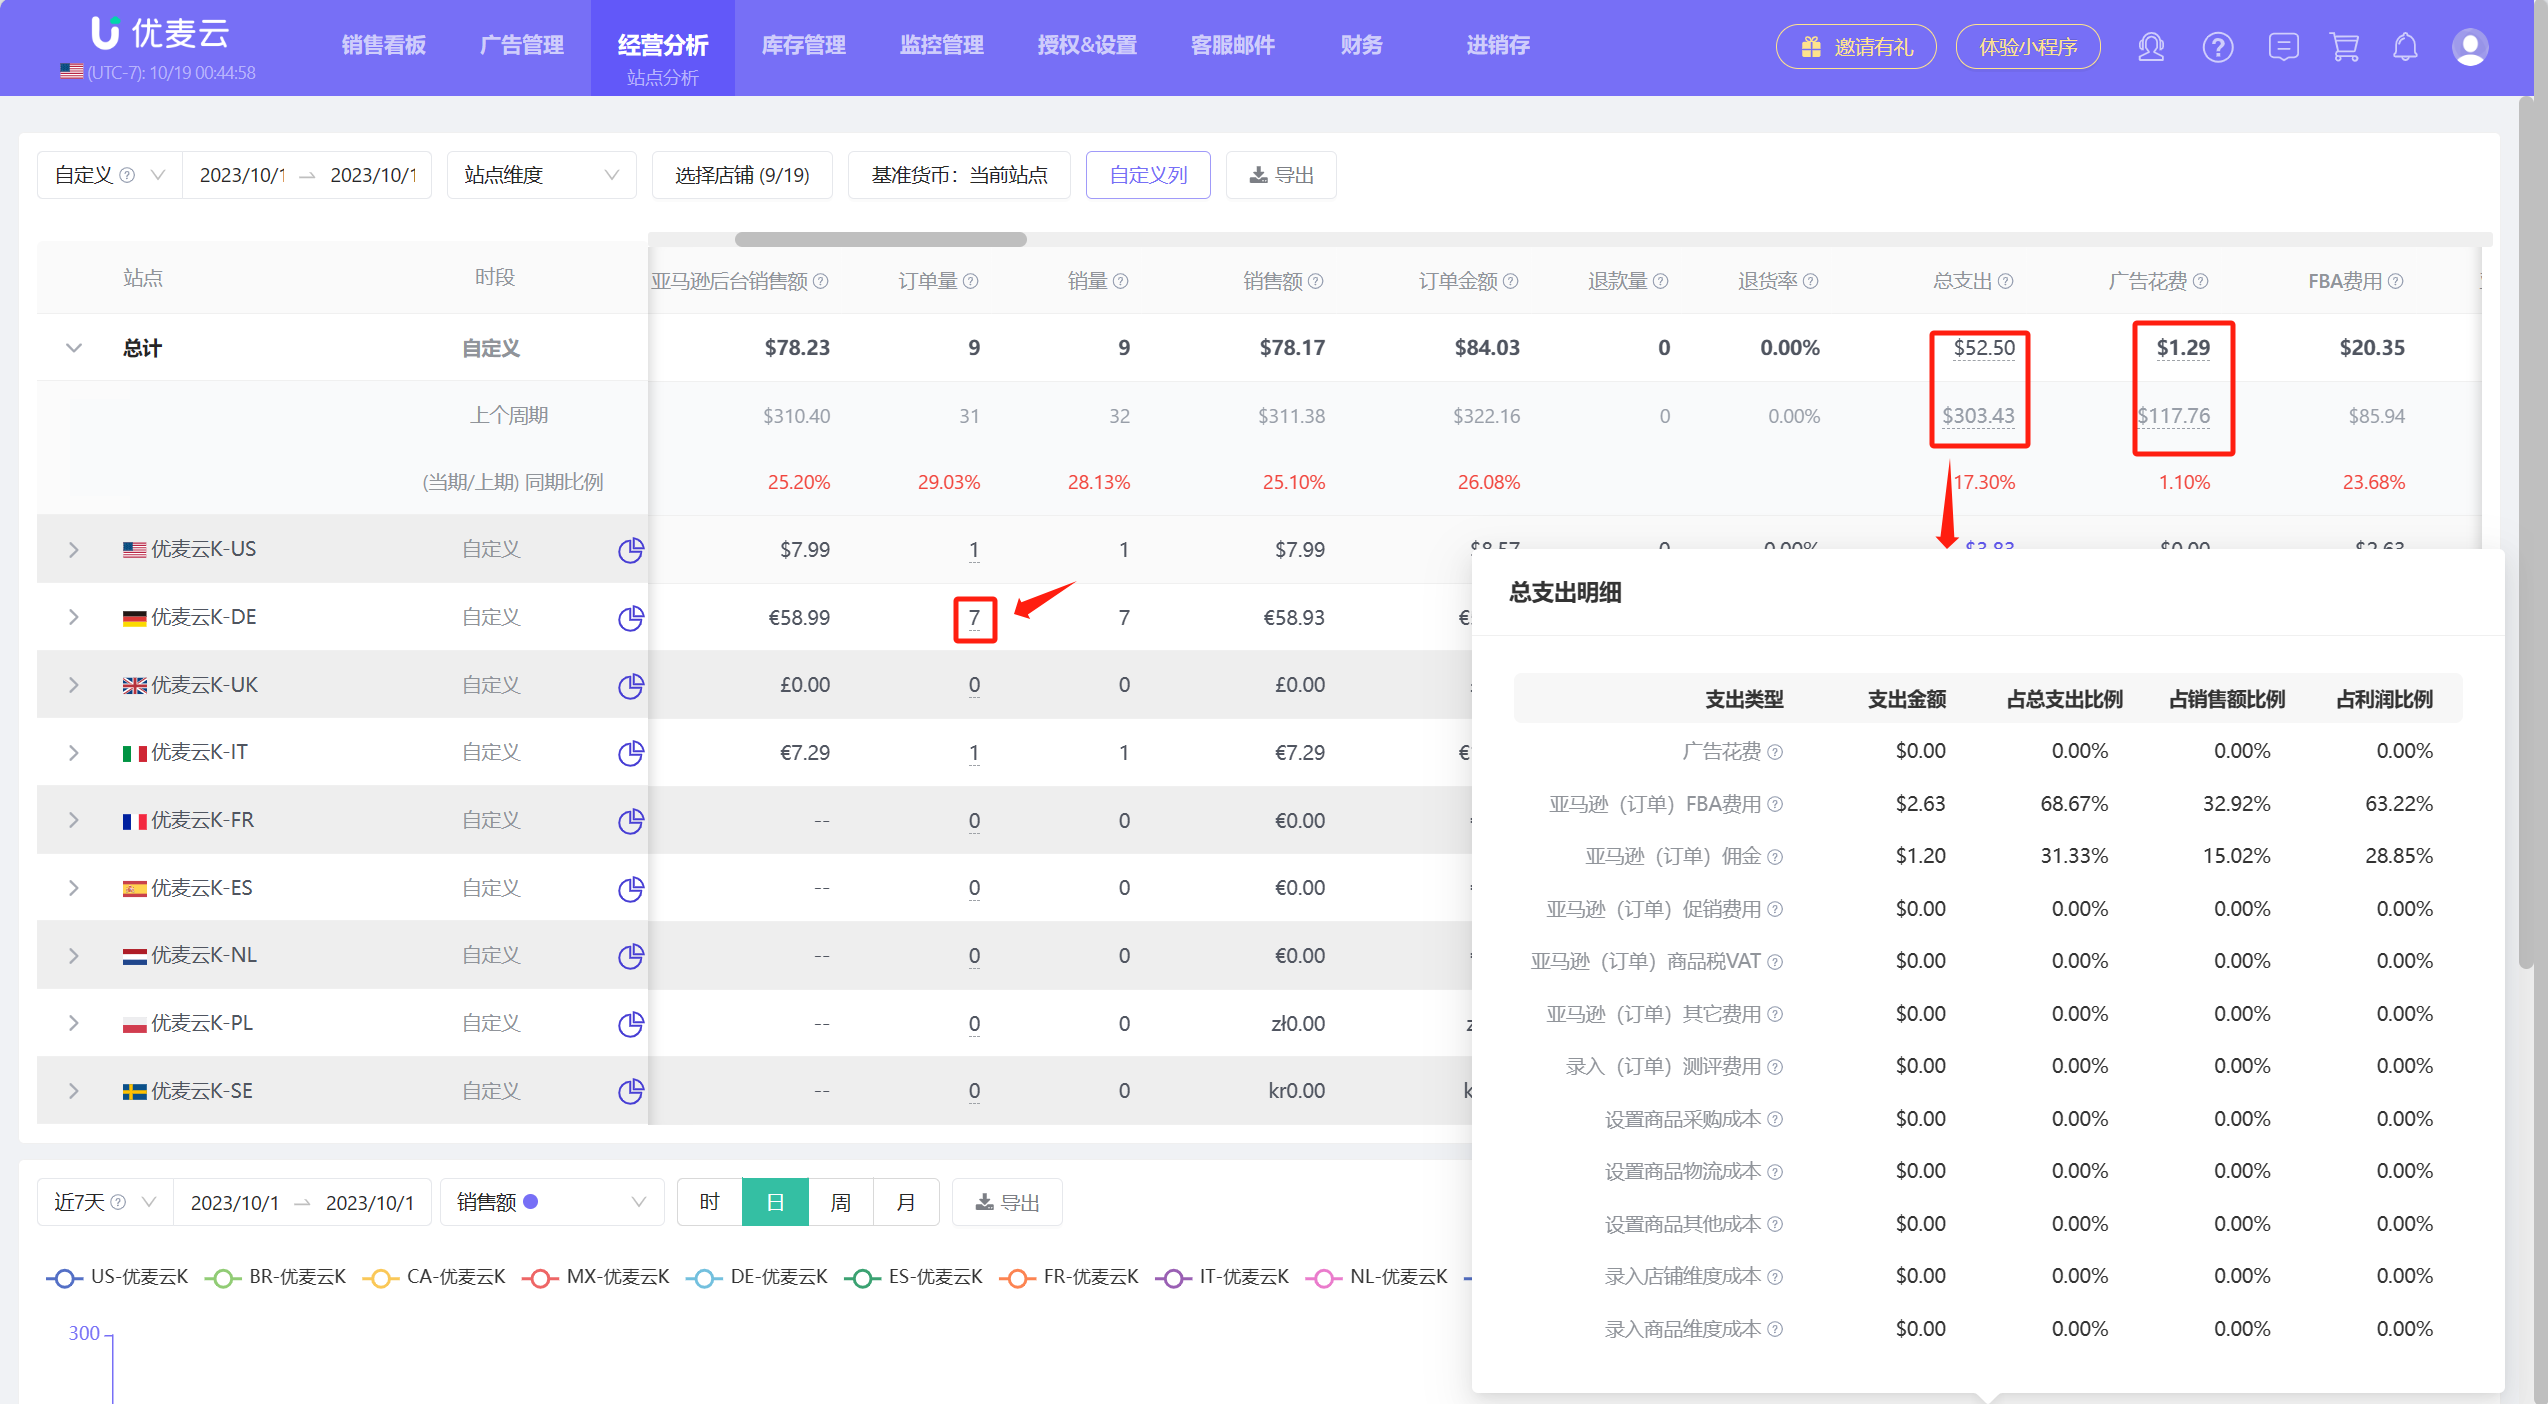
⑦ View Detailed Metric Data
In SellerSpace, all underlined values can be hovered over to view details, or clicked to jump to view details.
For example:
Click the Order Volume/Units Sold number to jump to view order details.
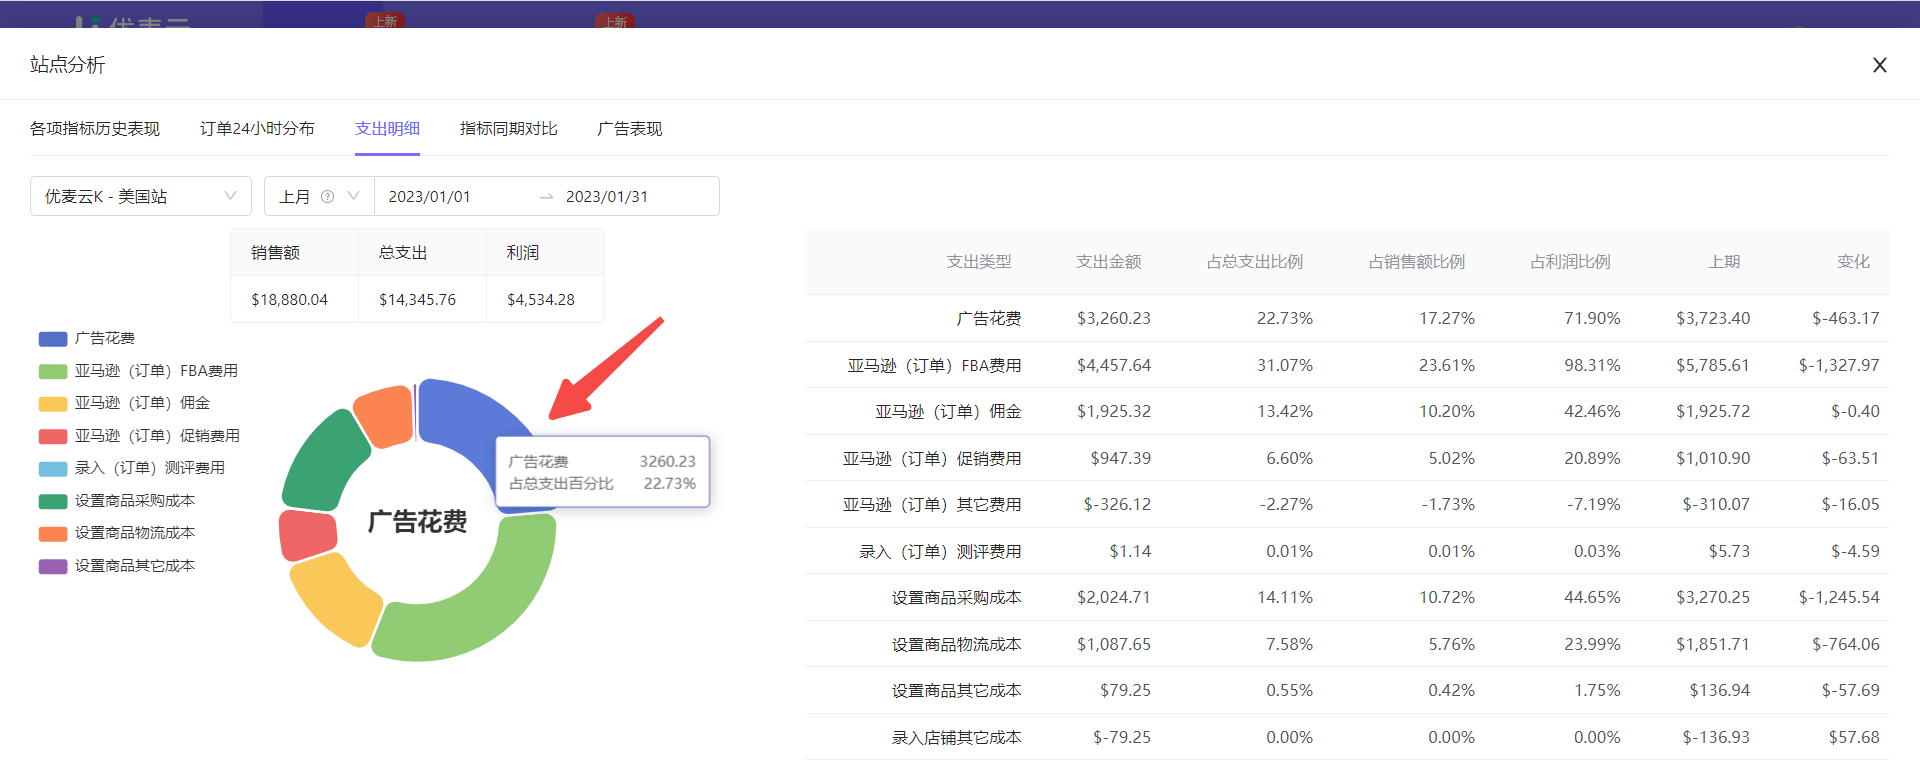
Hover the mouse over the total expense amount to view expense details, including: Expense Type, Expense Amount, Proportion of Different Types to Total Expenses, Proportion to Sales Revenue, and Proportion to Profit.
By analyzing the expense ratio, we can identify which expenses are excessive and need to be optimized; which expenses can be further increased to help increase sales, etc.
 +
+
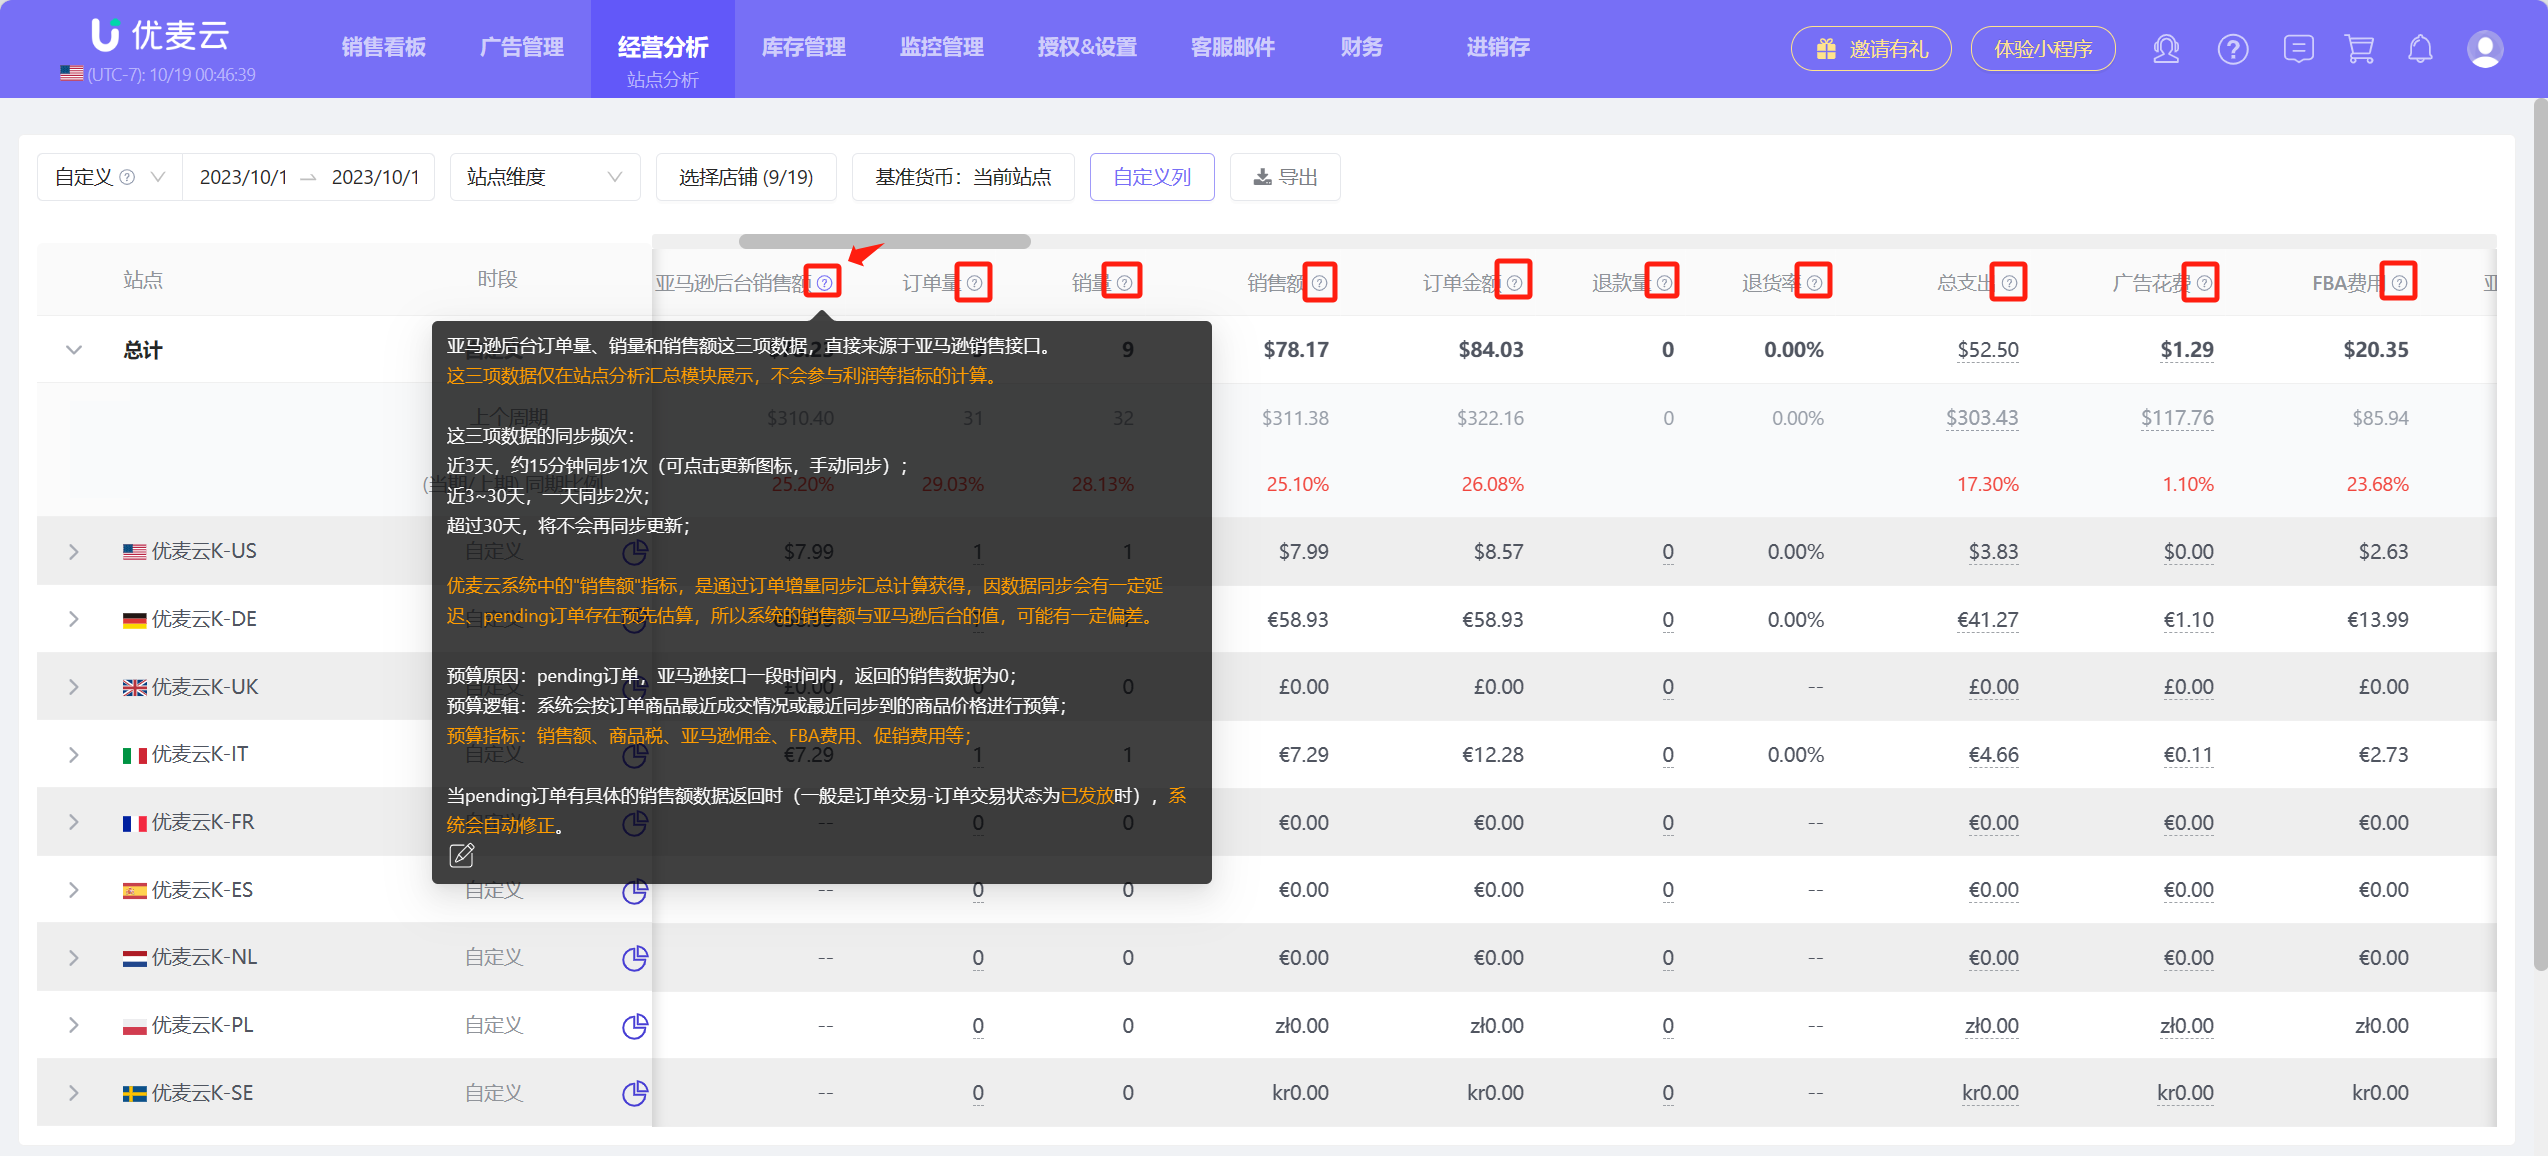
⑧ View Metric Definitions
Hover the mouse over the "question mark" icon next to the metric to view a detailed explanation of the metric.
 +
+
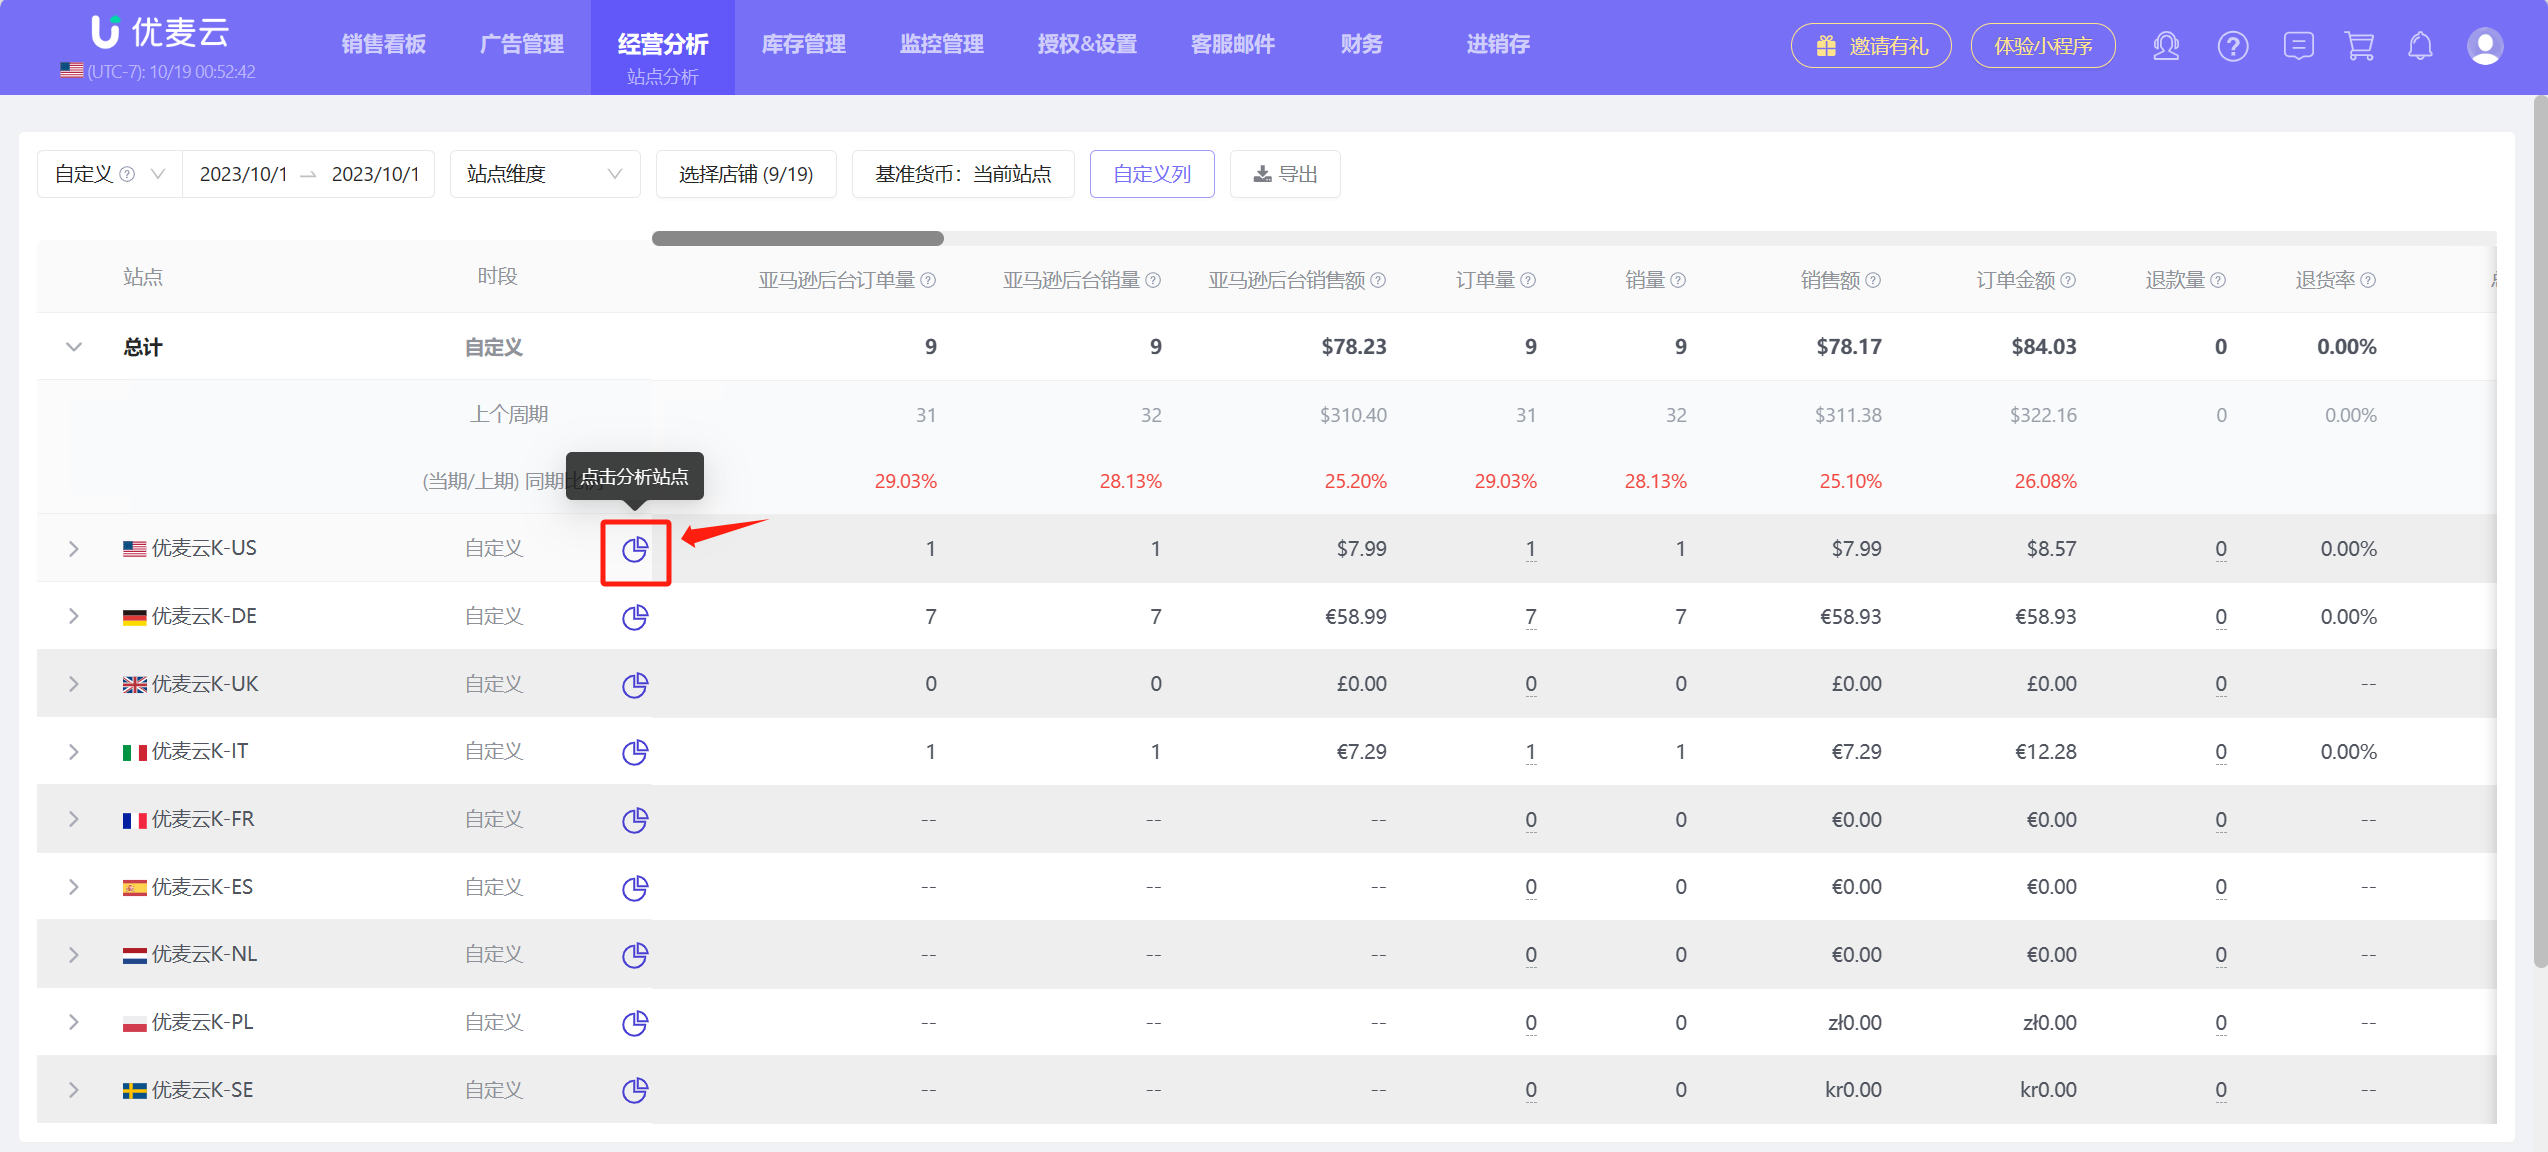
⑨ Marketplace Analysis
If you want to further analyze the data of a single marketplace in detail, we can click the analysis button on the right side of the marketplace name to analyze the operational data of that marketplace separately.
 +
+
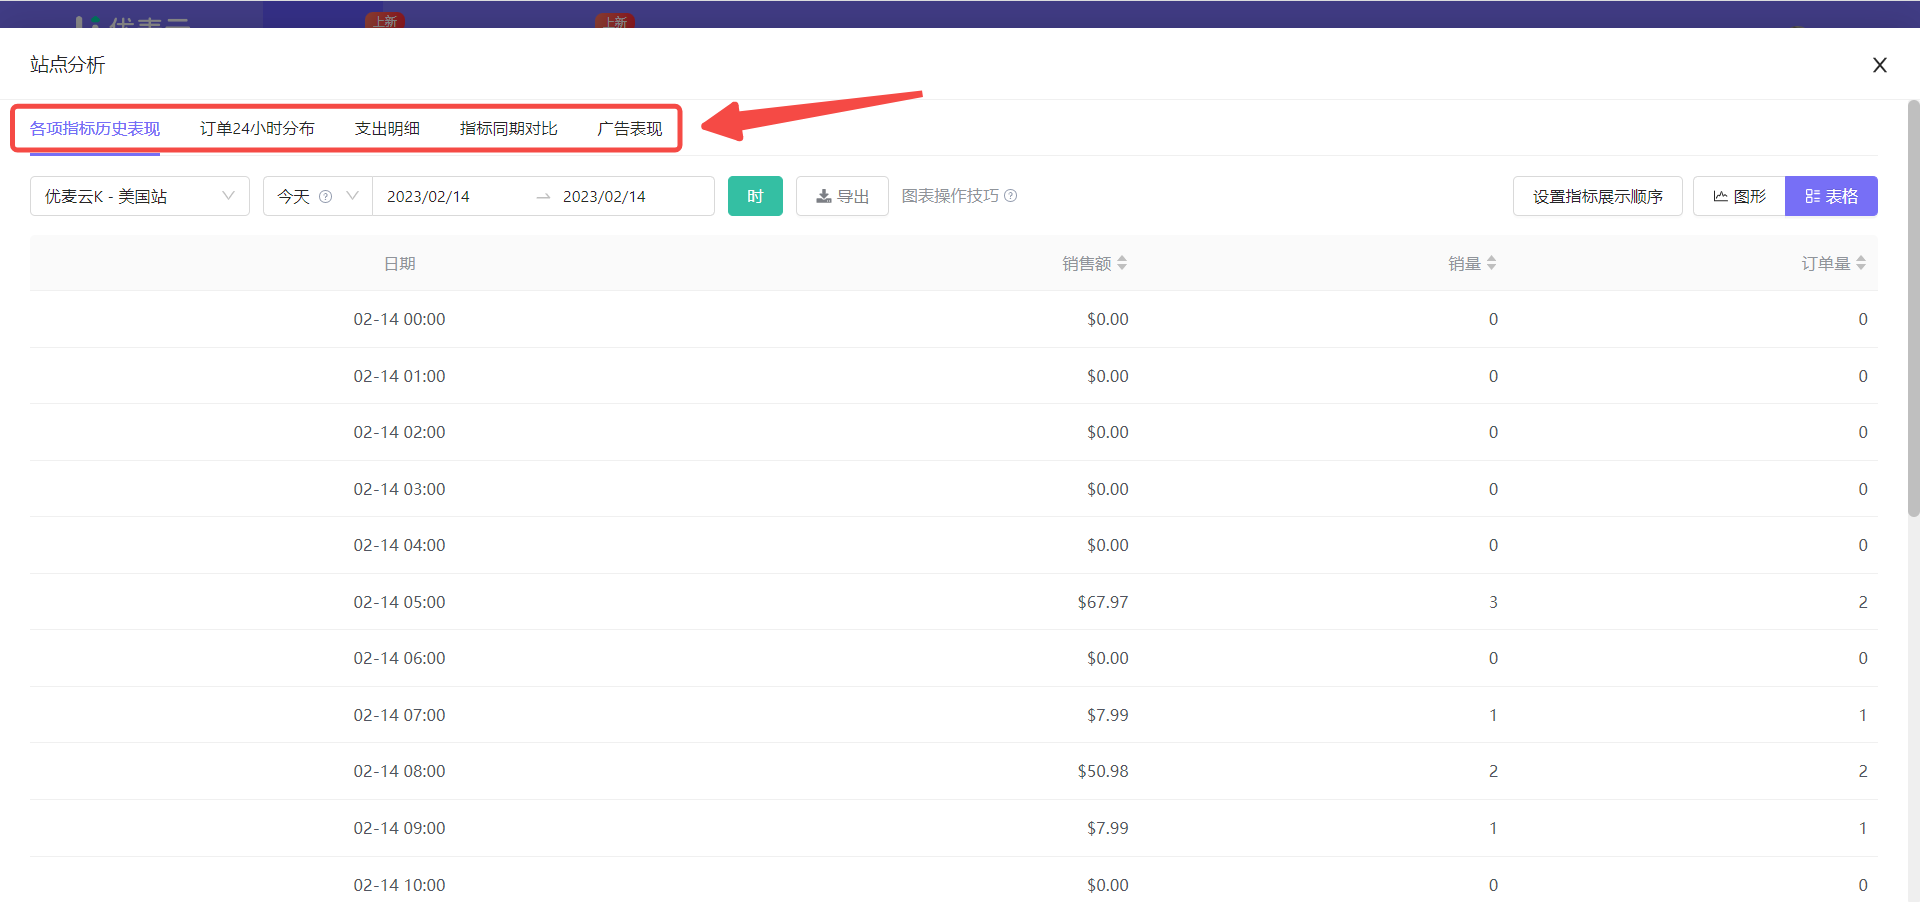
Enter the Marketplace Analysis page,
Marketplace Analysis starts from 5 dimensions, including: Historical Performance of Metrics, 24-Hour Order Distribution, Expense Details, Period-over-Period Metric Comparison, and Advertising Performance, helping us deeply understand the operational status of the marketplace, timely discover abnormal performance, and identify and fill gaps.
 +
+
① Historical Performance of Metrics
The Marketplace dimension has 40 metrics available for analysis, helping us deeply analyze the performance of each metric, identify anomalies from different metrics, or help us track whether the effect of optimization operations meets the standard, so that we can optimize promotion methods in time according to business goals.
The operation method for historical performance data of metrics is as follows:
Take analyzing the advertising ACOS performance of SellerSpace K - US marketplace last week as an example,
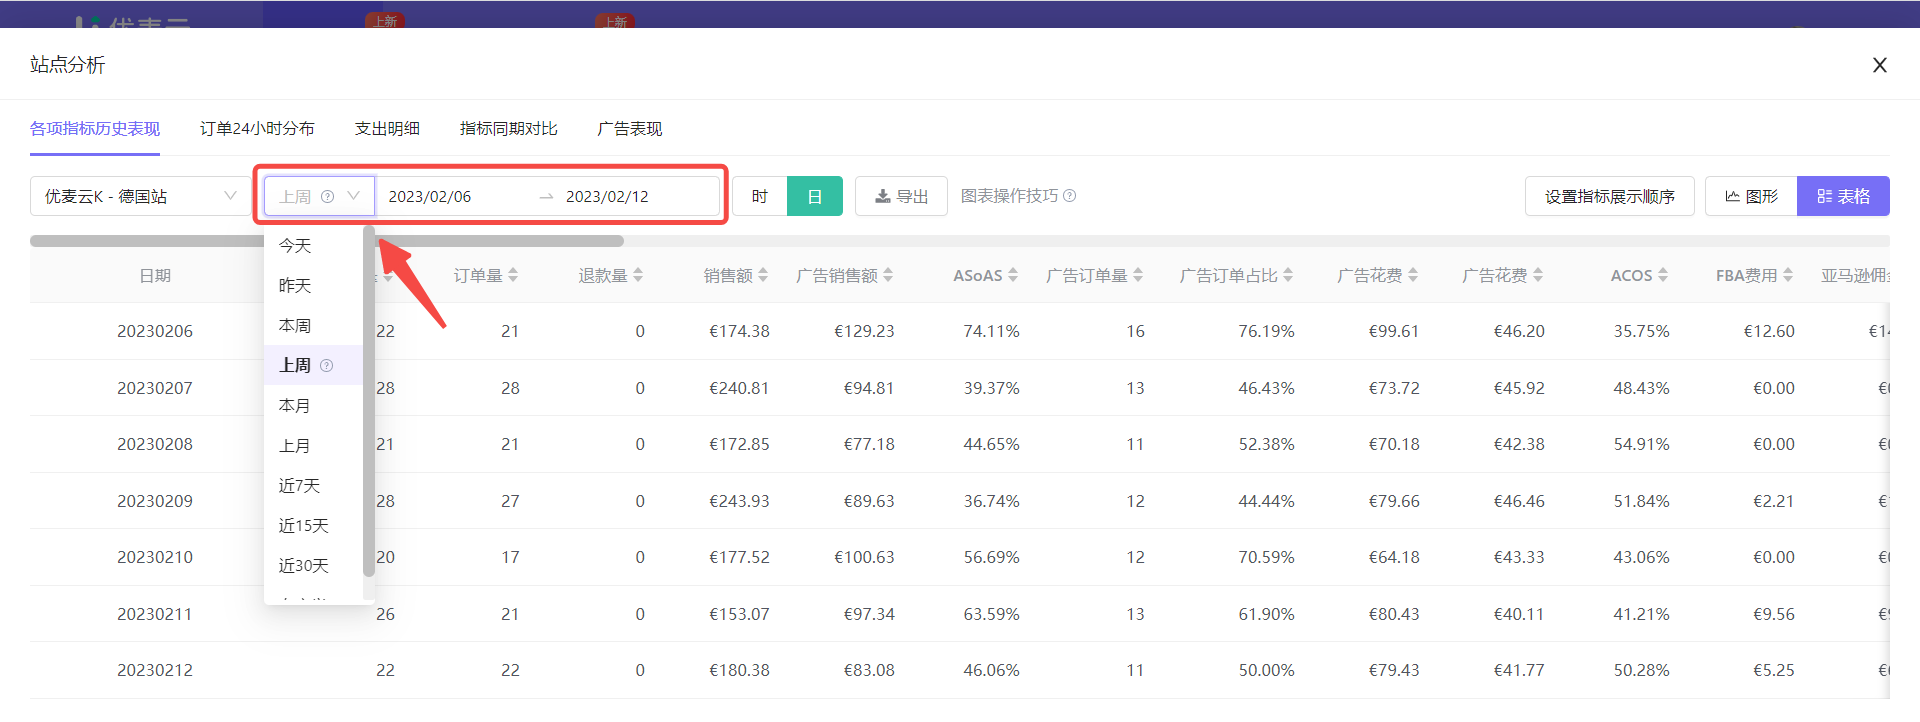
First, set the data time.
Click Time and select the data time as [Last Week].
 +
+
Supplementary explanation:
The data display format will be slightly different depending on the selected time range.
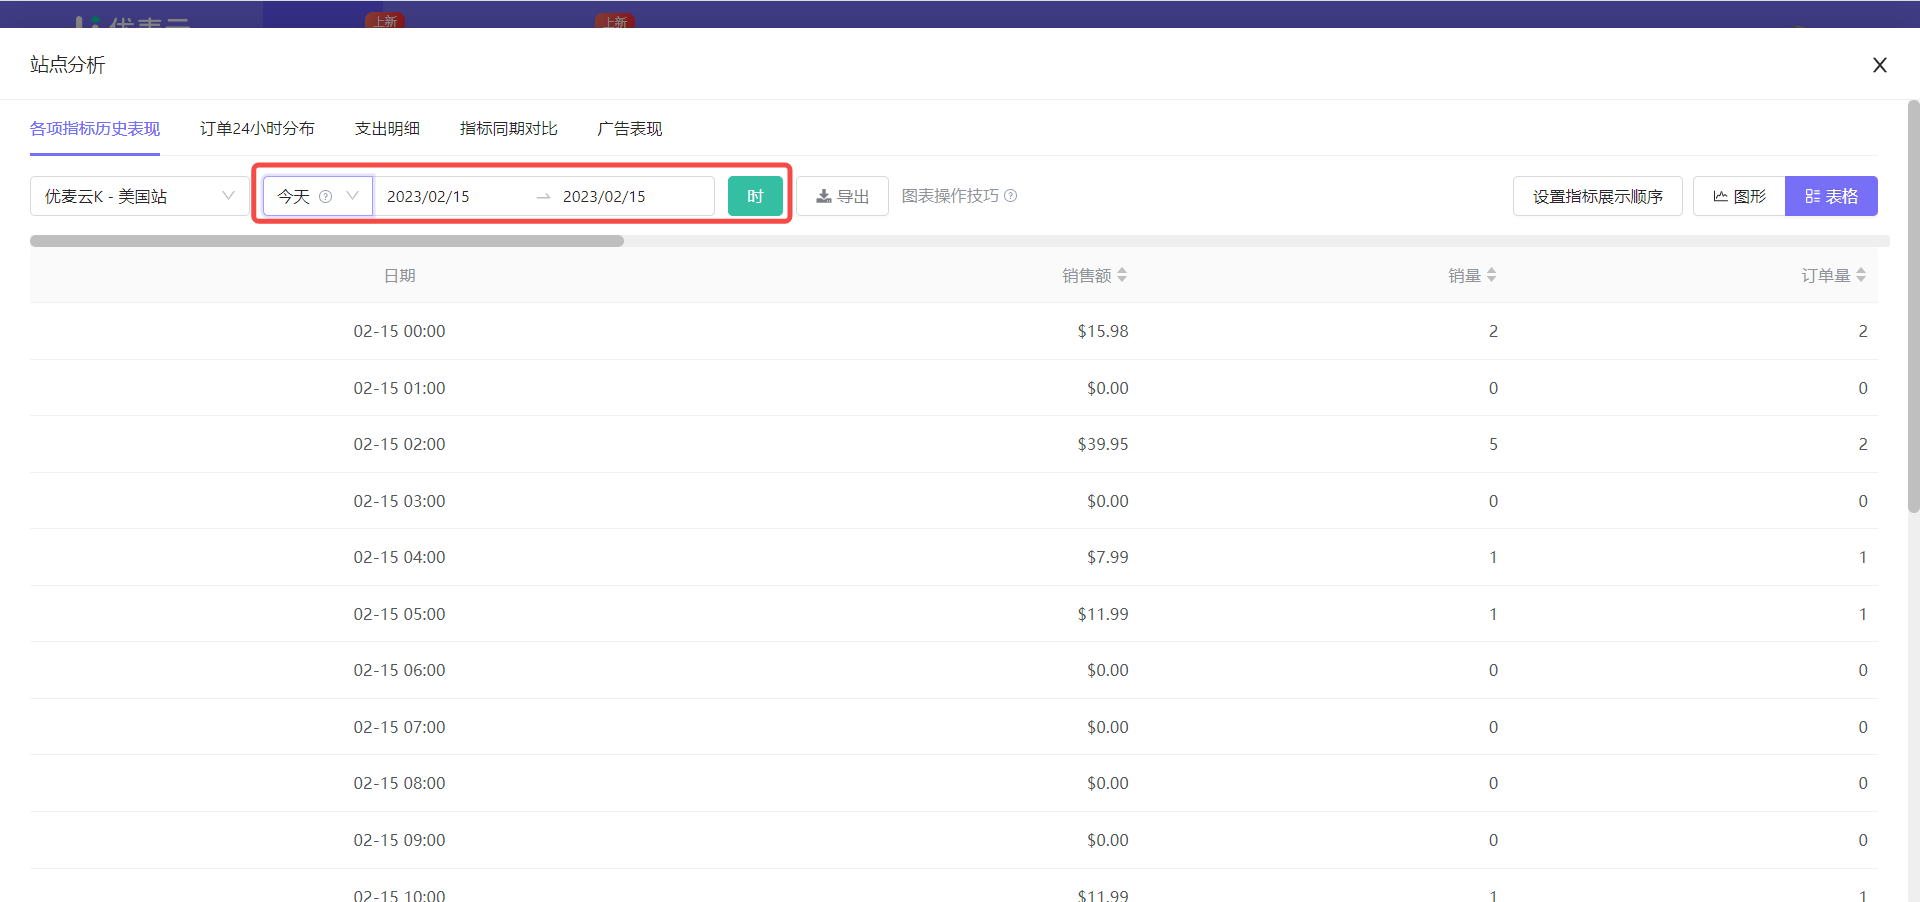
If you select a single day, the metric data will be displayed in the "hour" dimension. Moreover, when we select [Today] or [Yesterday], only the metrics: Sales Revenue, Units Sold, and Order Volume are displayed;
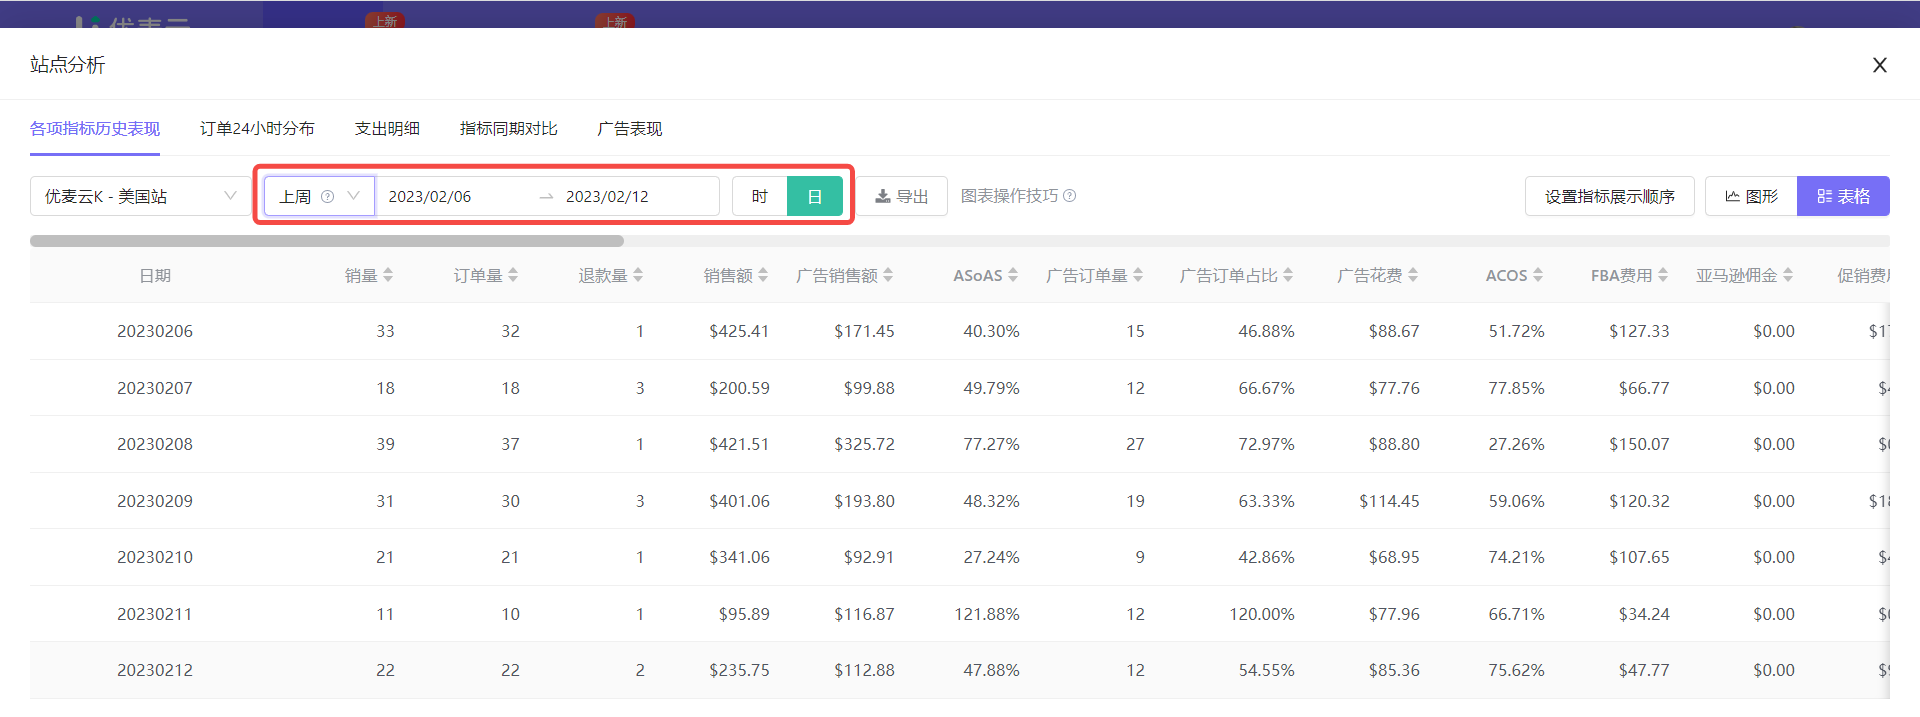
If you select multiple days and within a week, you can choose to display metric data in the "hour" or "day" dimension;
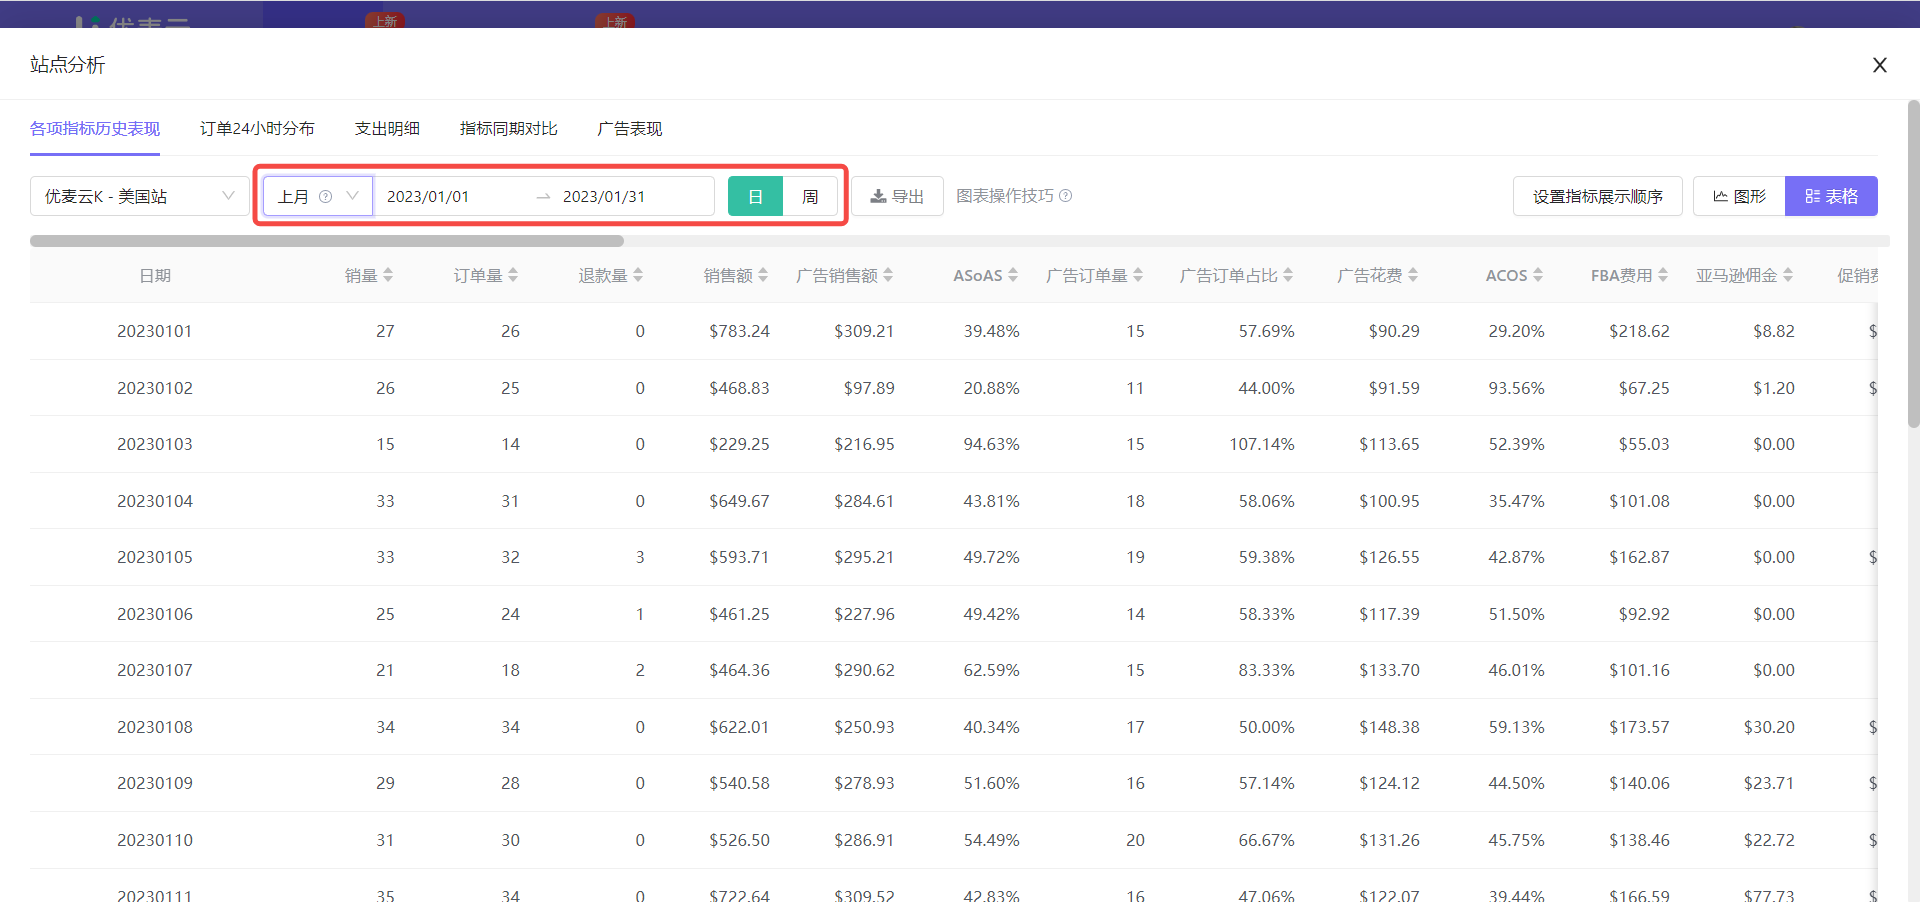
If you select more than a week, you can choose to display metric data in the "day" or "week" dimension.
You can select the corresponding data time range according to your actual analysis situation.
Select a single day, and display data in the "hour" dimension:
 +
+
Select multiple days and within a week, and display data in "hour" or "day":
 +
+
Select more than a week, and display data in "day" or "week":
 +
+
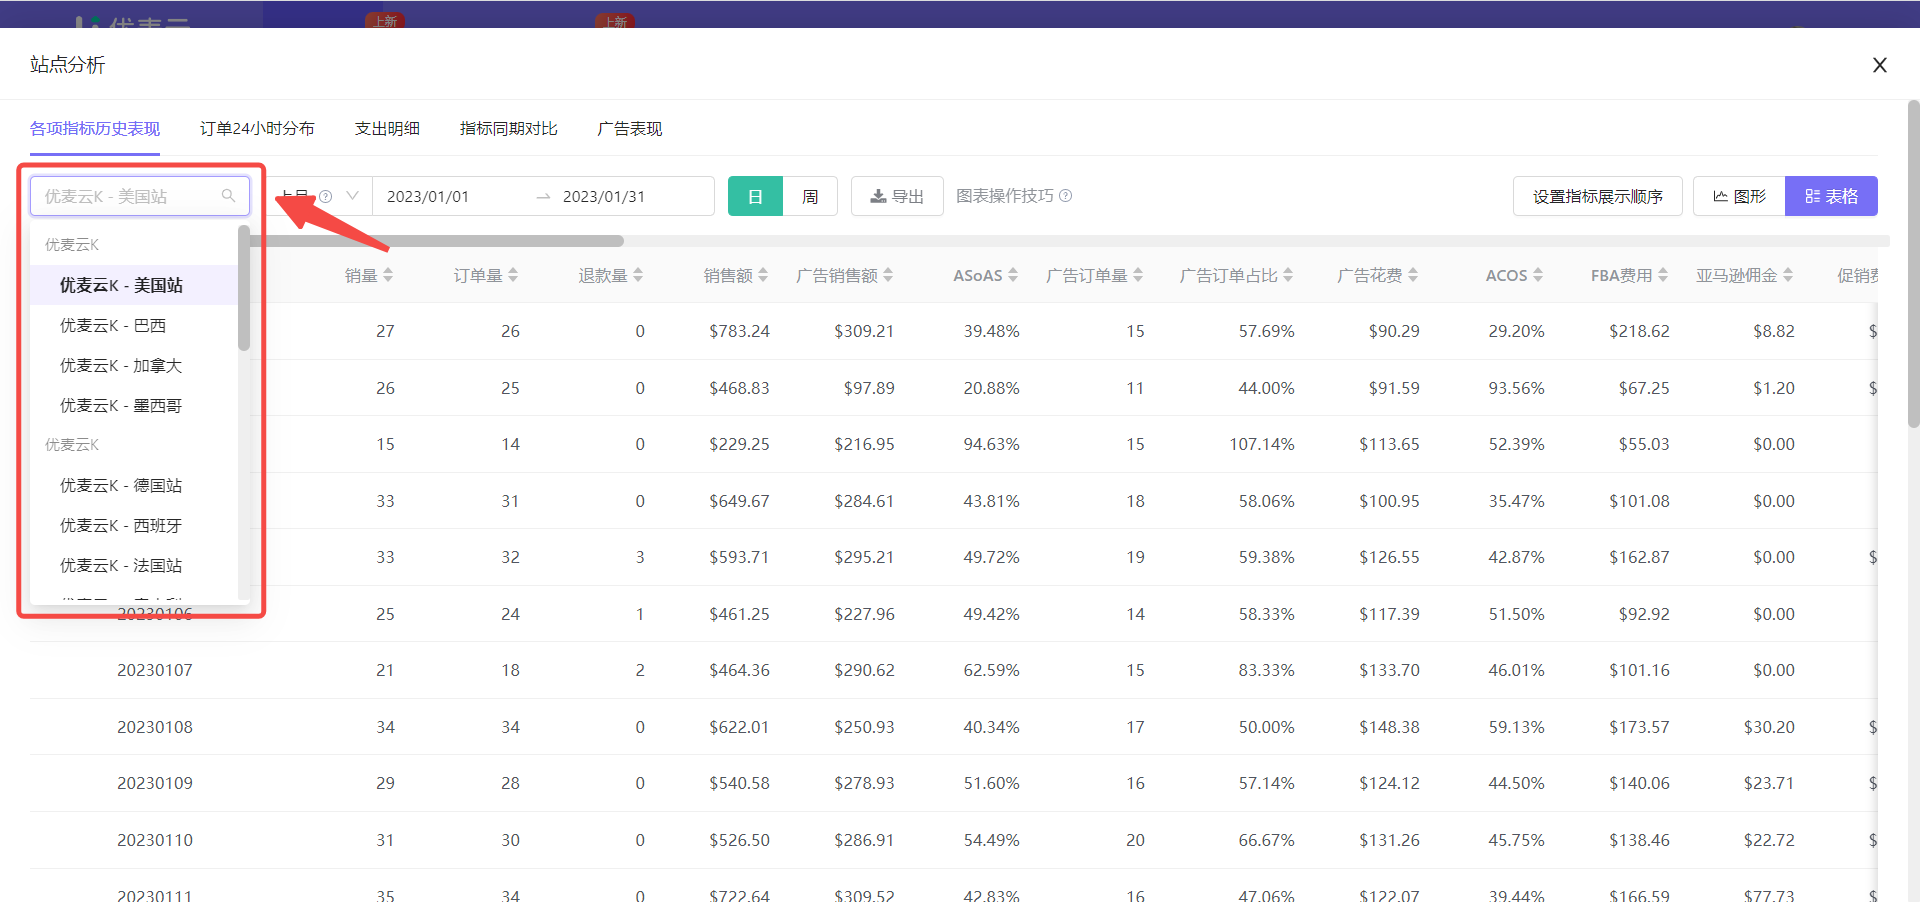
Then, select the marketplace to analyze.
We can choose to analyze the historical performance of various metrics for different marketplaces.
Click the [Marketplace Selection] button in the upper left corner to switch the marketplace to [SellerSpace K - US Marketplace] with one click.
 +
+
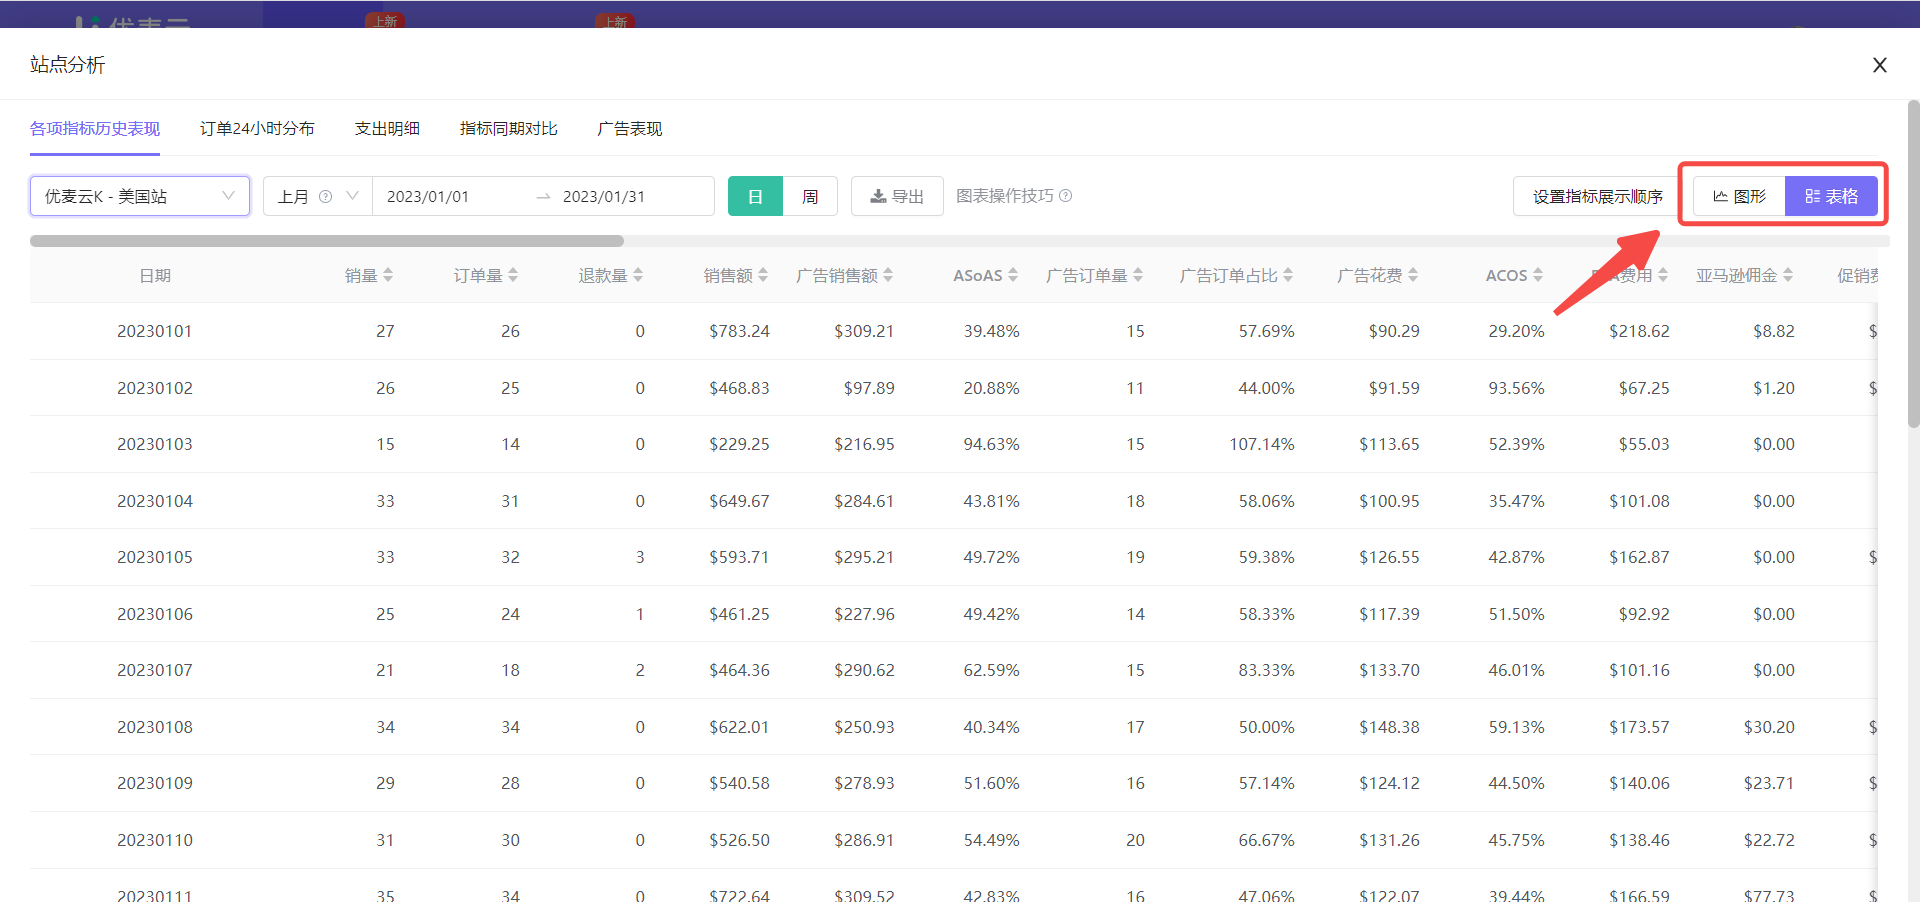
Next, select the data display format.
There are 2 display formats for metrics: Graph + Table. Depending on the data display format, we can set the metric display order or quantity separately.
Click the icon in the upper right corner to switch the display format with one click.
The current display format is Table, so no switching is needed.
 +
+
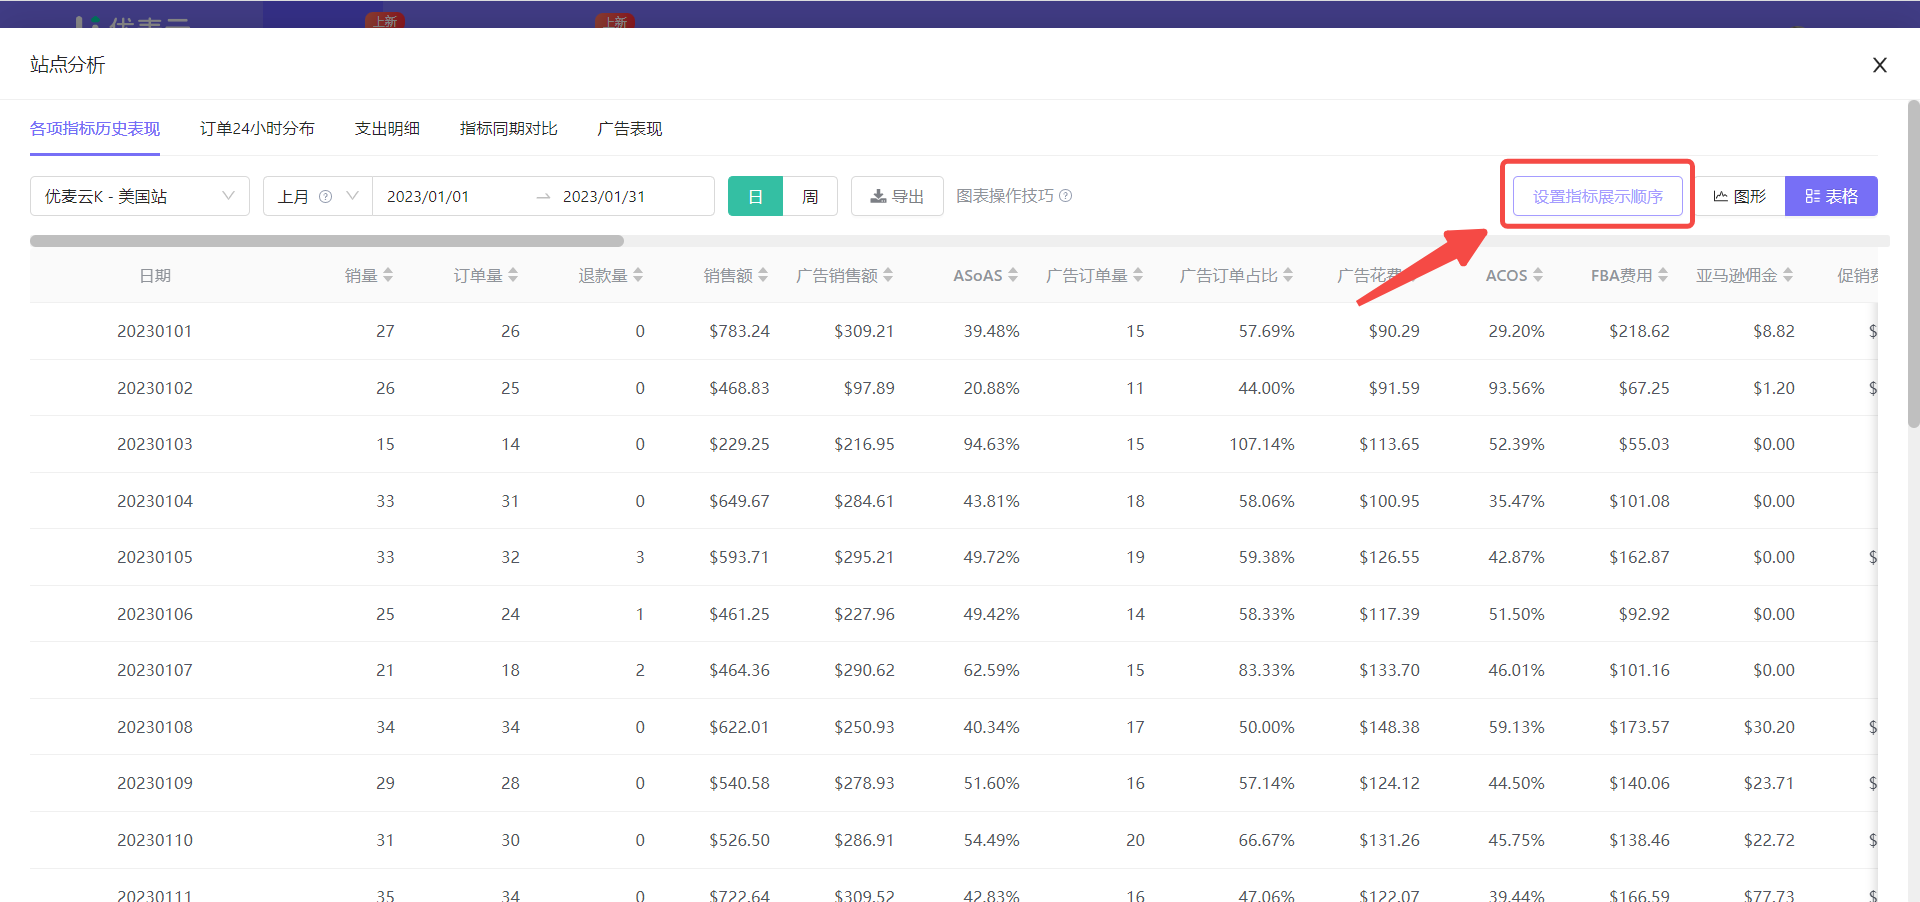
Finally, we can choose to set the metric display order.
When you select the [Table] format, we can customize the display order of metrics.
We want to analyze the [ACOS] metric, but it cannot be analyzed separately. It needs to be analyzed together with other advertising metrics. Therefore, we can choose to put the required advertising metrics together for easy viewing.
Click [Set Metric Display Order] in the upper right corner to enter the settings.
 +
+
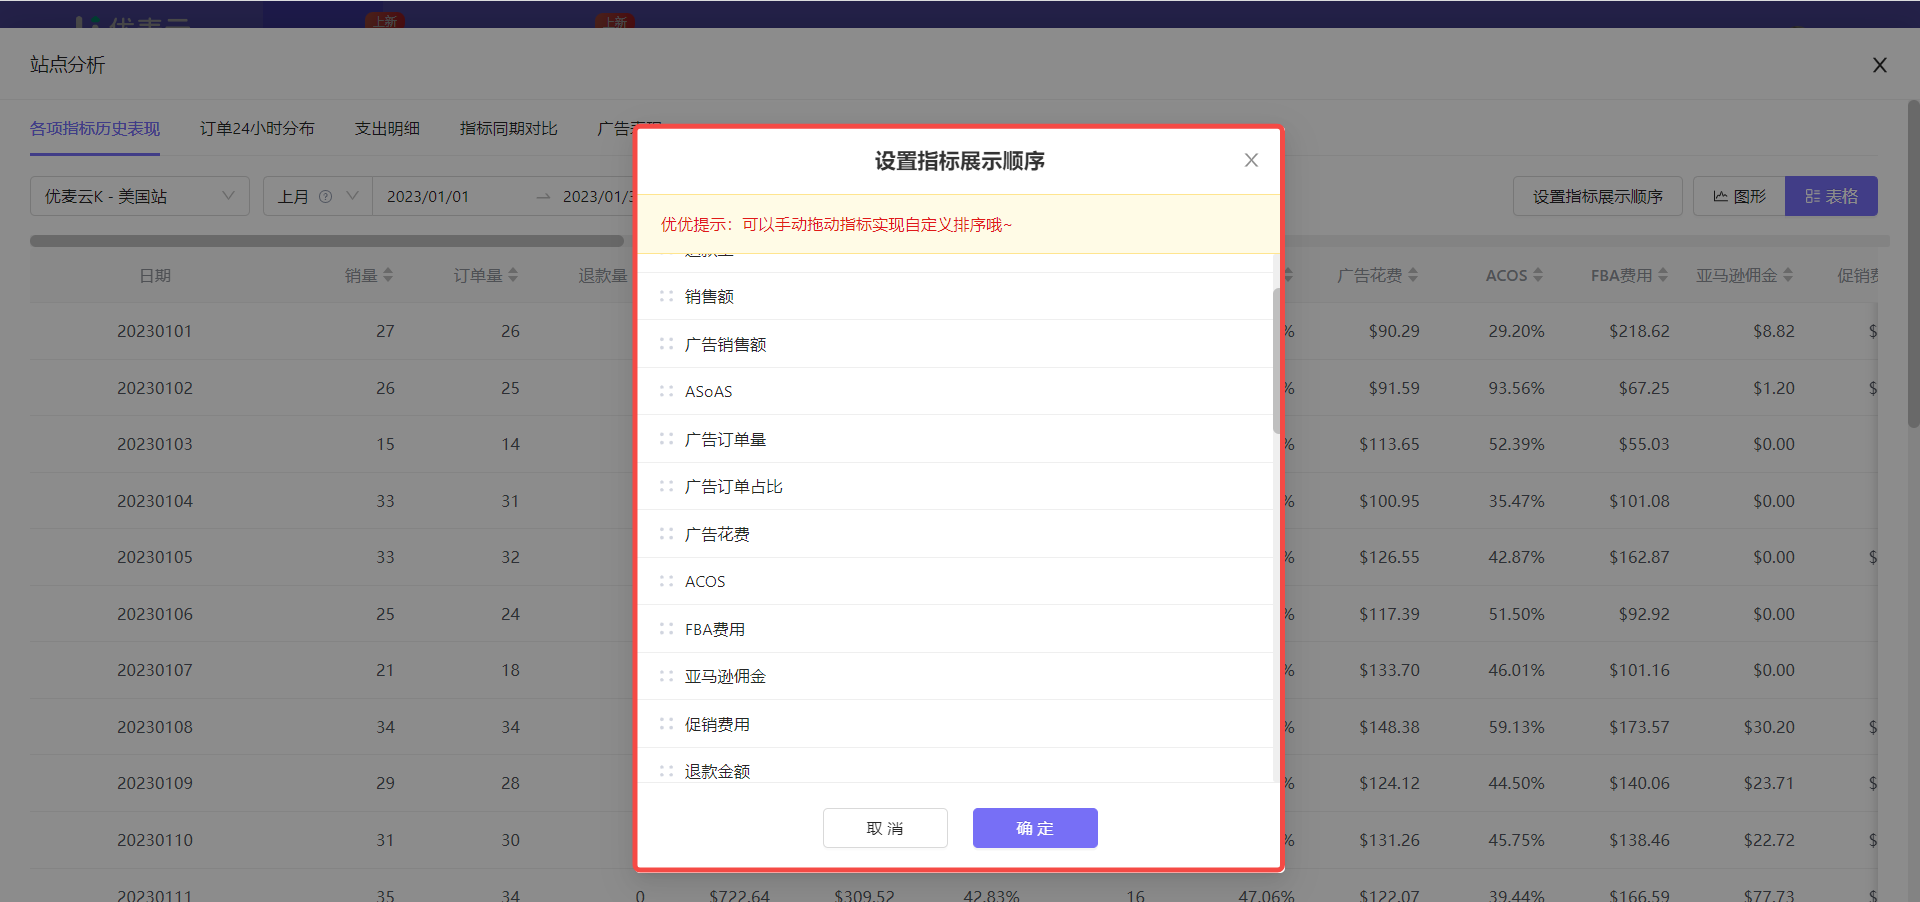
Customize the metric display order, drag and sort, and put advertising-related metrics together for easy analysis.
 +
+
Note: The above operation order is not fixed. Operate according to your own needs.
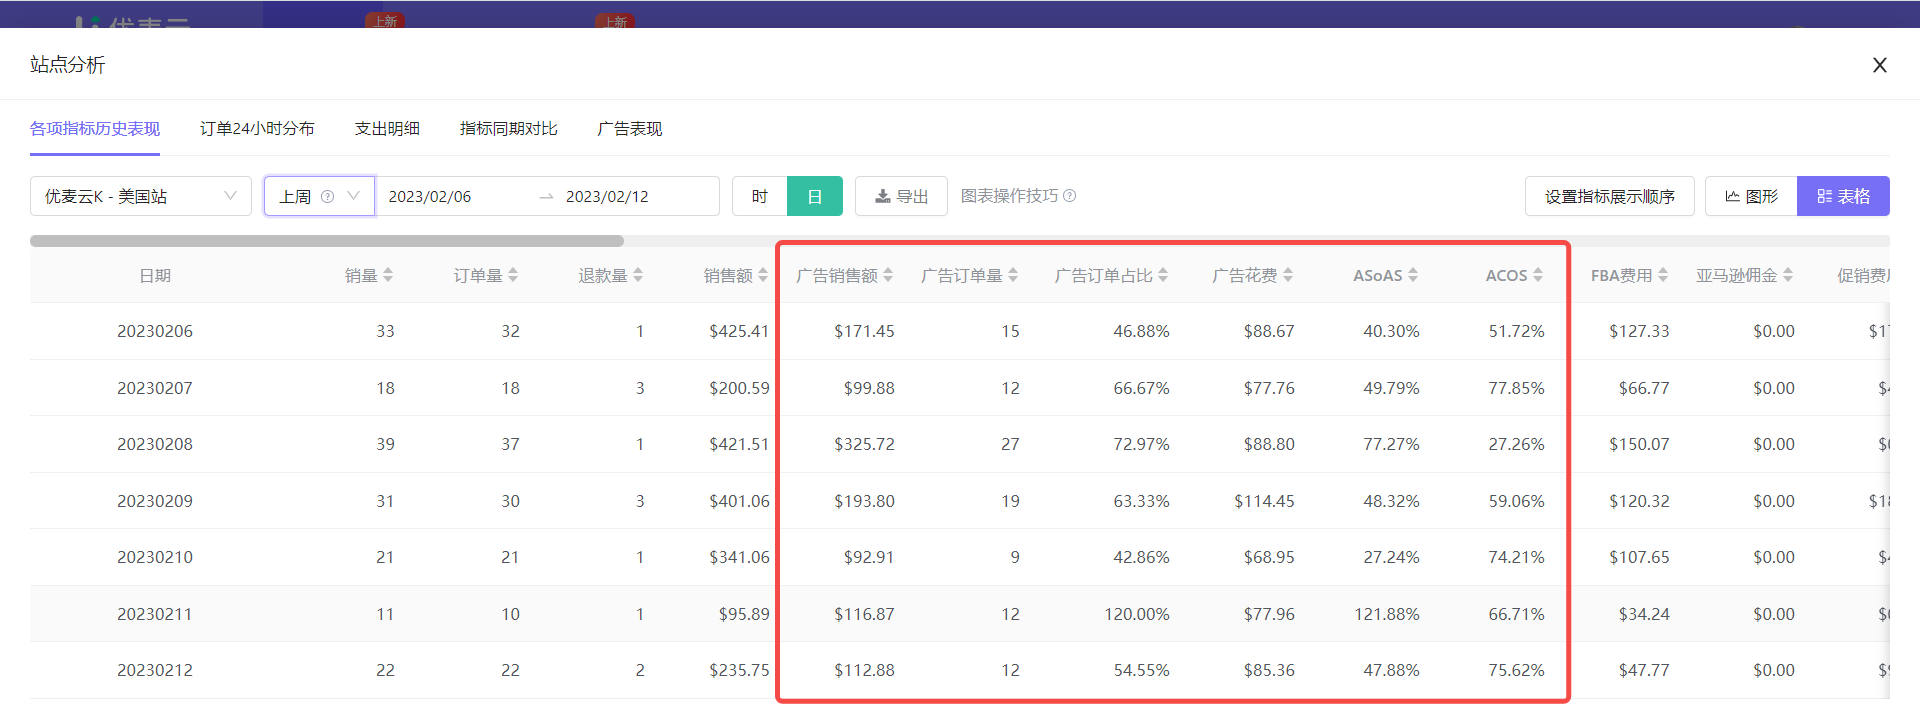
At this time, we can analyze the advertising ACOS for last week.
 +
+
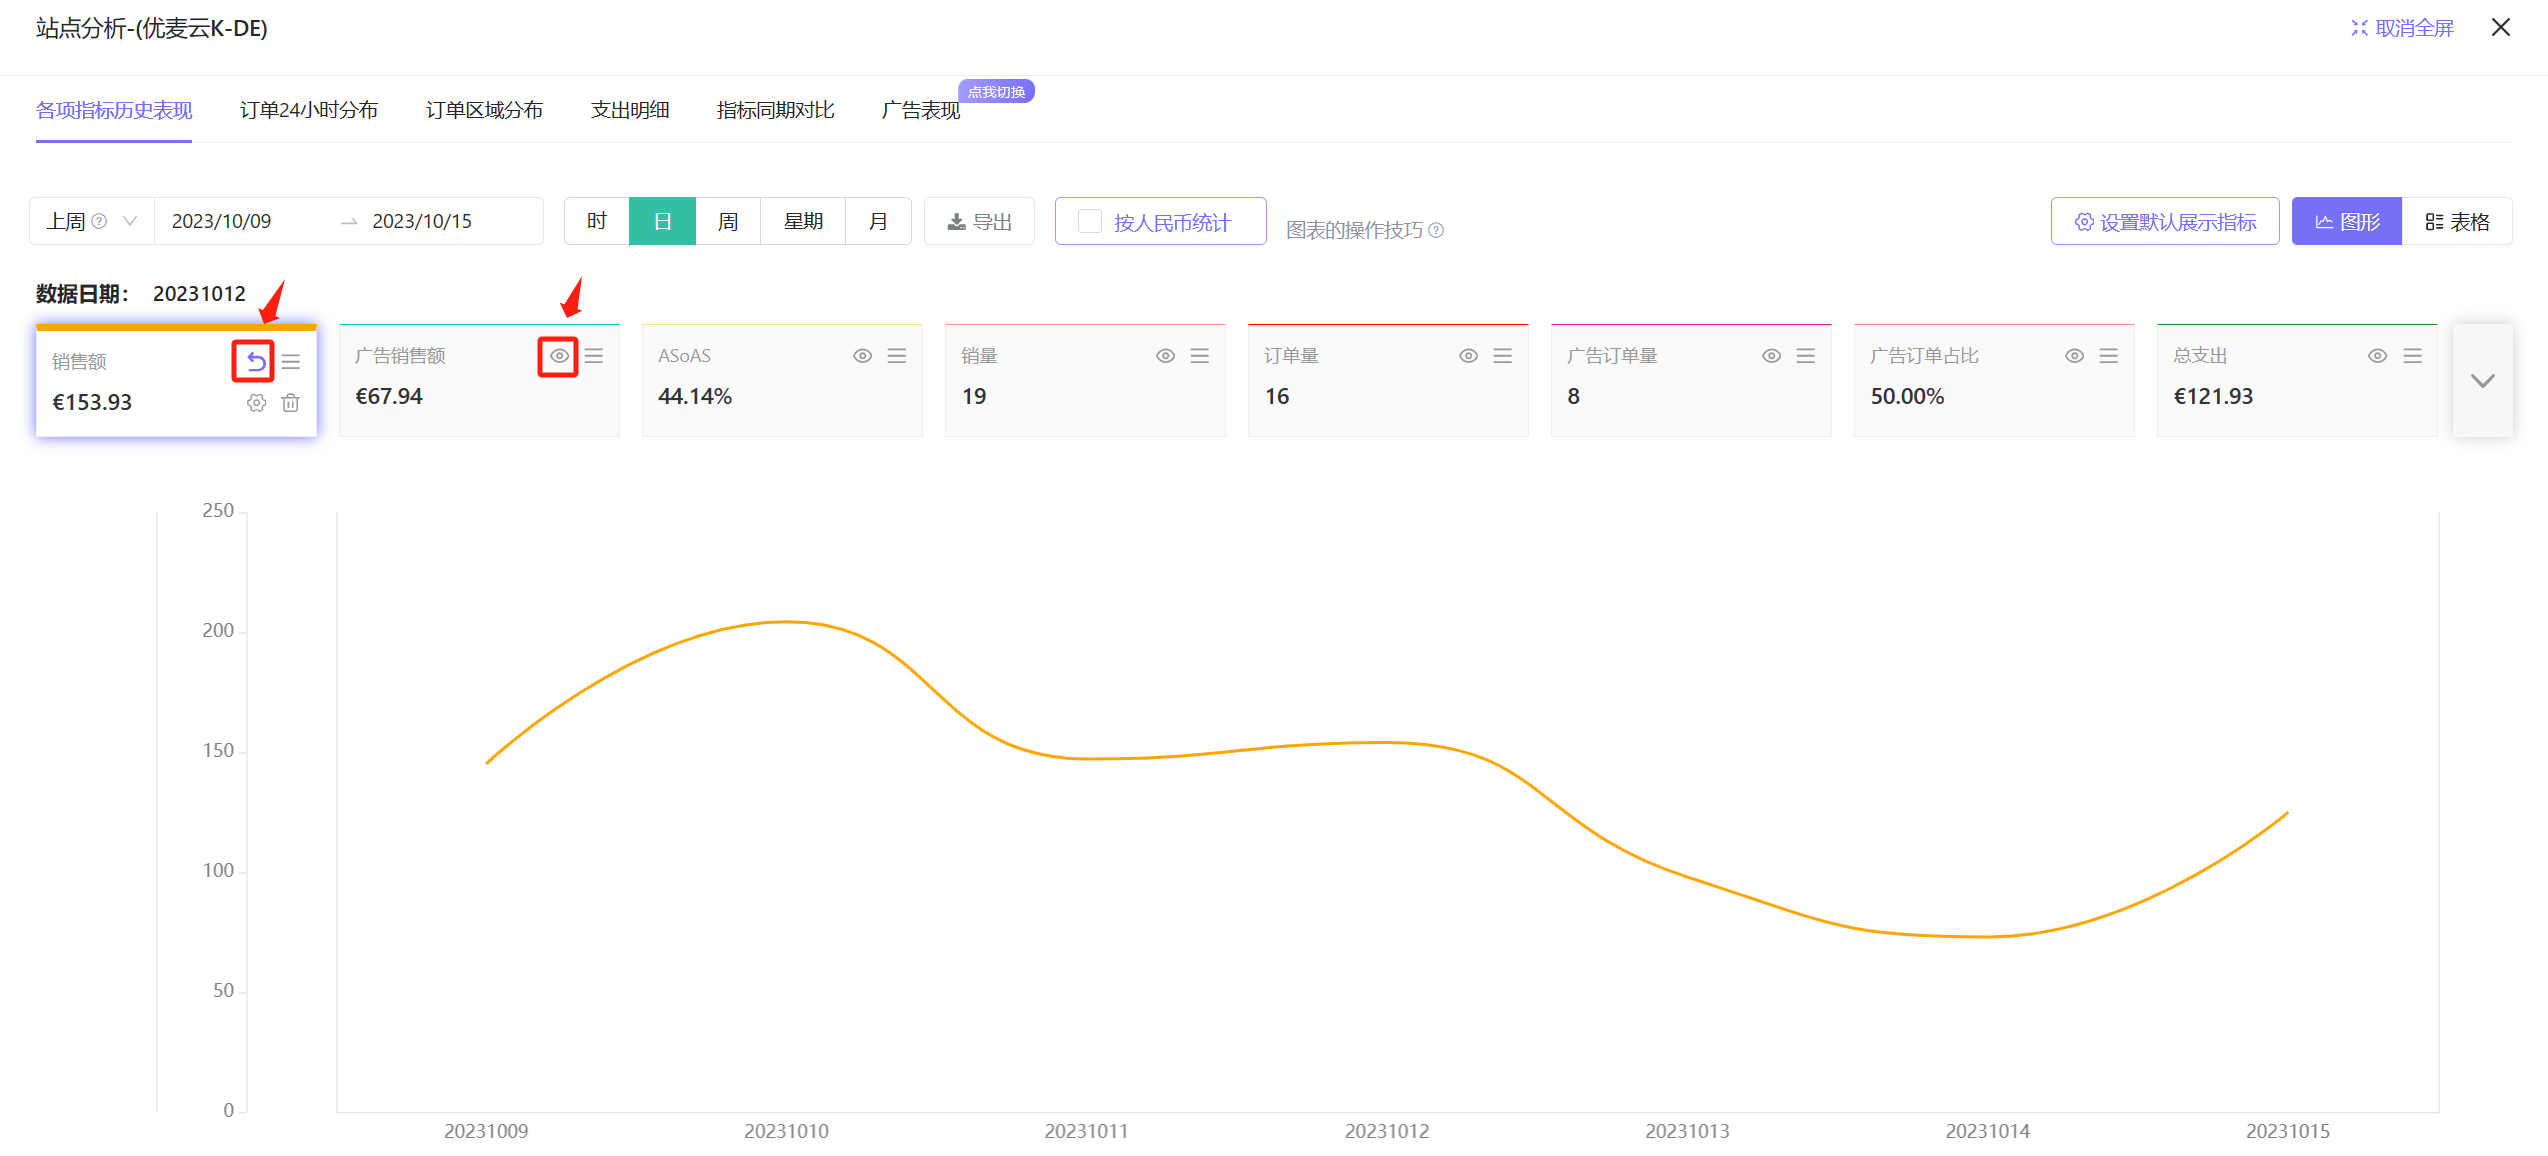
For example:
It can be seen from the data in the figure that the overall ACOS of this marketplace was relatively high last week.
At this time, we need to analyze the reasons for the high ACOS: Is it caused by launching new products that lead to high ACOS, because the advertising goal of new products is to obtain high impressions and high traffic, and the conversion rate is low, is this the reason for increasing the overall ACOS? Or is it because the keywords are not accurate, resulting in some irrelevant matching keywords, consuming a lot of budget, and no conversion, resulting in a high ACOS? ... You can analyze the specific situation according to the actual situation.
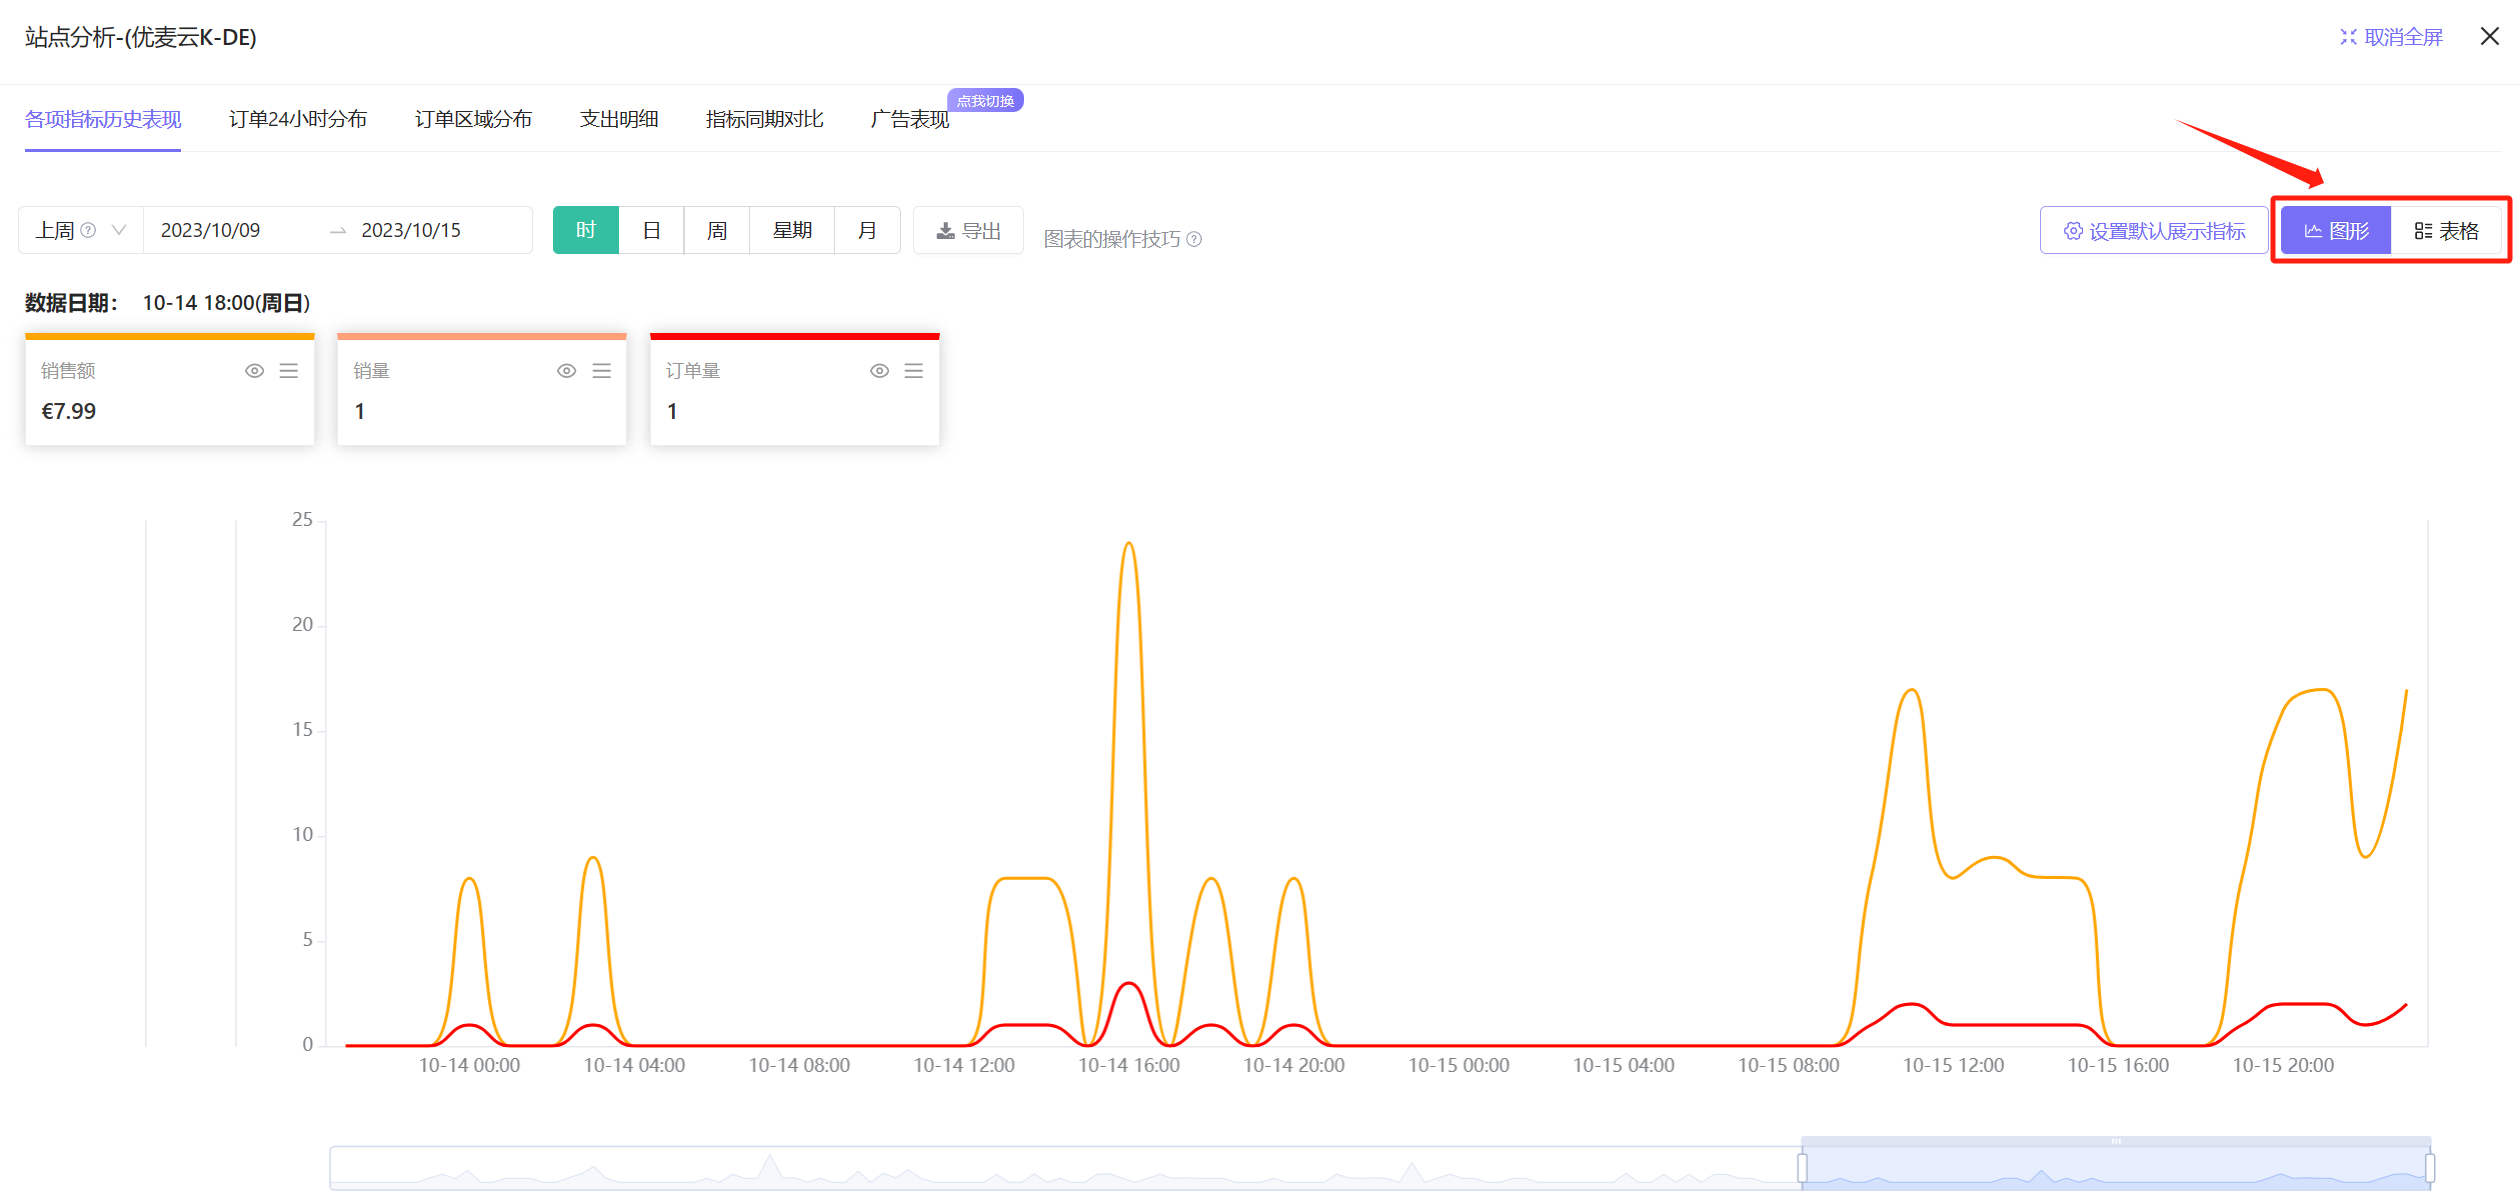
In addition to the above [Table] data display format, we can also choose the [Graph] format to analyze the historical performance of metrics.
Graphs can more intuitively view the historical performance trend of metrics, whether it is an upward or downward trend, or other performance, etc.
The following explains the operation method of the chart:
Click the switch button in the upper right corner to switch to the chart with one click.
 +
+
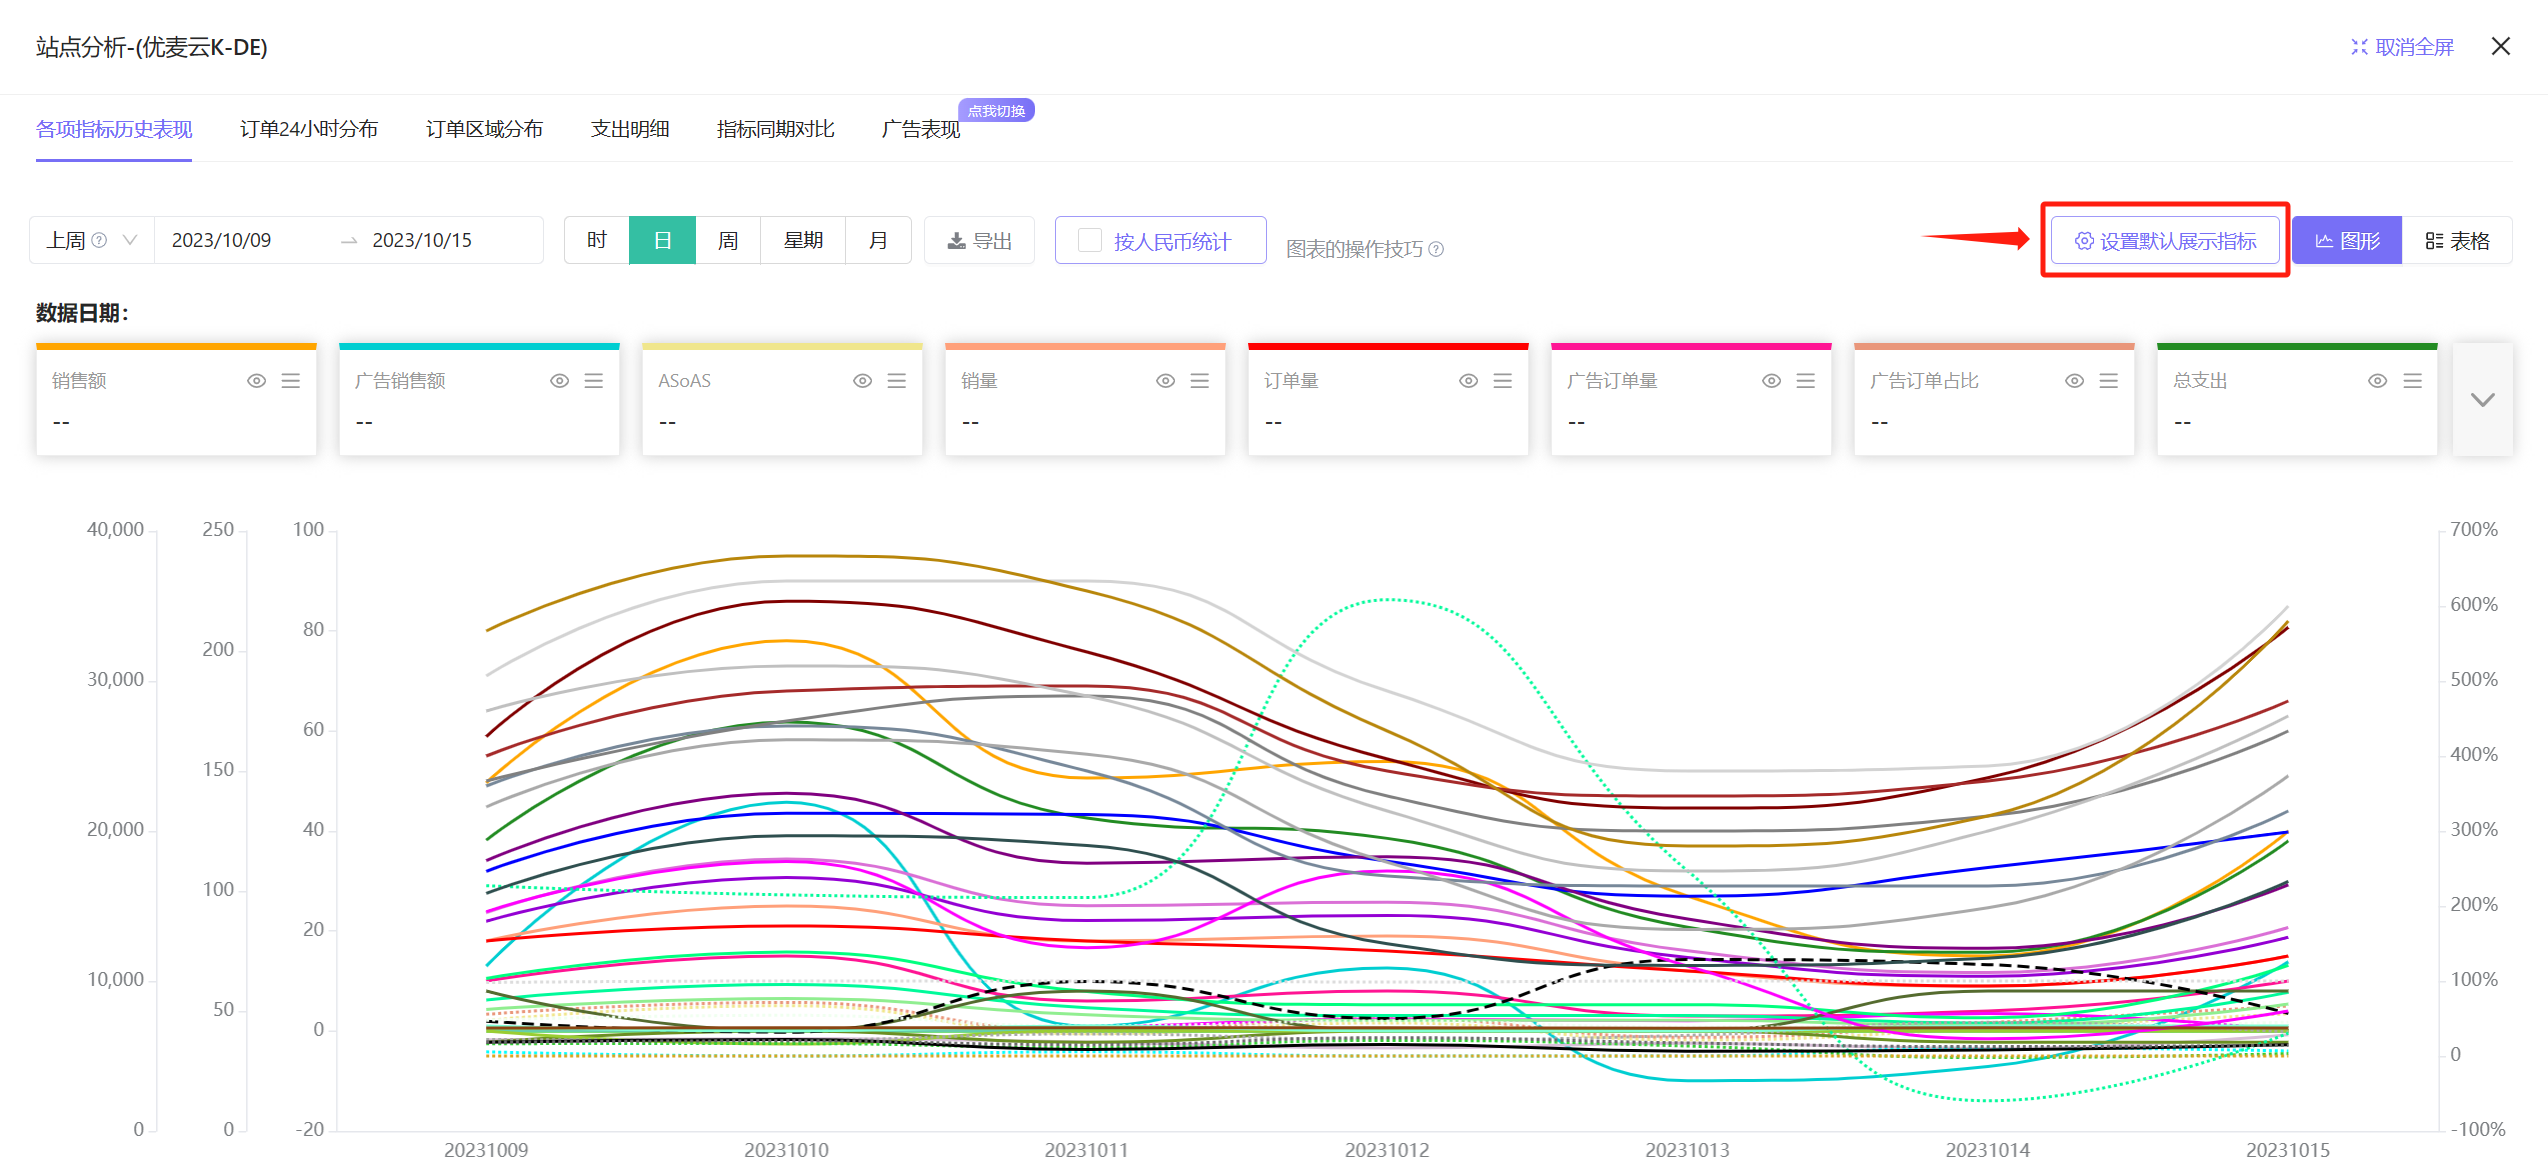
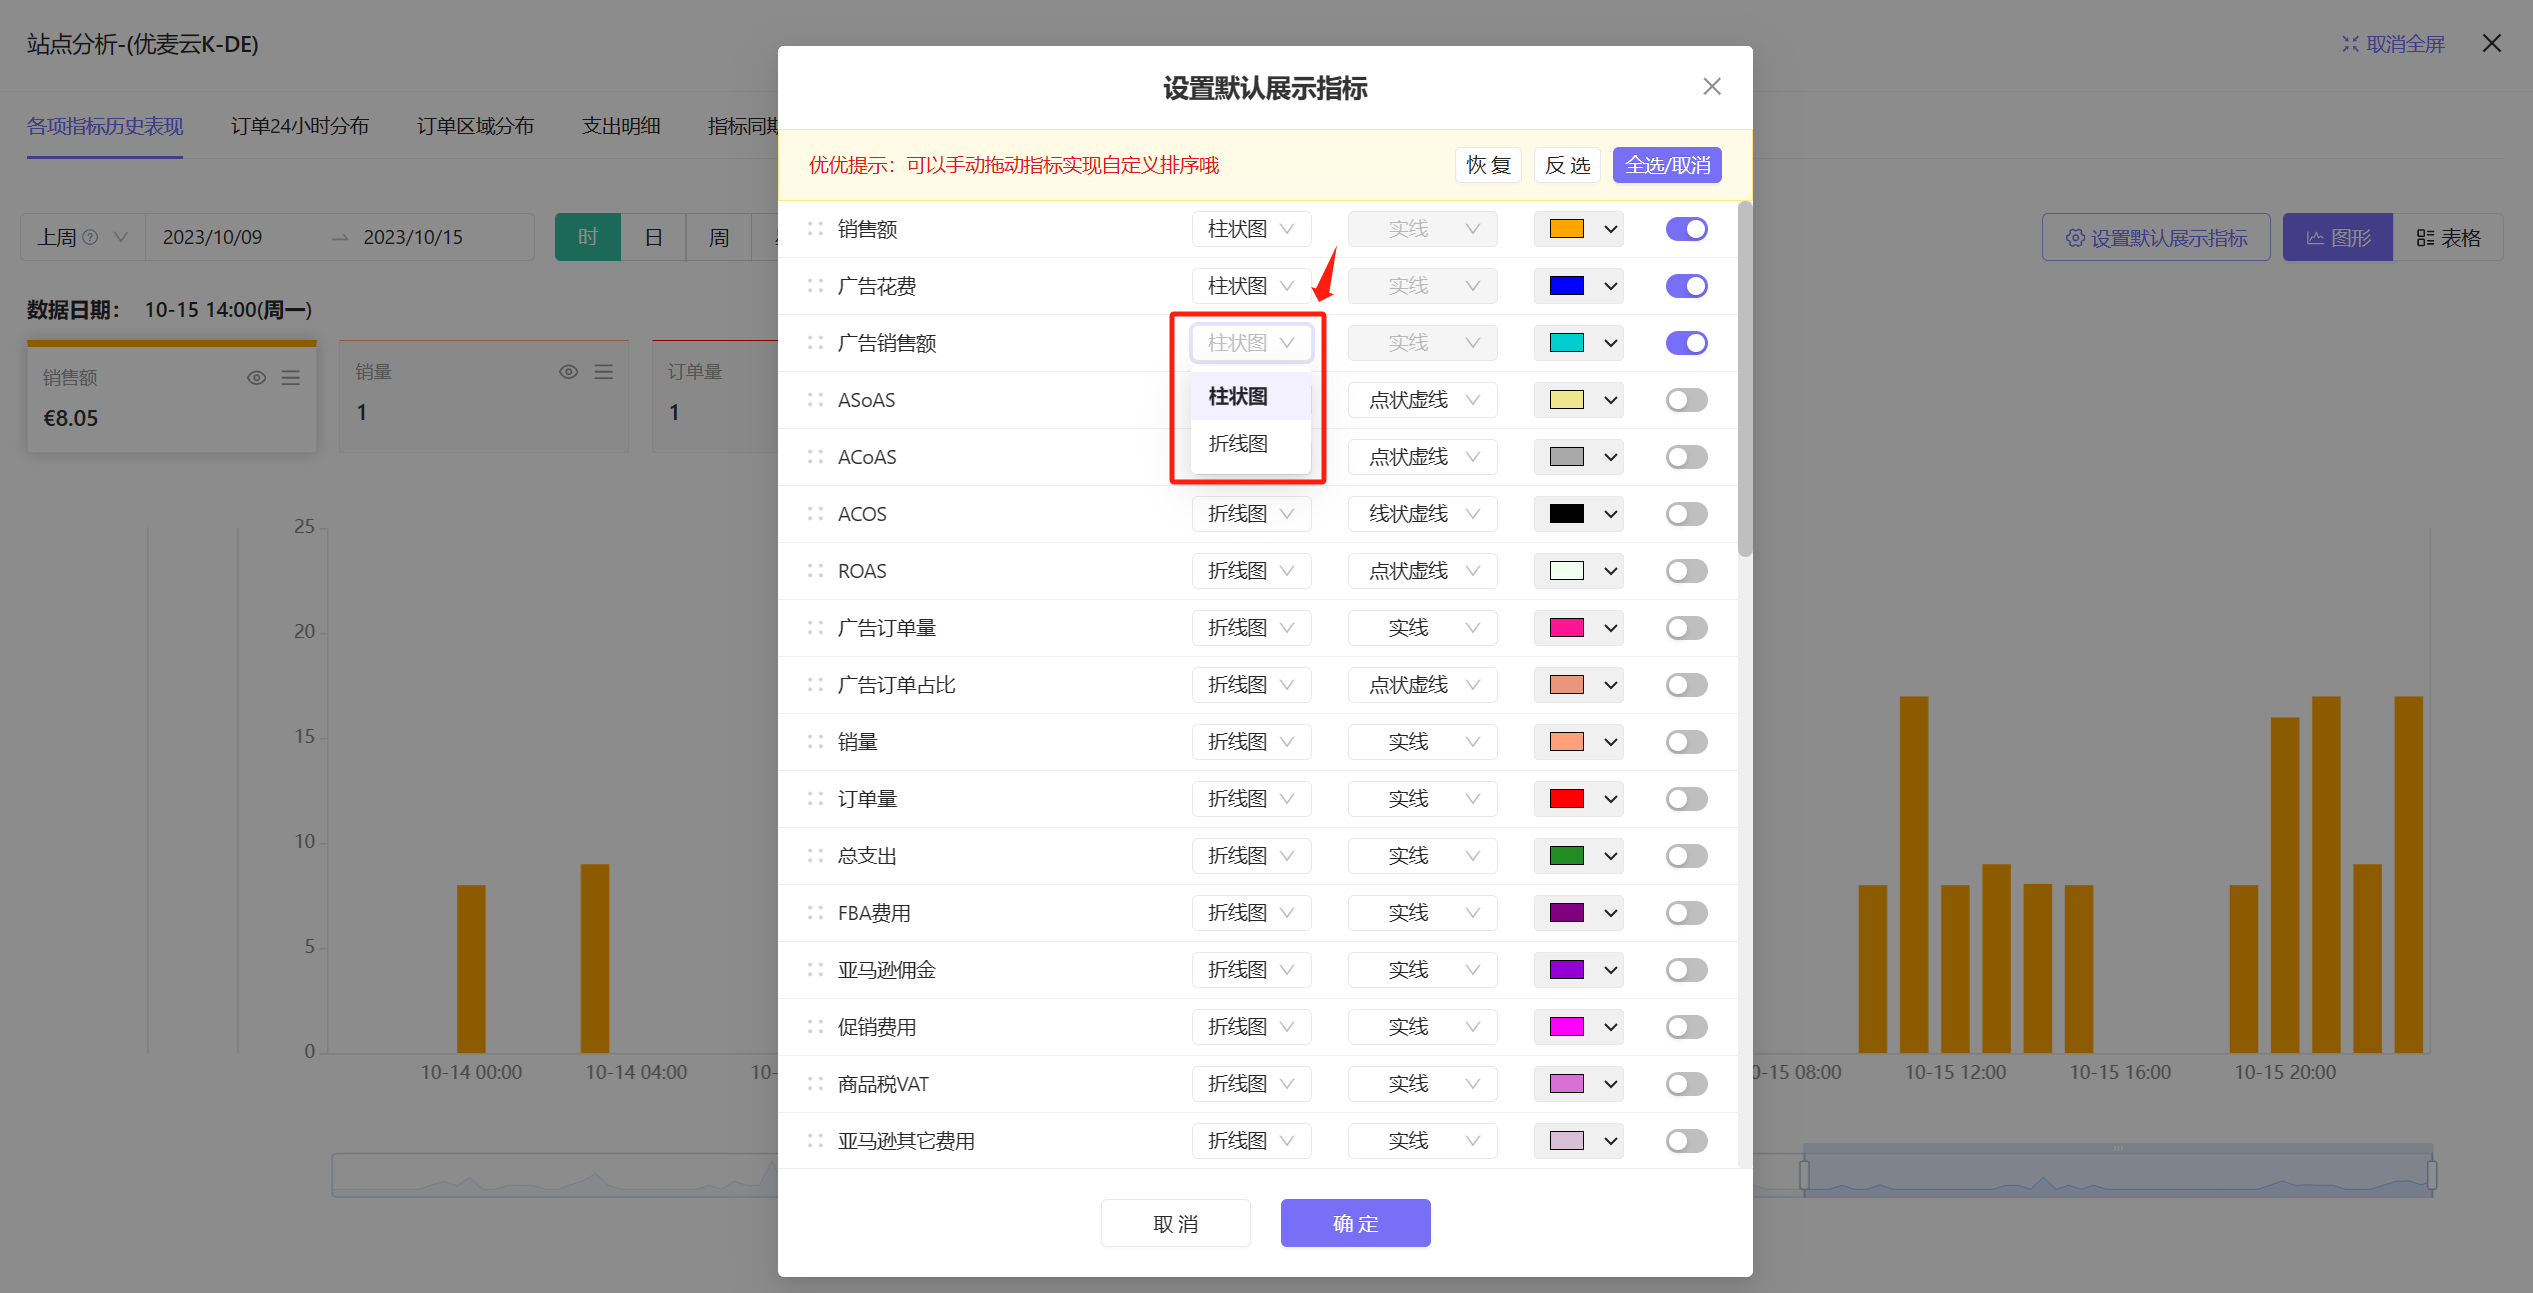
We can set the default display metrics and metric display order for [Graph].
Click the [Set Default Display Metrics] button to enter the settings.
 +
+
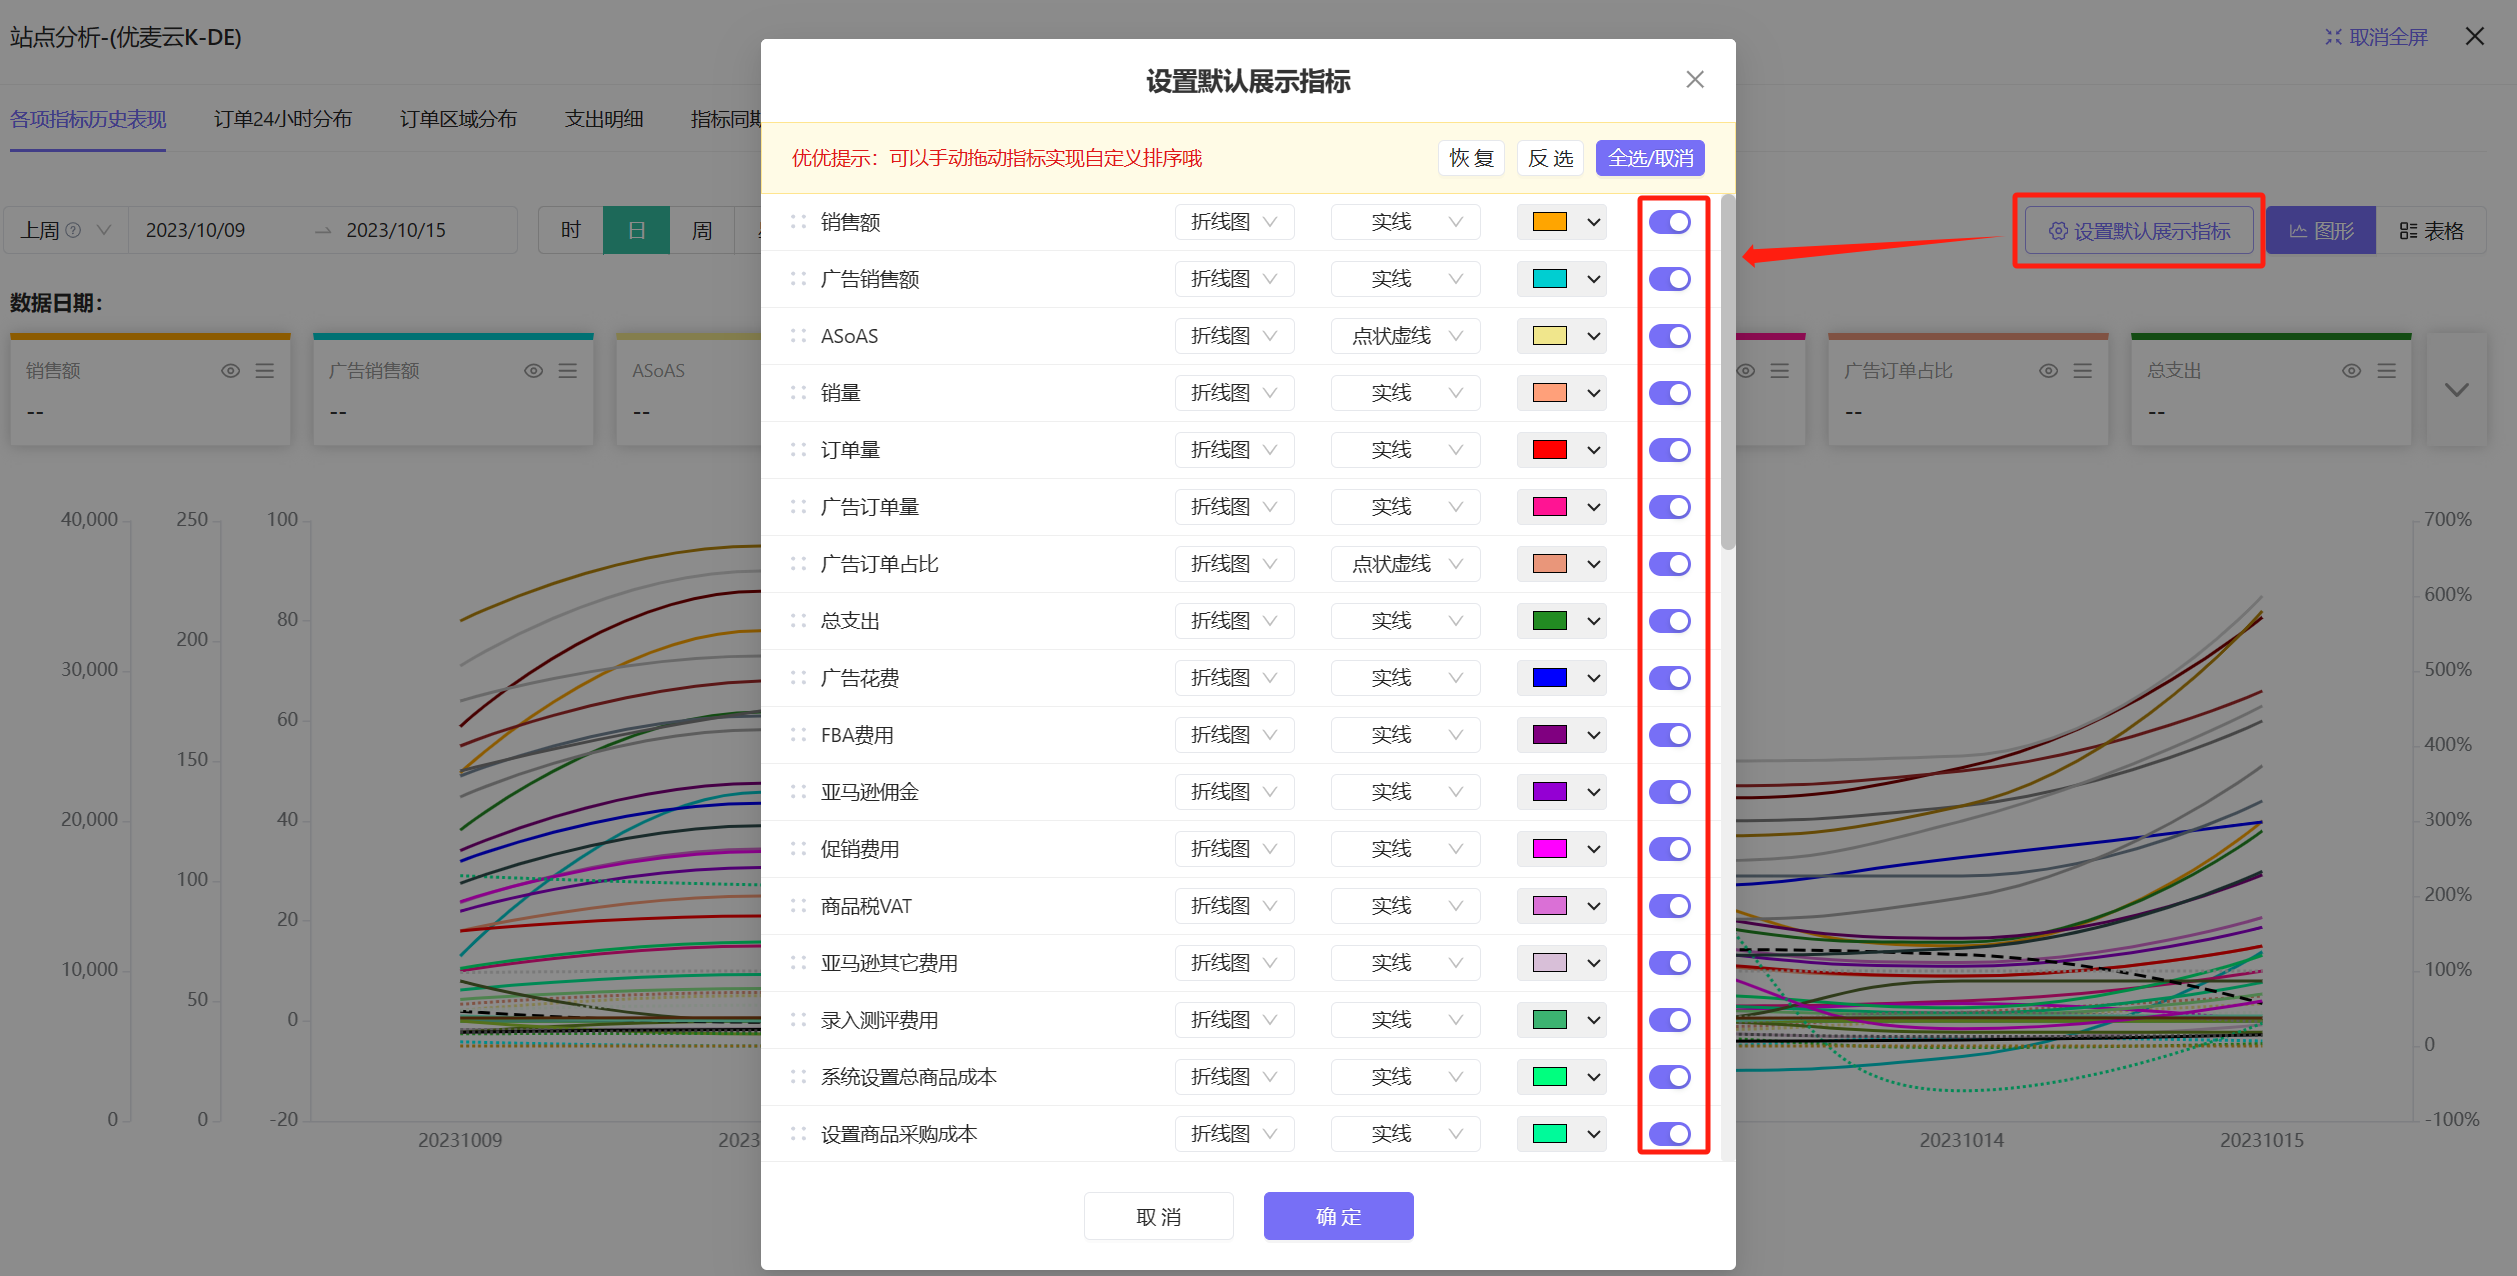
Set default display metrics:
 +
+
Special reminder: When the data time is selected as [Today] or [Yesterday], the 24-hour trend data of Units Sold, Order Volume, and Sales Revenue will be displayed by default, which is not based on the set display metrics.
Chart operation tips tutorial:
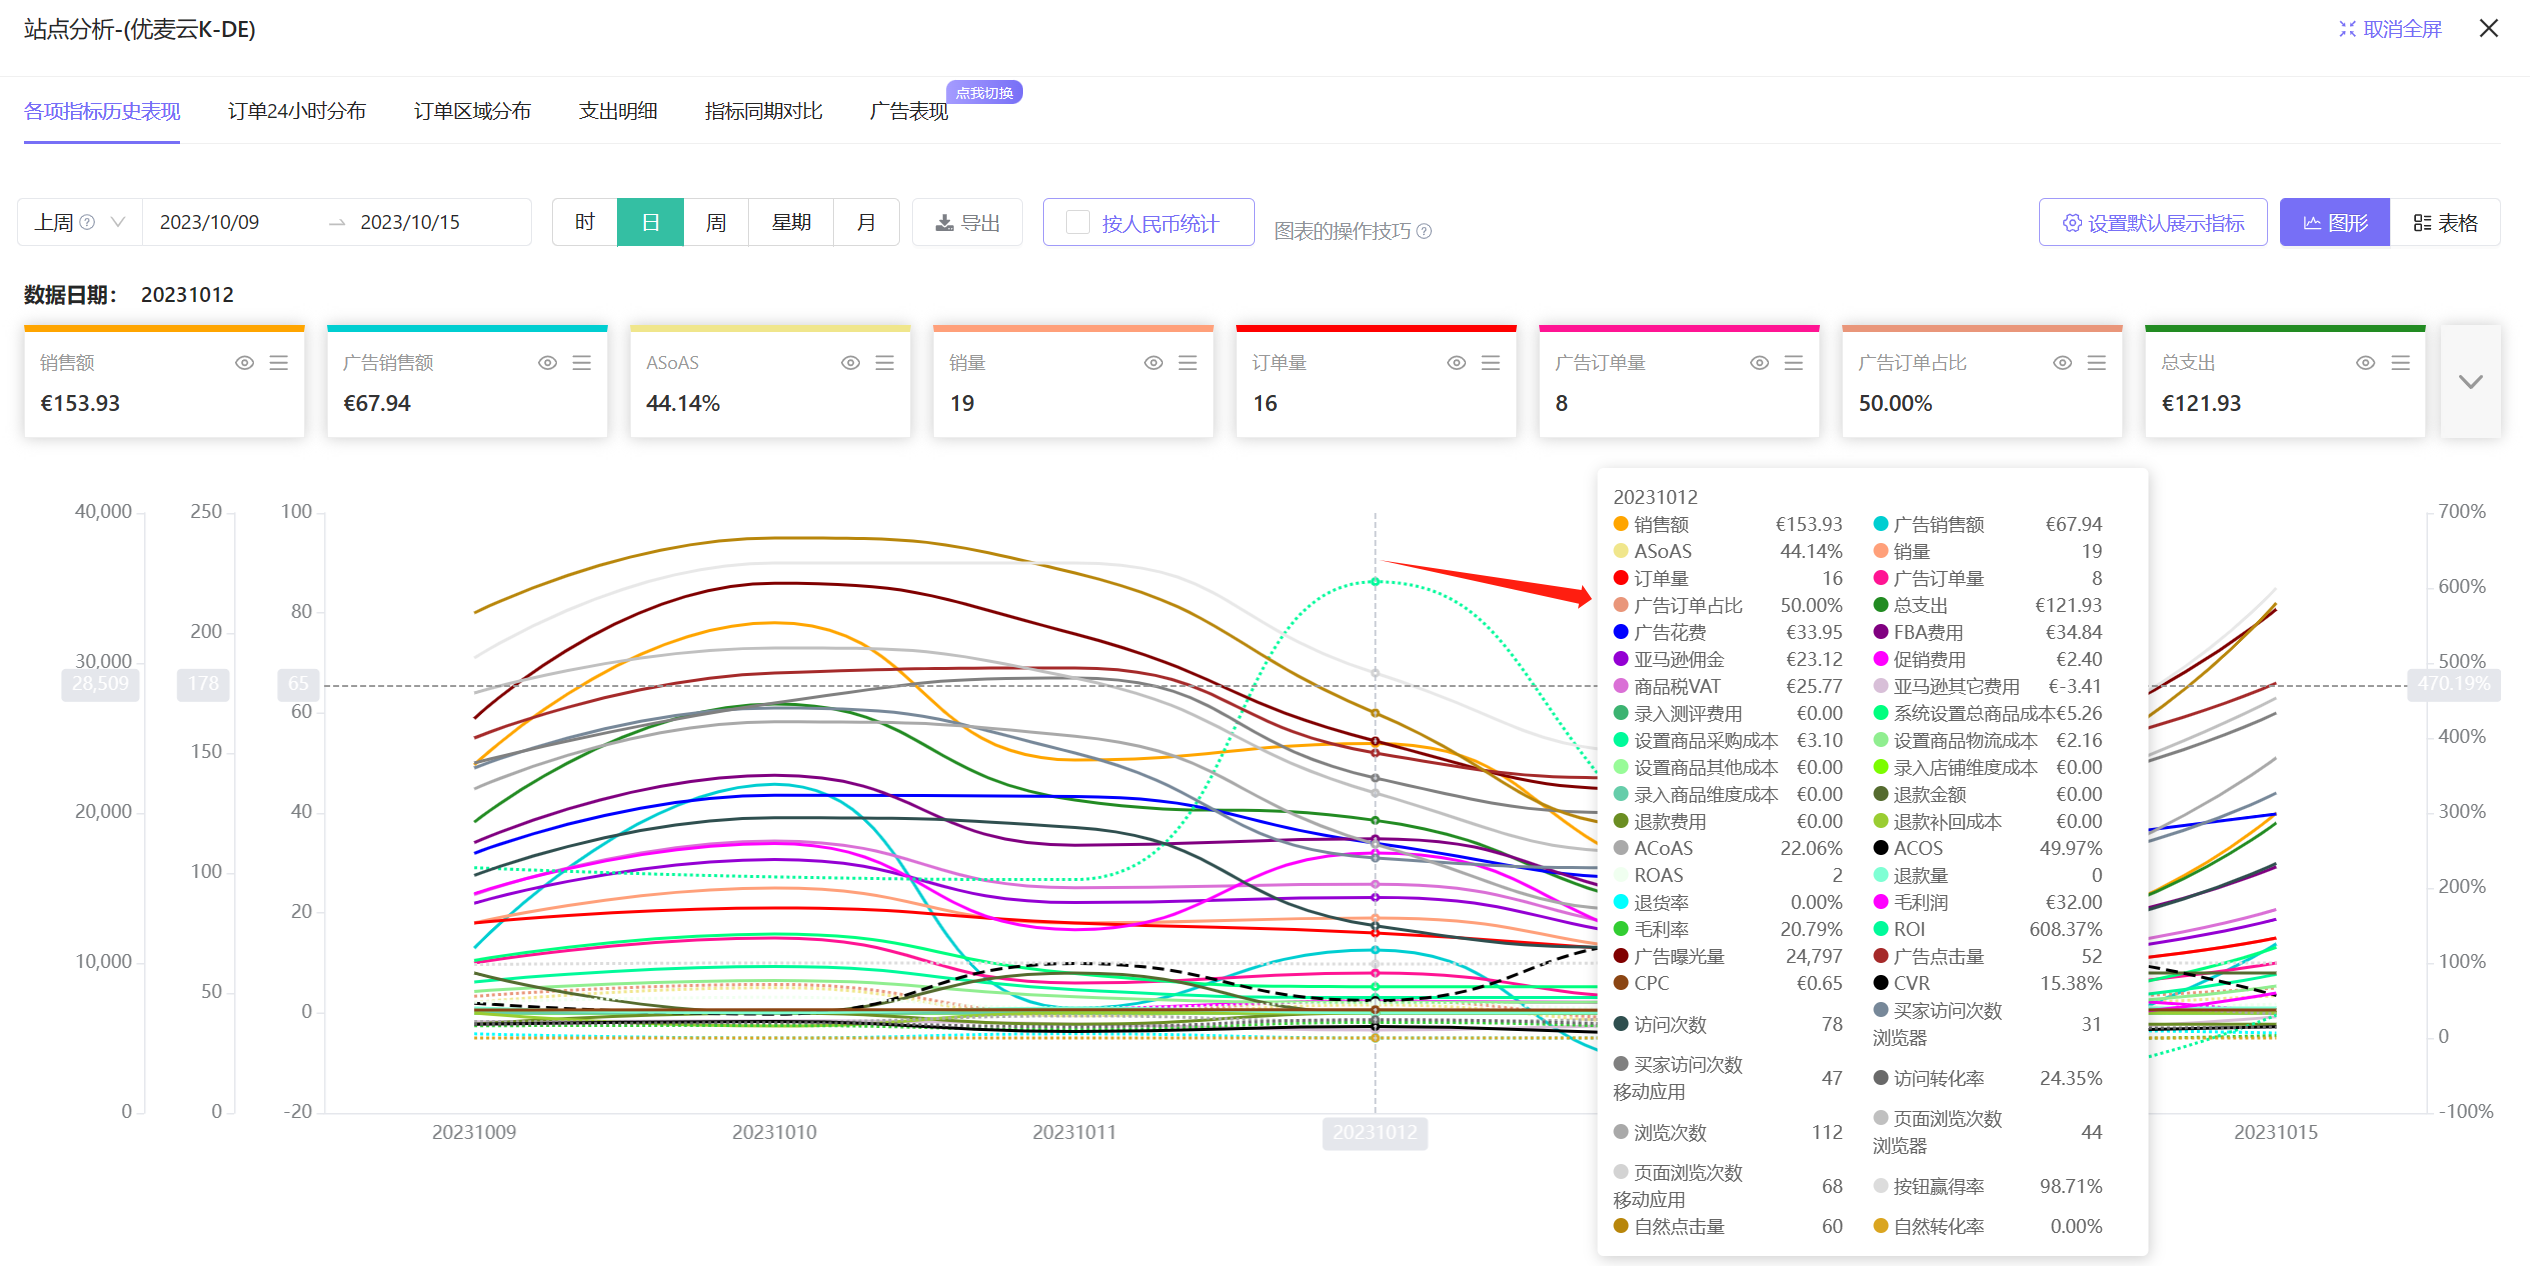
Hover the mouse over the curve to view the detailed data of the corresponding node;
 +
+
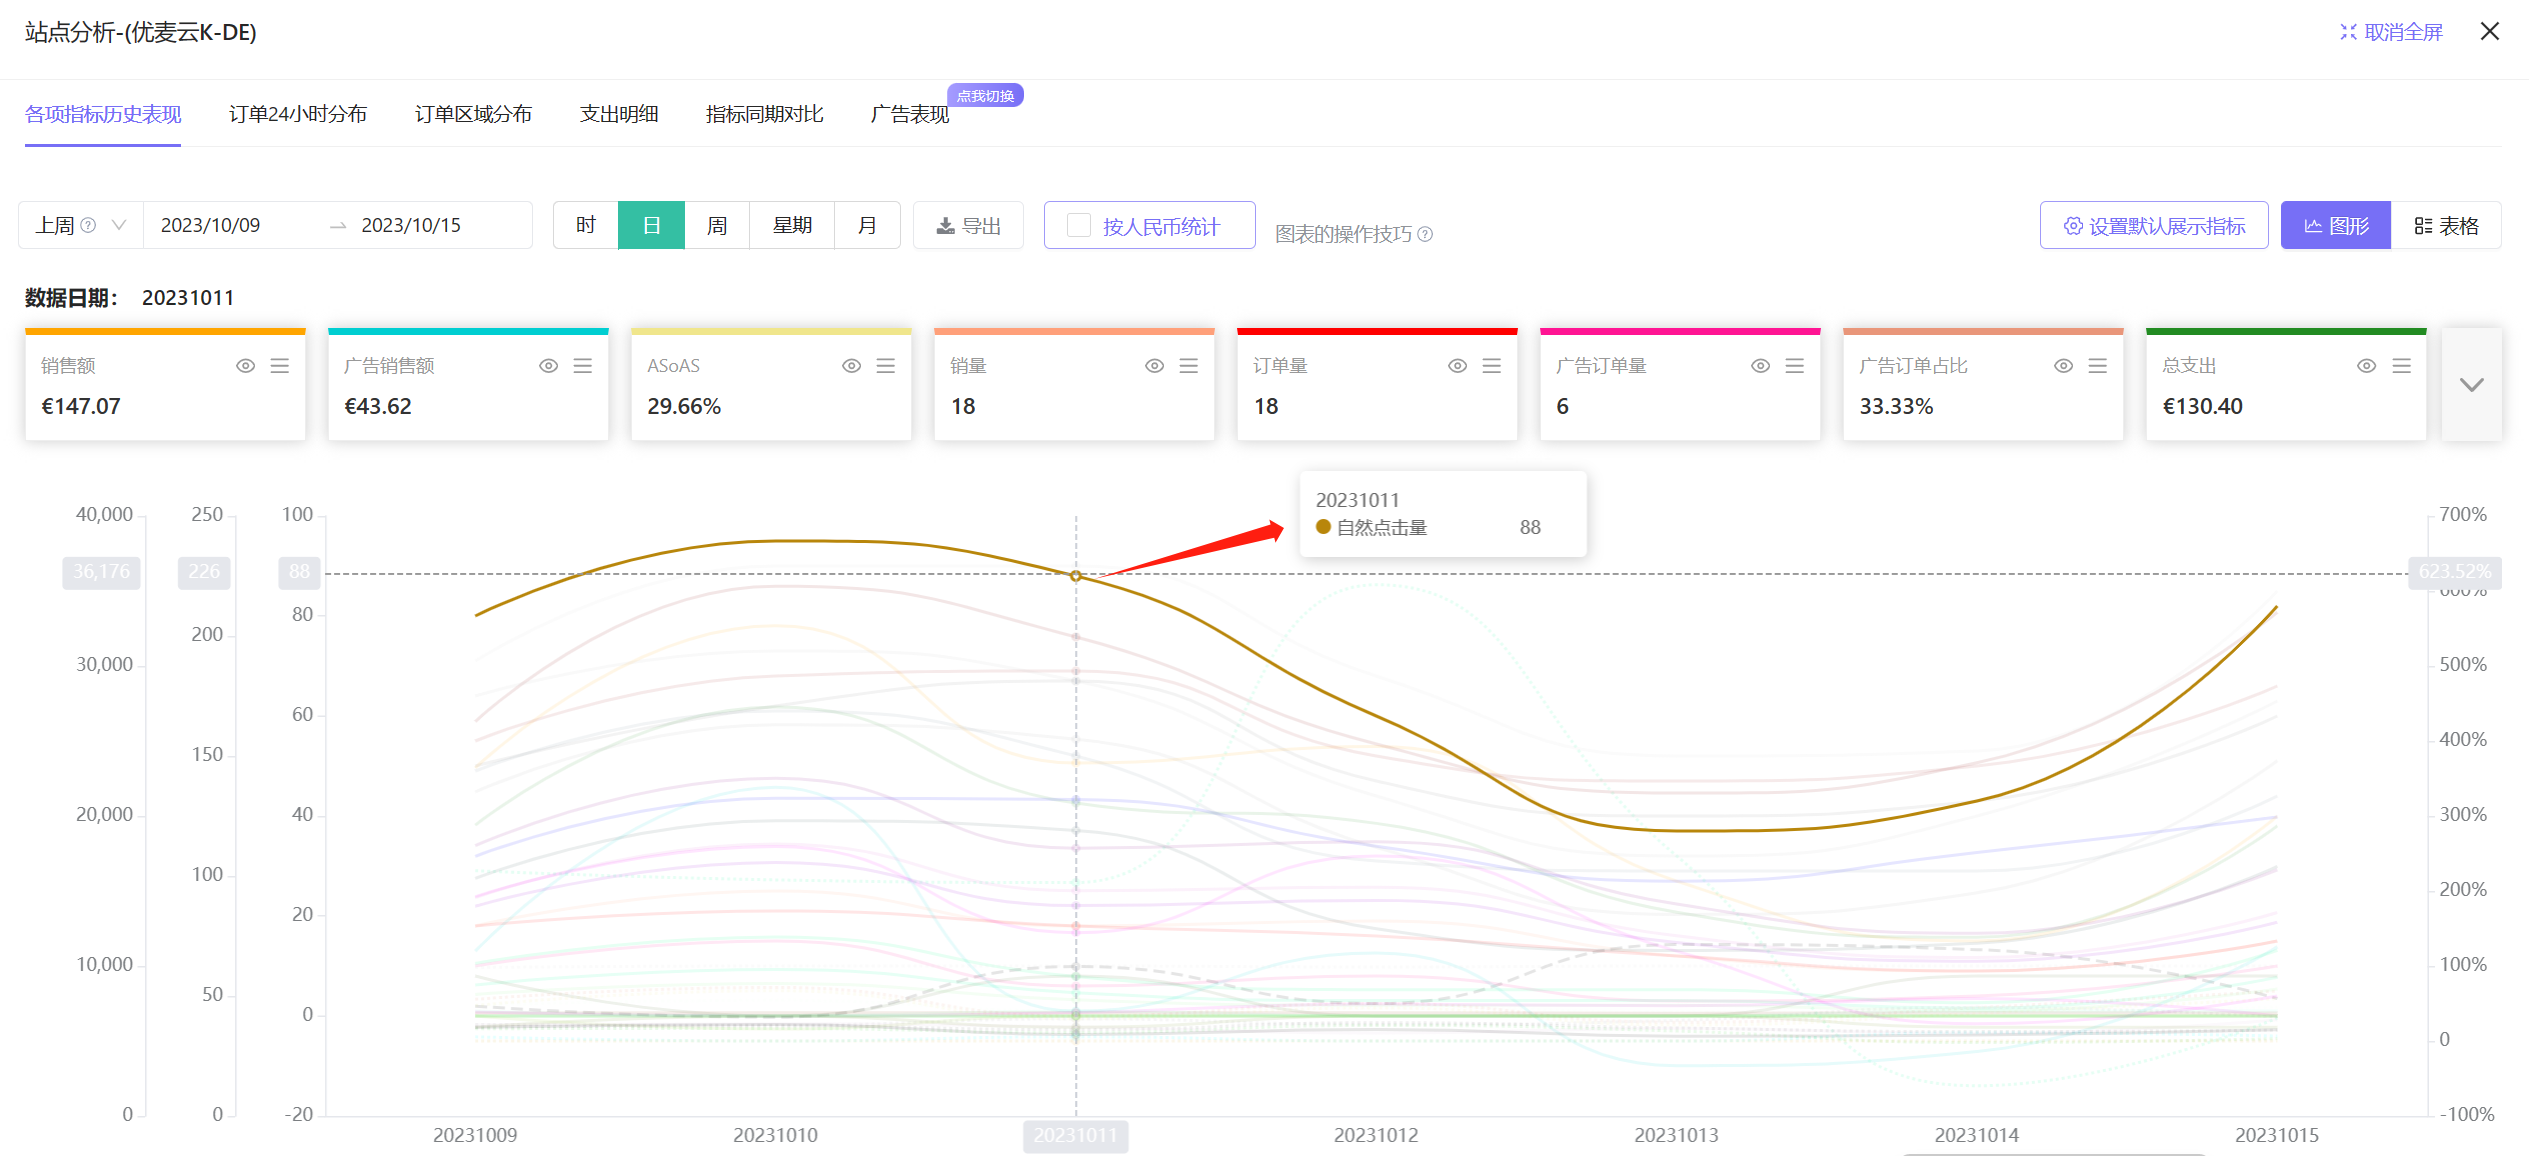
Hover the mouse over a single curve to view which metric the curve corresponds to, and the detailed data of the corresponding node;
 +
+
Click the curve to only view the metric corresponding to the curve. Move the mouse out of the curve and click again in the blank space to restore to displaying all the default metrics you set;
 +
+
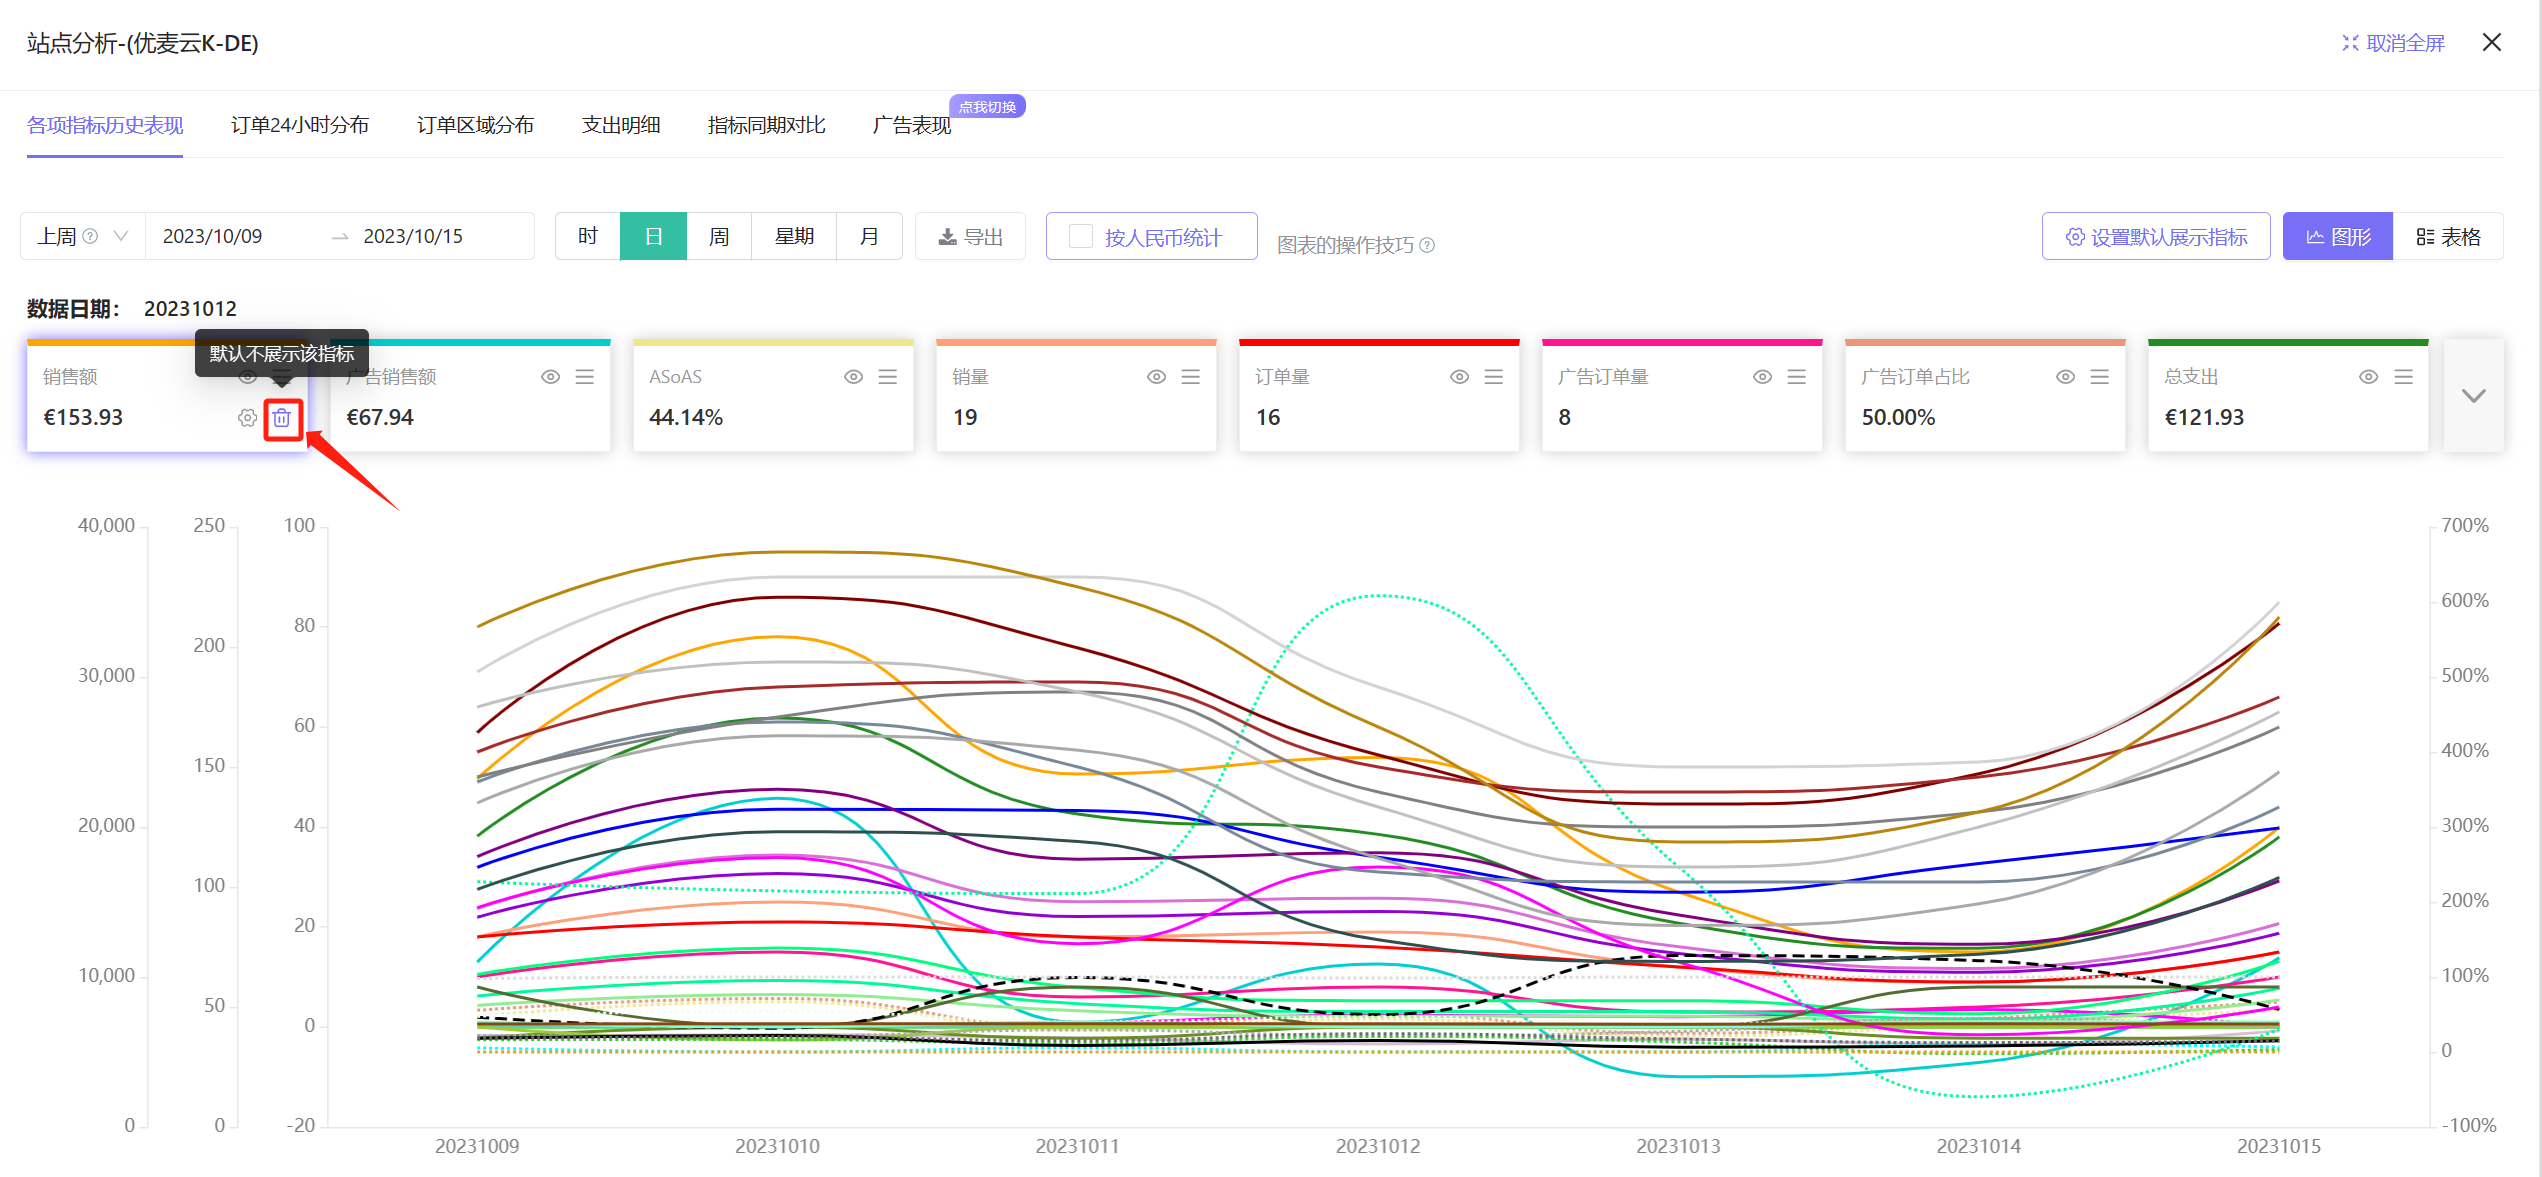
Click the metric below the [Set Default Display Metrics] button to hide or add display metrics;
 +
+
In addition to the curve trend chart, bar charts are also supported for viewing. The operation method is consistent with the curve trend chart.
Click the graph button on the right to switch with one click.
 +
+
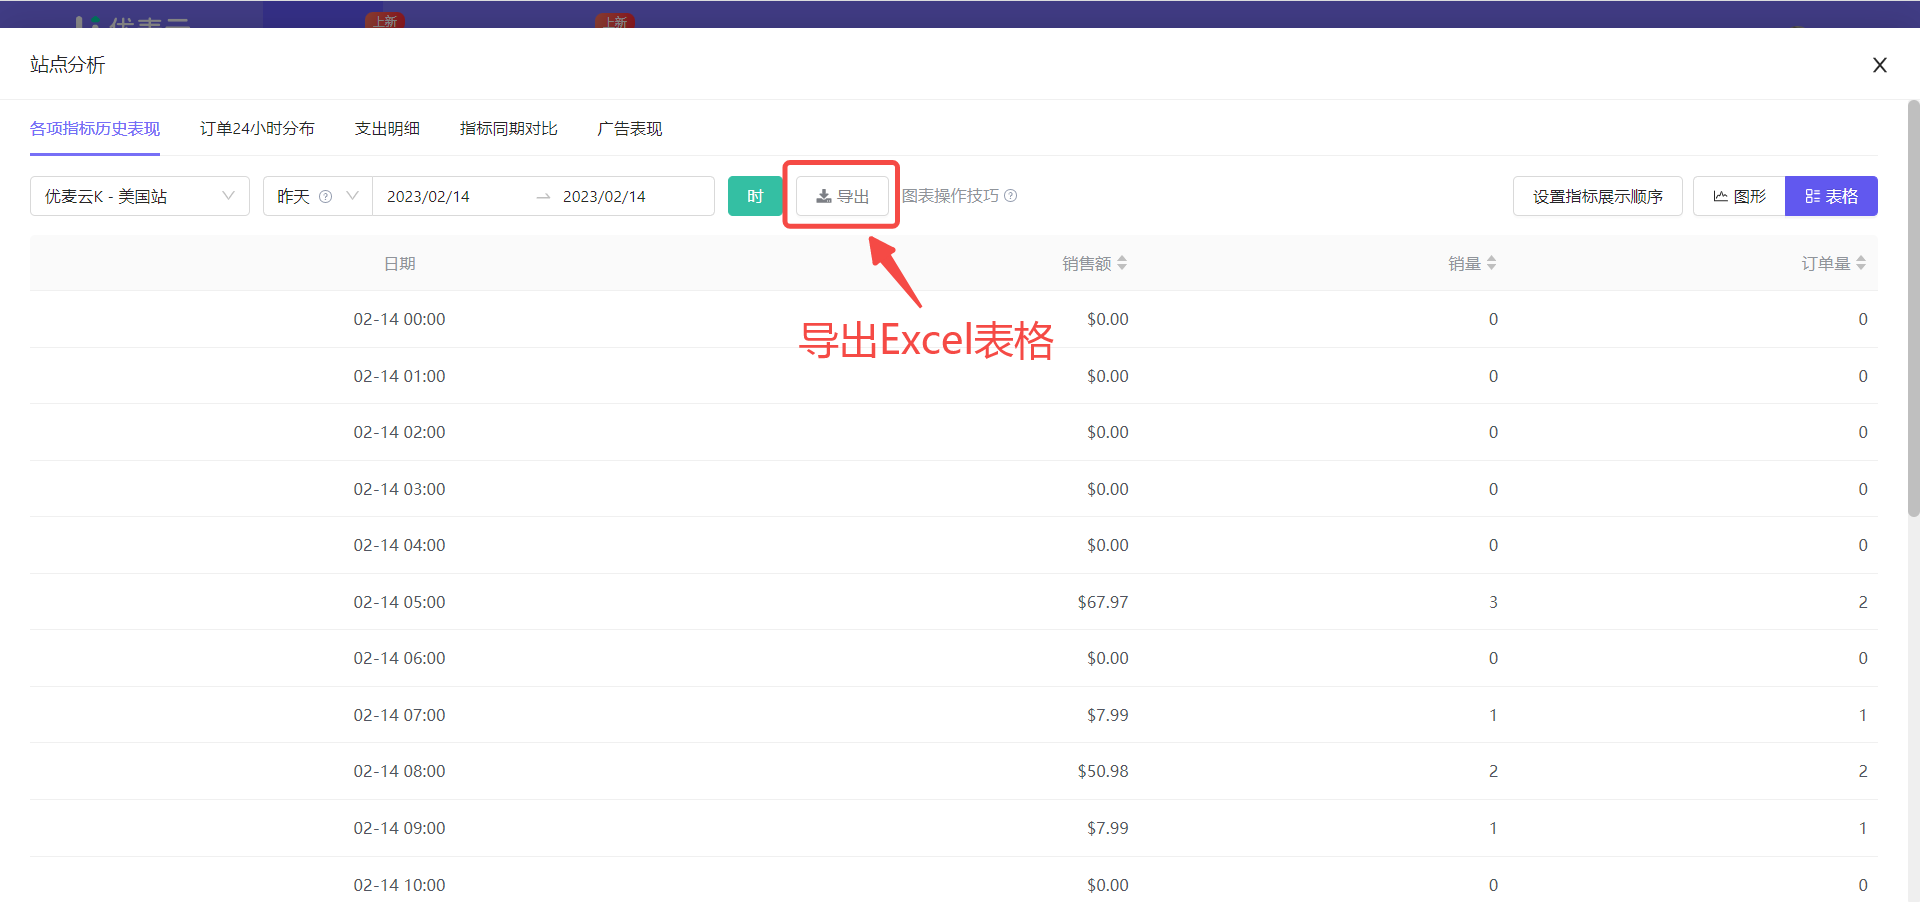
Data Export:
After we finish the analysis, we can export the current analysis data results. The export format is Excel spreadsheet, which is convenient for us to re-organize and analyze.
Click the [Export] button to export with one click.
 +
+
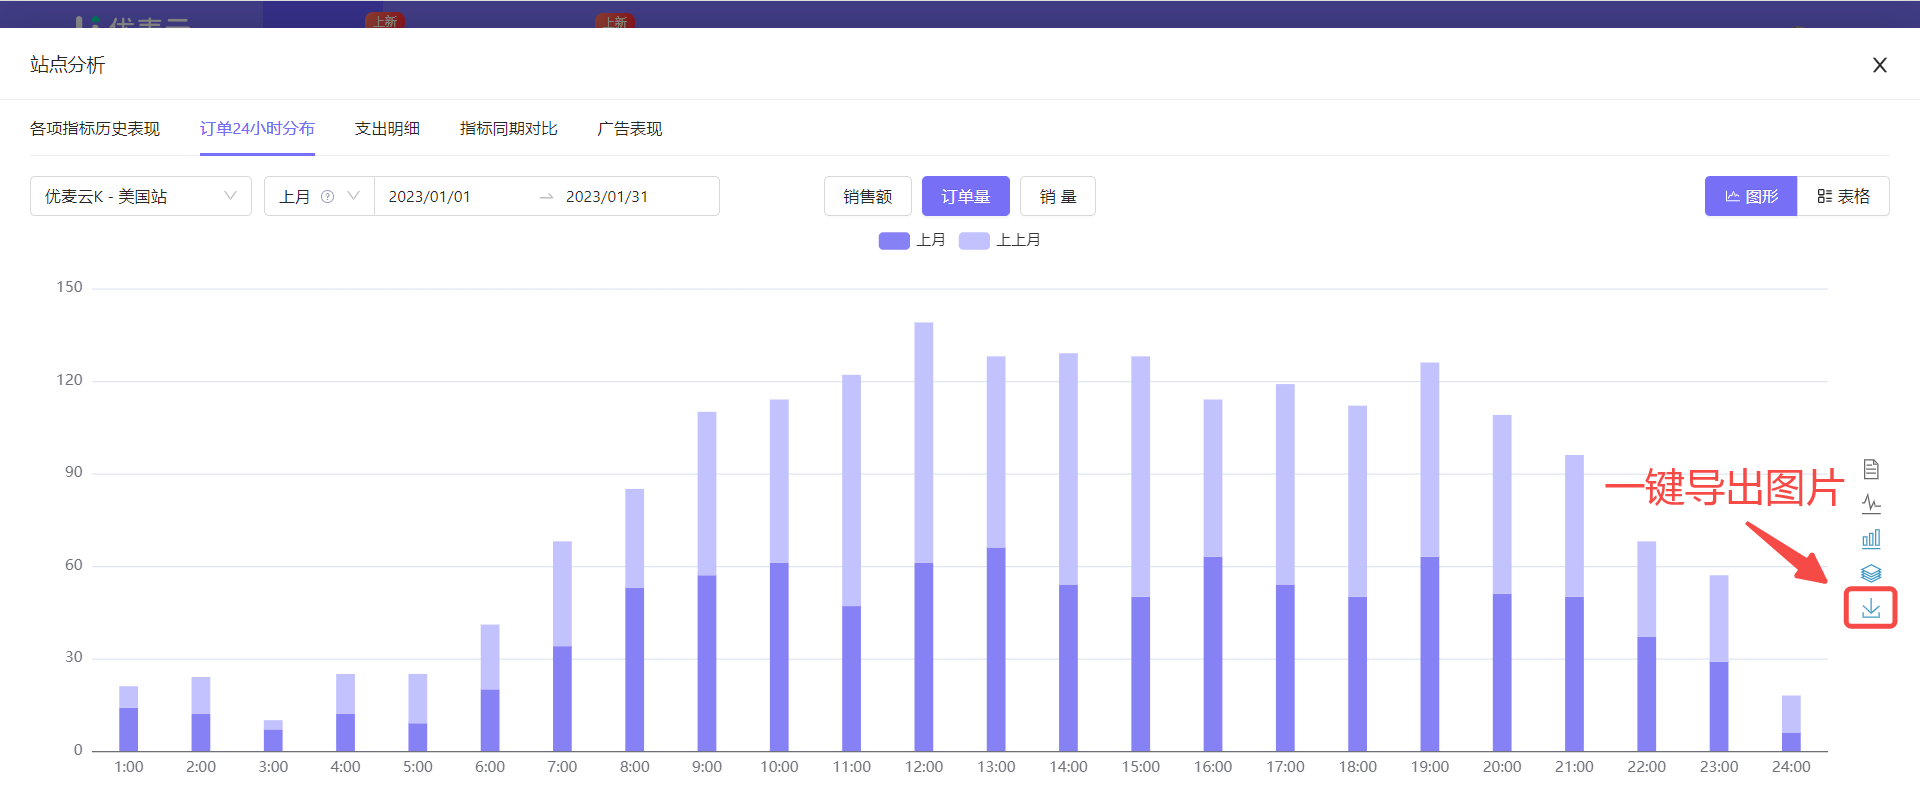
② 24-Hour Order Distribution
The 24-hour order distribution of Marketplace Analysis is mainly to view the 24-hour distribution of order volume, units sold, and sales revenue of the selected marketplace.
It is similar to [Hourly Sales Data for the Last Four Weeks], but also slightly different. The specific differences are as follows:
Hourly Sales Data for the Last Four Weeks: Only data for the last 28 days can be viewed, but it supports viewing the 24-hour order distribution of different products, marketplaces, advertising, and tagged products;
24-Hour Order Distribution: Supports viewing data for the entire time period, but only supports viewing the 24-hour order distribution of marketplace or product dimensions.
 +
+
The data operation method of 24-hour order distribution is as follows:
Take viewing the 24-hour order distribution of last month in chart format as an example.
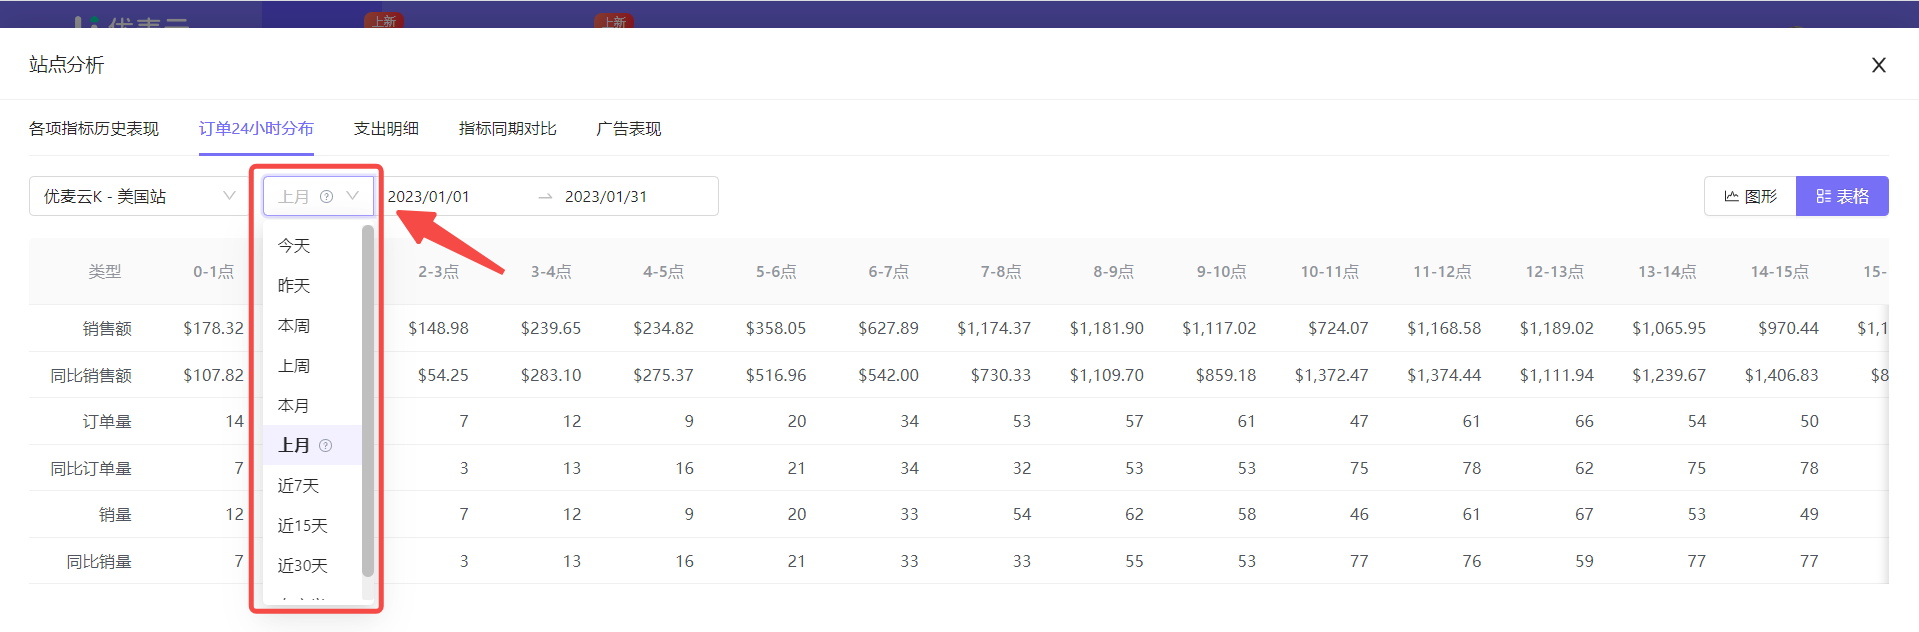
Same as the operation of [Historical Performance of Metrics], we can customize the data time range.
Click the time icon in the upper left corner to set the time range and select [Last Month].
 +
+
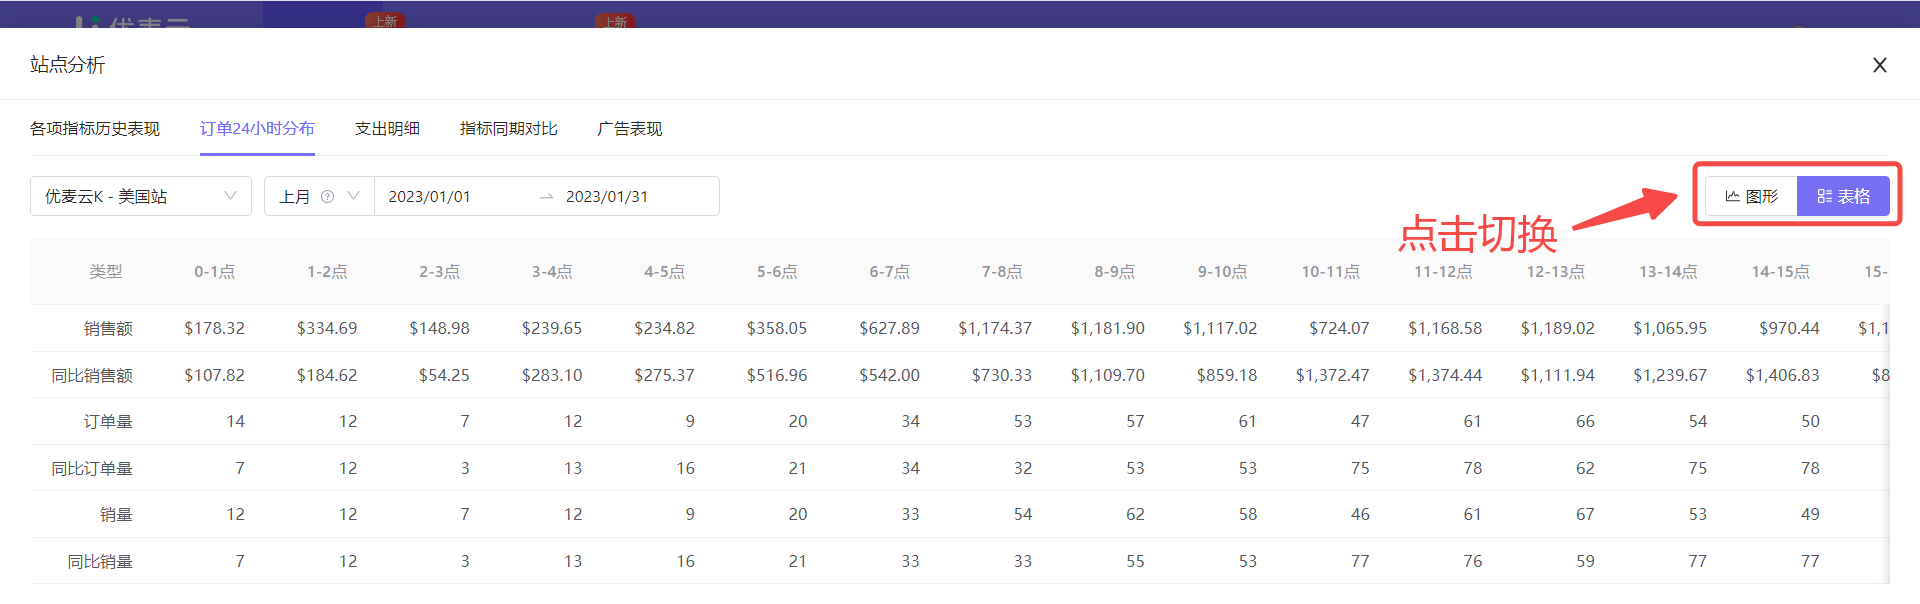
Then select the display format: Graph.
24-hour order distribution has two display formats: graph and table.
The current format is Table. Click the icon in the upper right corner to switch to [Graph] format with one click.
 +
+
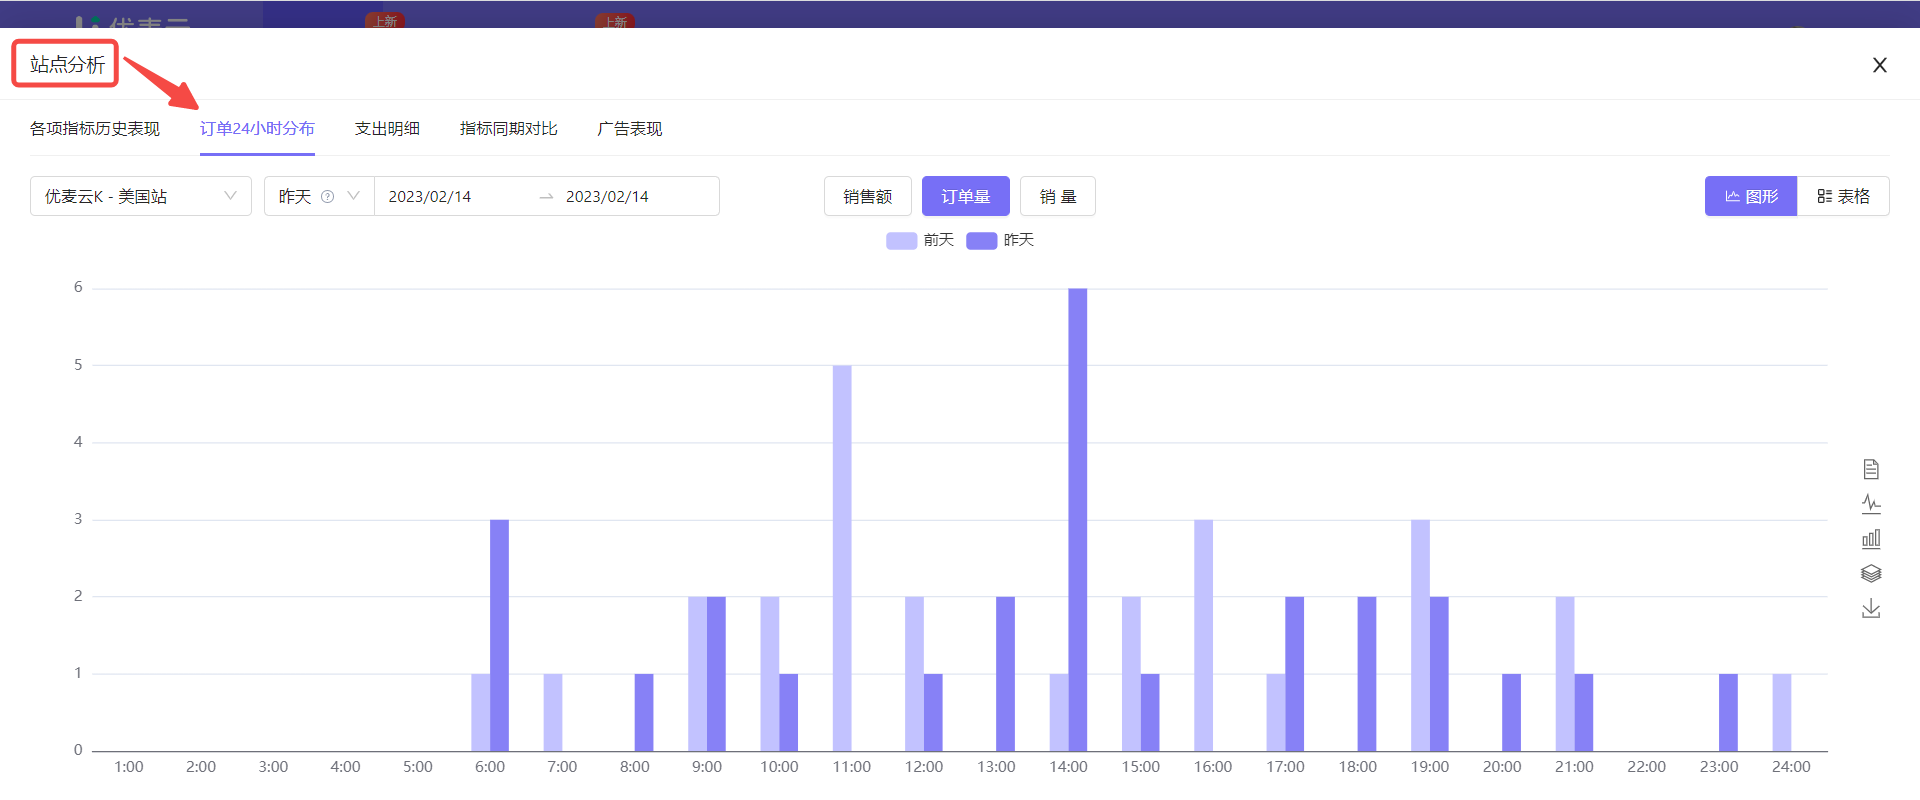
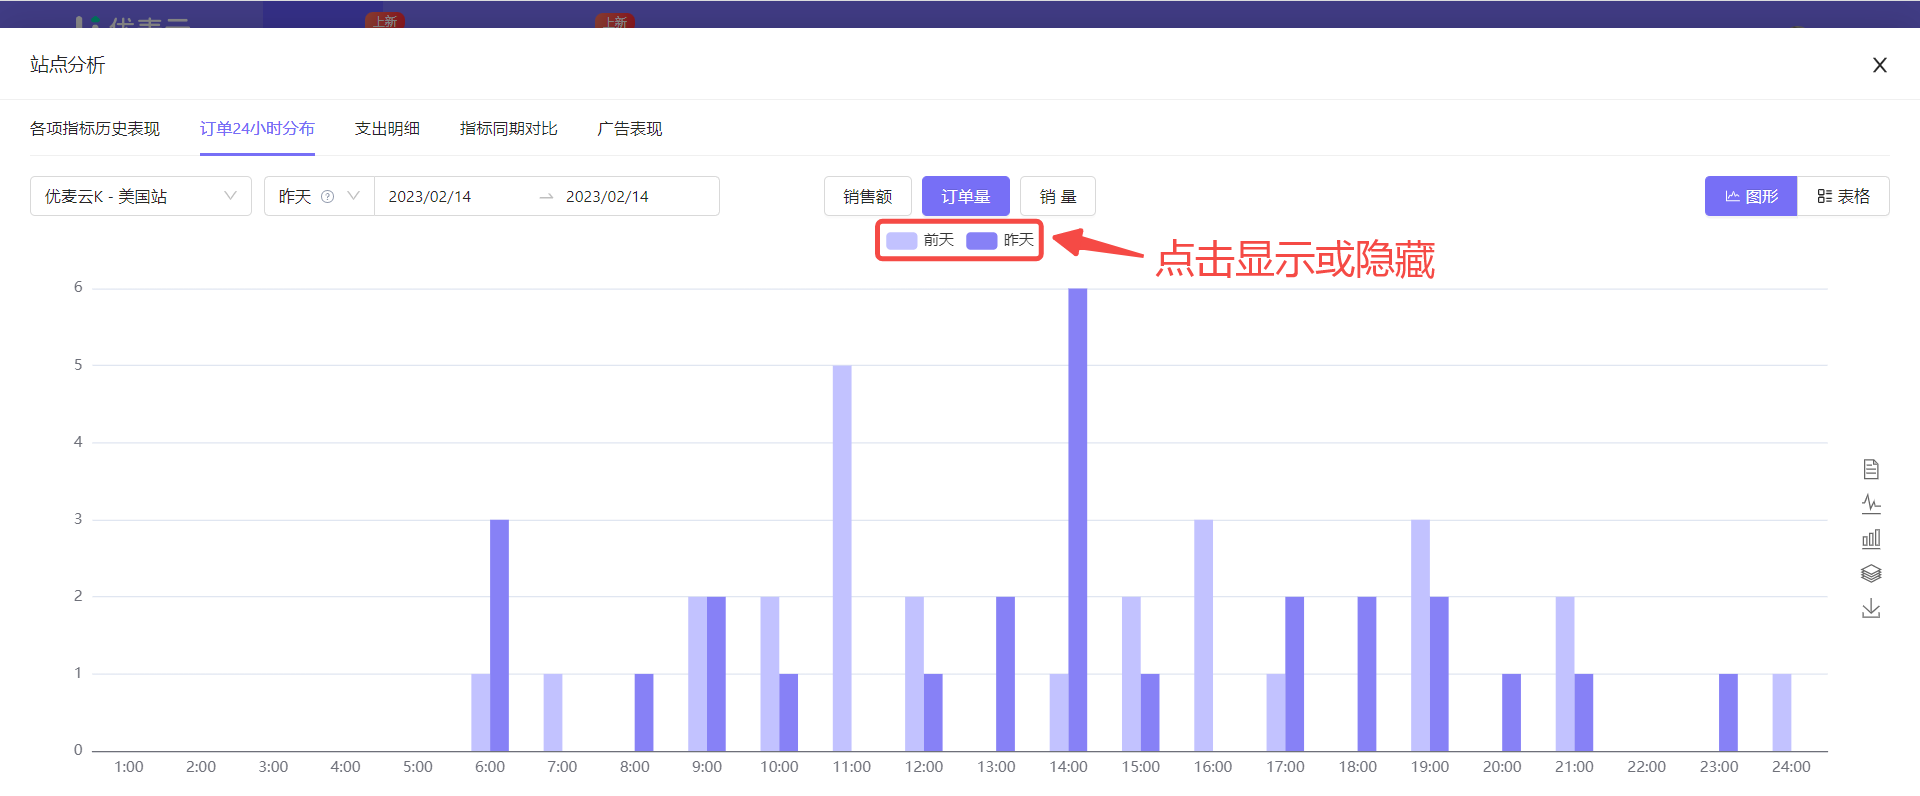
The 24-hour order distribution chart defaults to displaying the 24-hour distribution of 3 metrics: Order Volume, Units Sold, and Sales Revenue.
Click the metric title to switch to view the hourly distribution of the corresponding metric.
The system defaults to viewing order volume data, so we can leave it as is.
 +
+
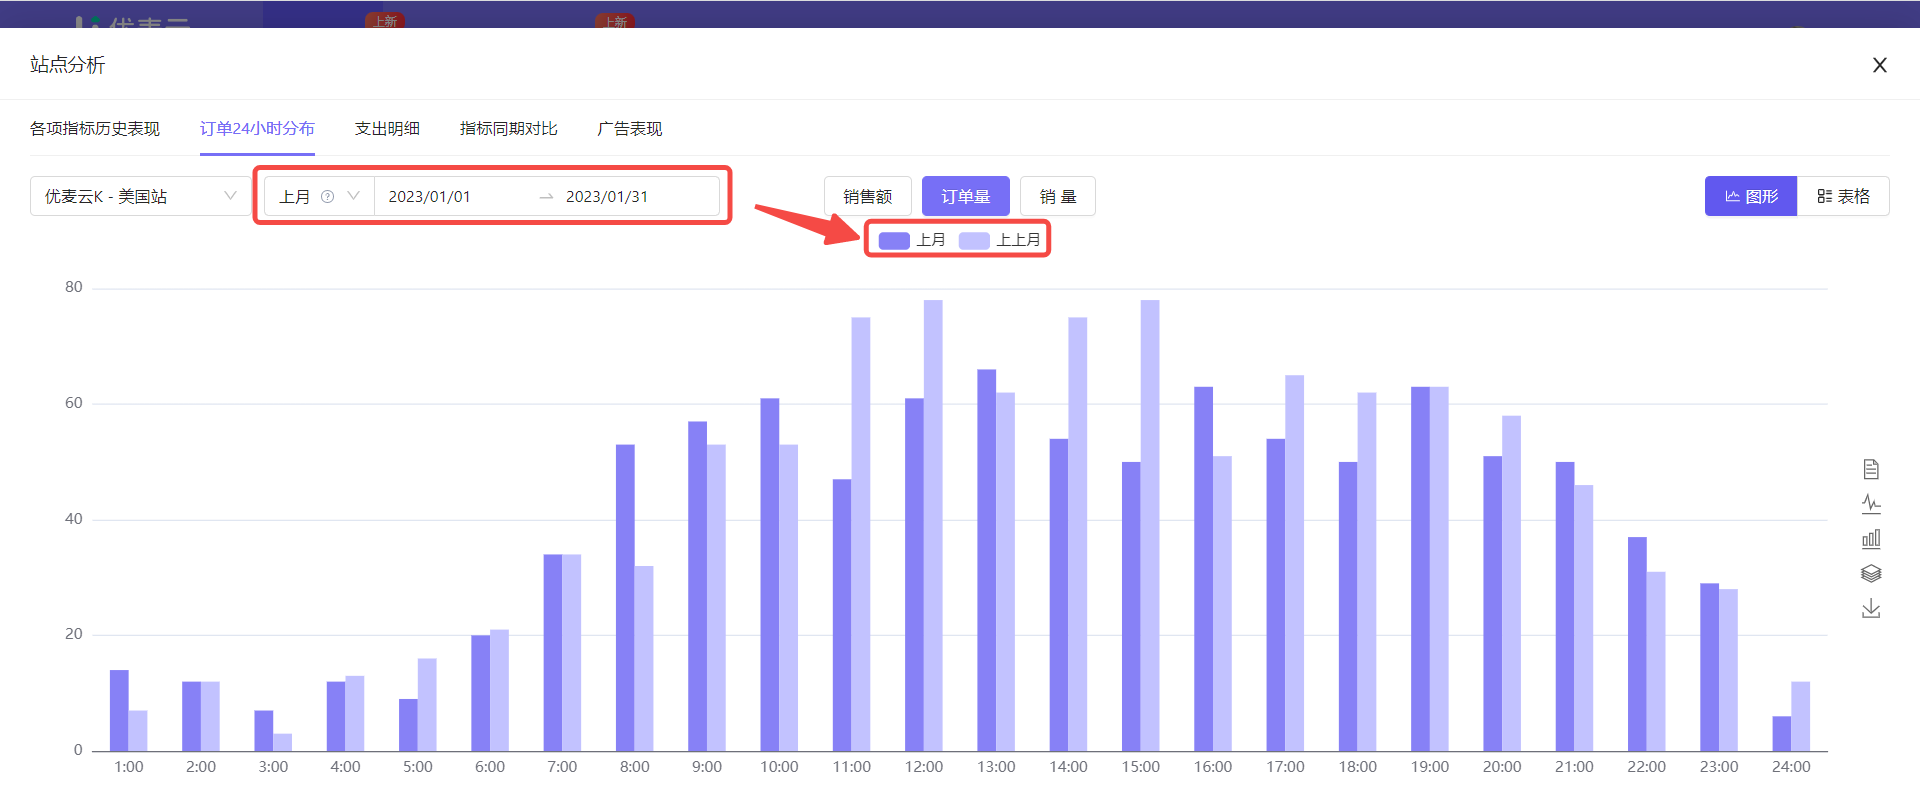
Through the above operations, the 24-hour order distribution data for last month is displayed.
The following is an explanation of the analysis operations.
24-hour order distribution will also synchronously display period-over-period data comparison to facilitate analysis of data changes.
For example: If we choose to view today, the period-over-period data for the same period yesterday will be displayed. If you choose the last 7 days, the period-over-period data will be the previous 7 days. If it is last month, the period-over-period data will be the month before last month, and so on.
 +
+
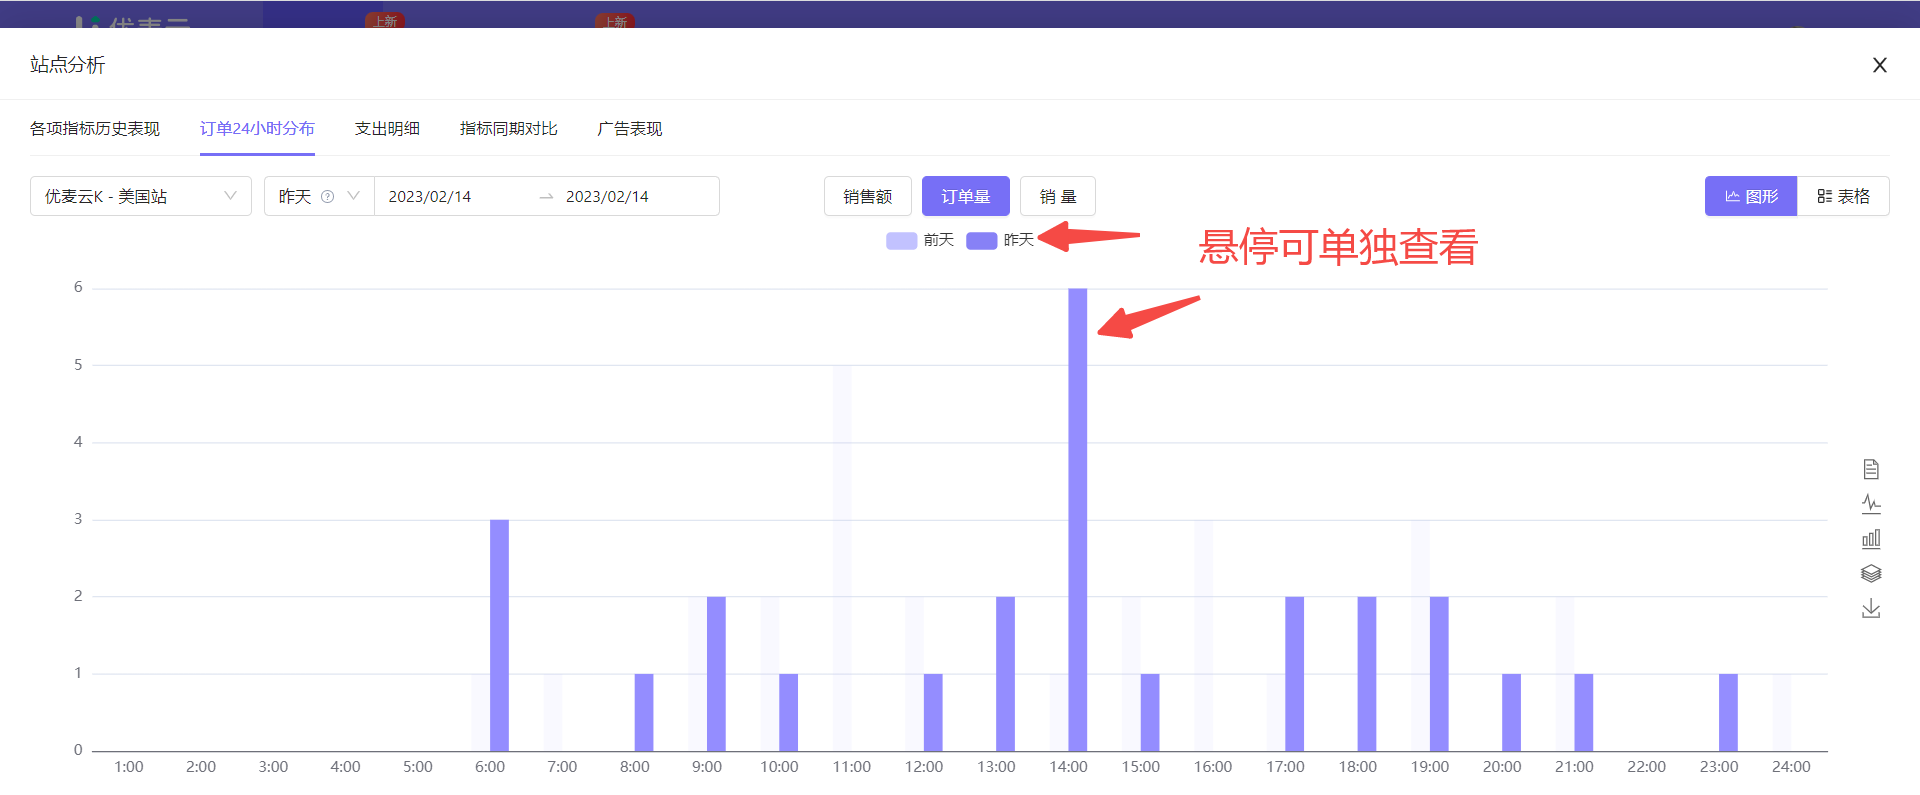
Click the period-over-period metric icon to choose to view or hide the trend data of the metric separately.
 +
+
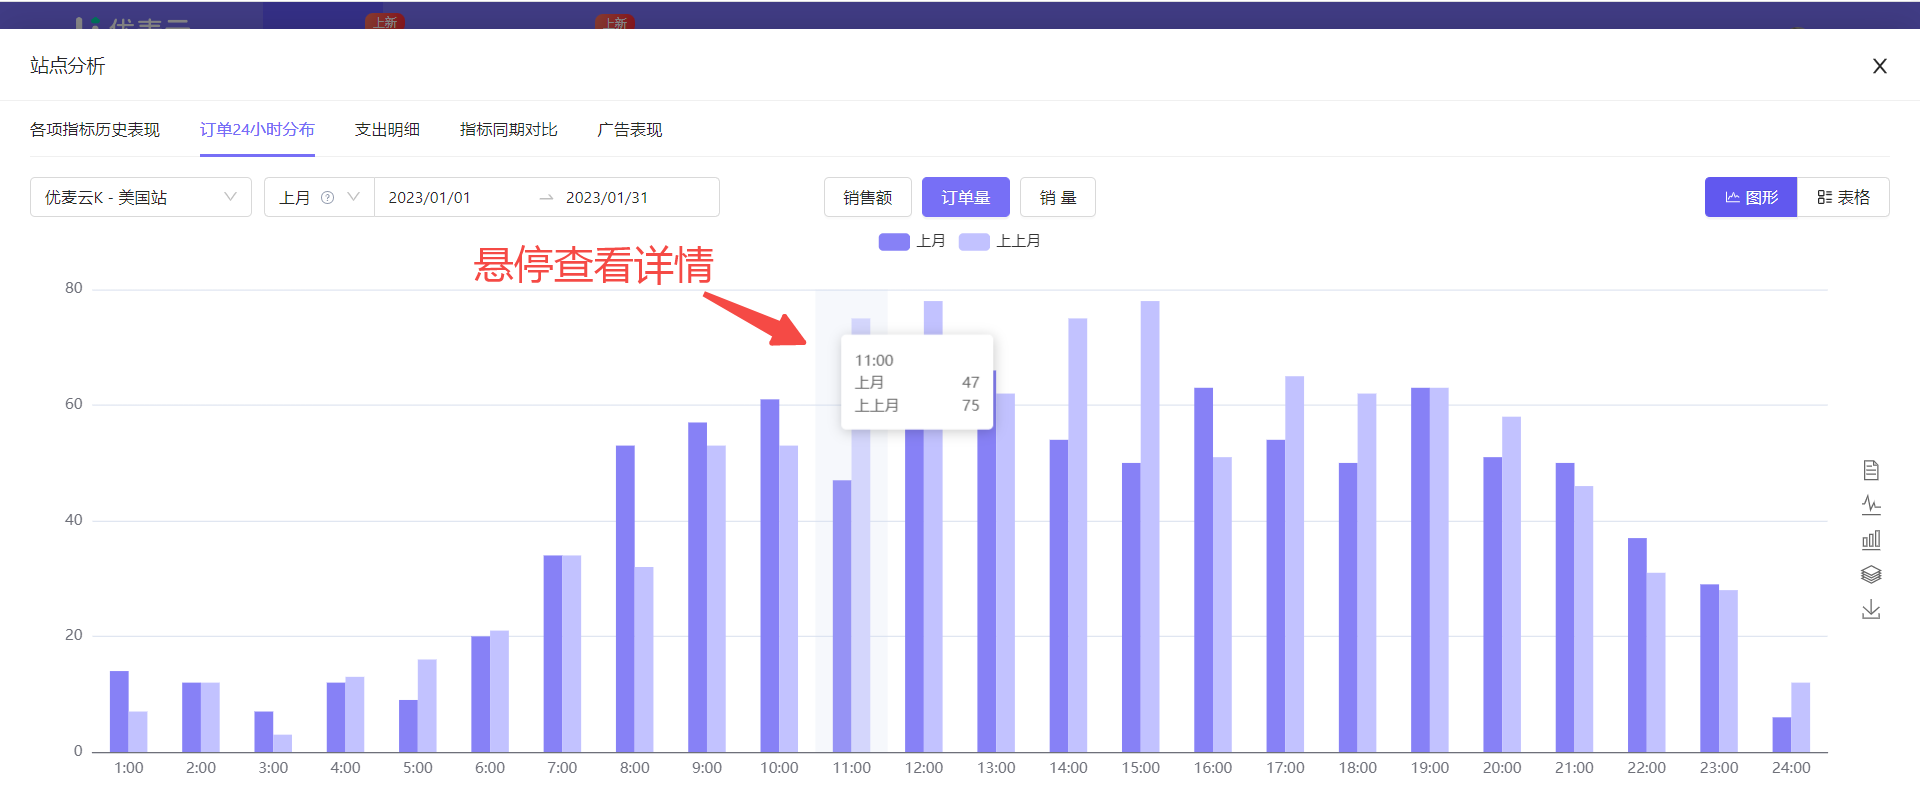
Hover the mouse over the period-over-period metric or the corresponding data in the chart to view the trend of the data separately.
 +
+
Hover the mouse over the graph in the chart to also view the details of the data separately.
 +
+
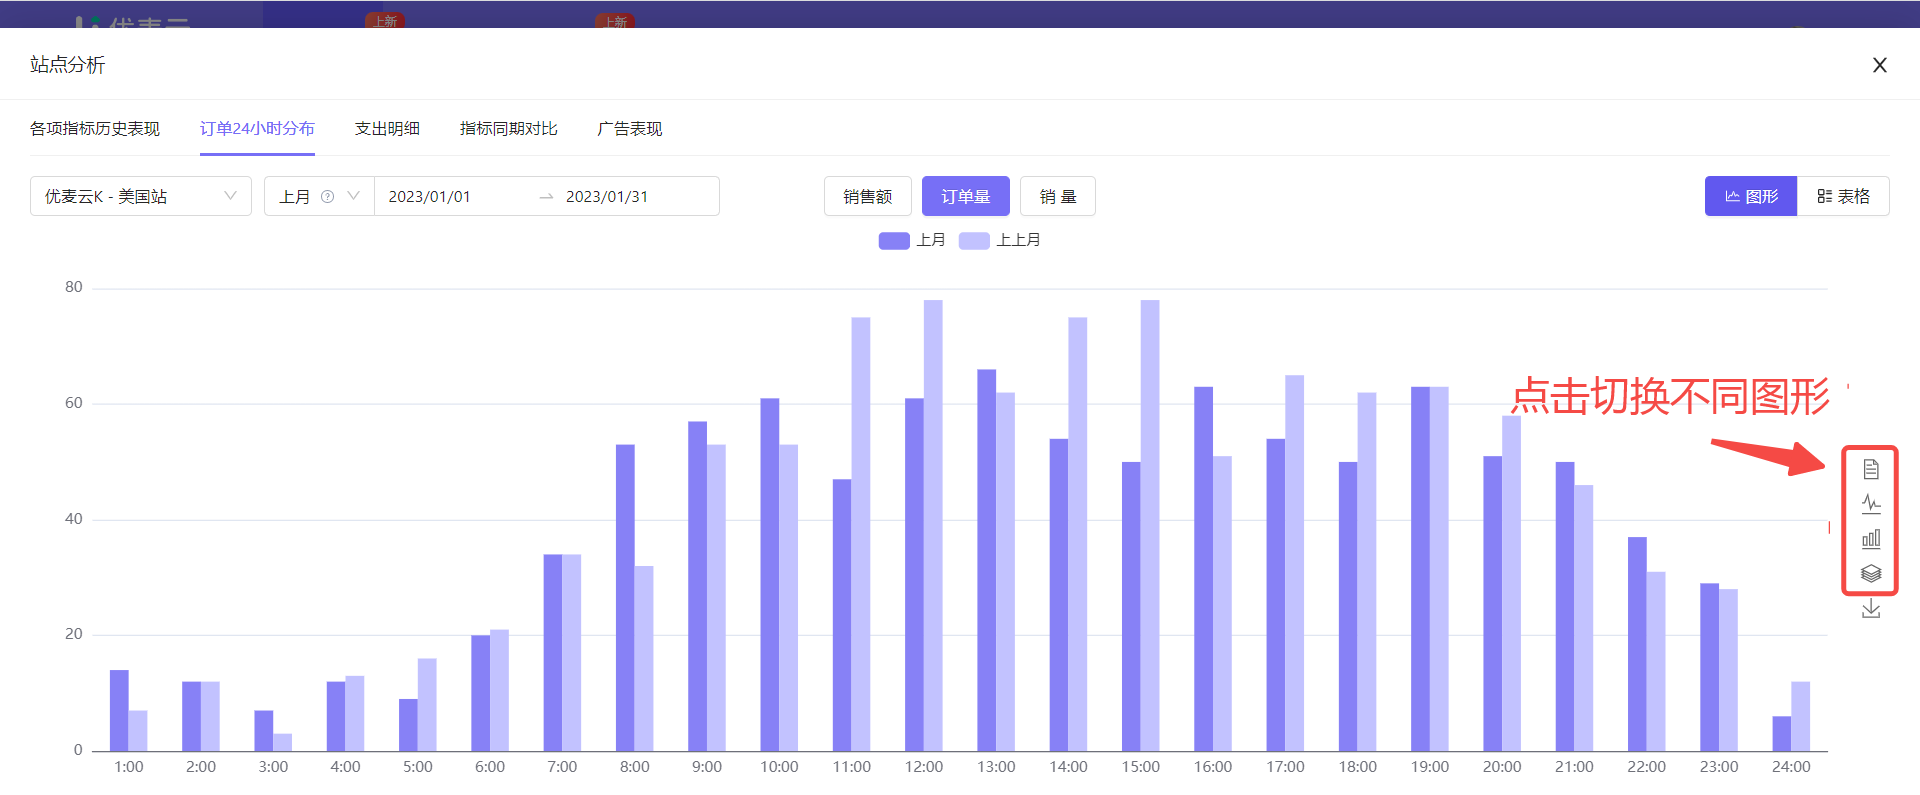
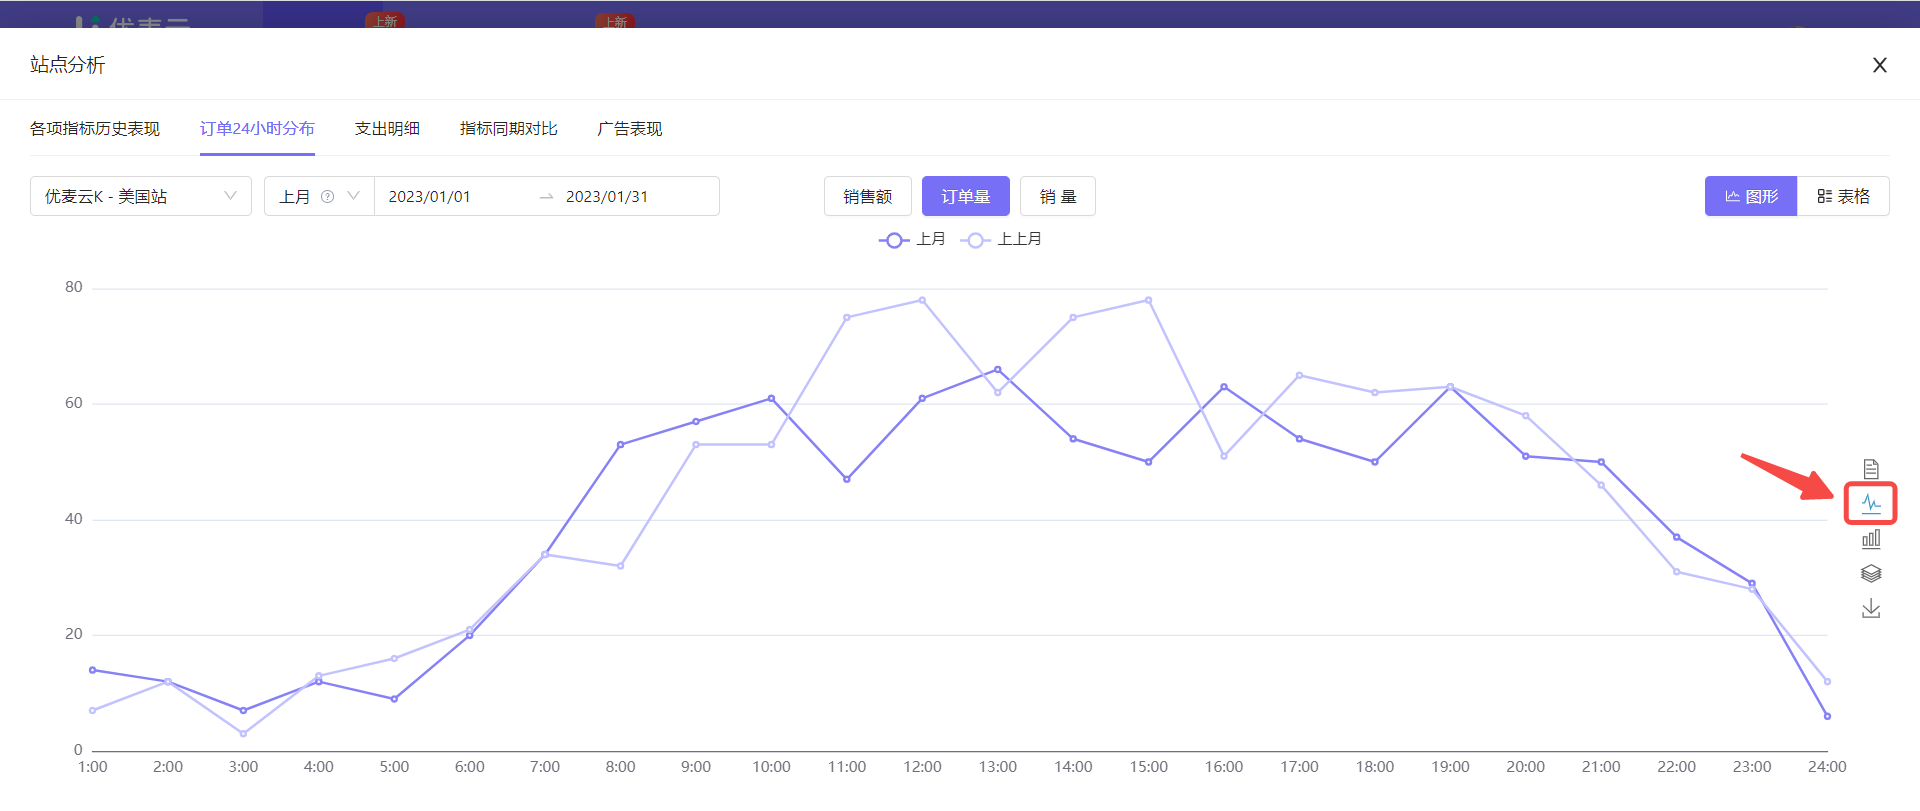
When we choose the [Graph] display format,
In addition to bar charts, you can also switch to line charts, stacked bar charts, or copyable table charts to adapt to the different analysis habits of seller friends.
Click the icon on the right to switch with one click.
Note: The operation methods of [Graph] charts are basically the same as the chart operation tips of [Historical Performance of Metrics], which will not be explained here again.
 +
+
Line Chart:
 +
+
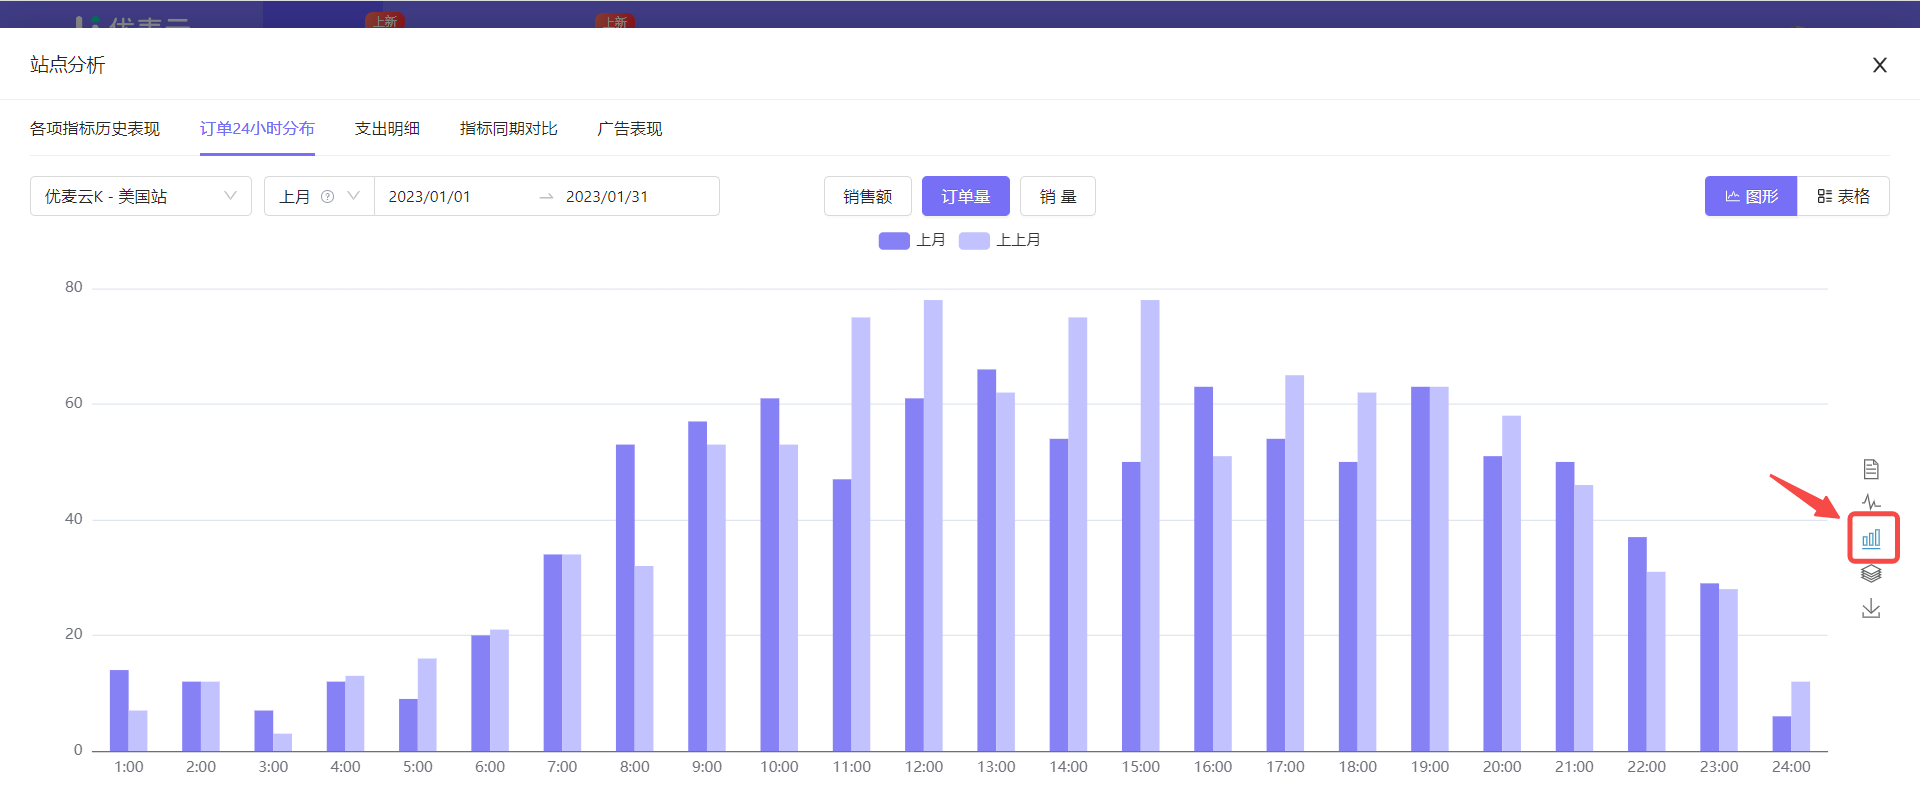
Bar Chart:
 +
+
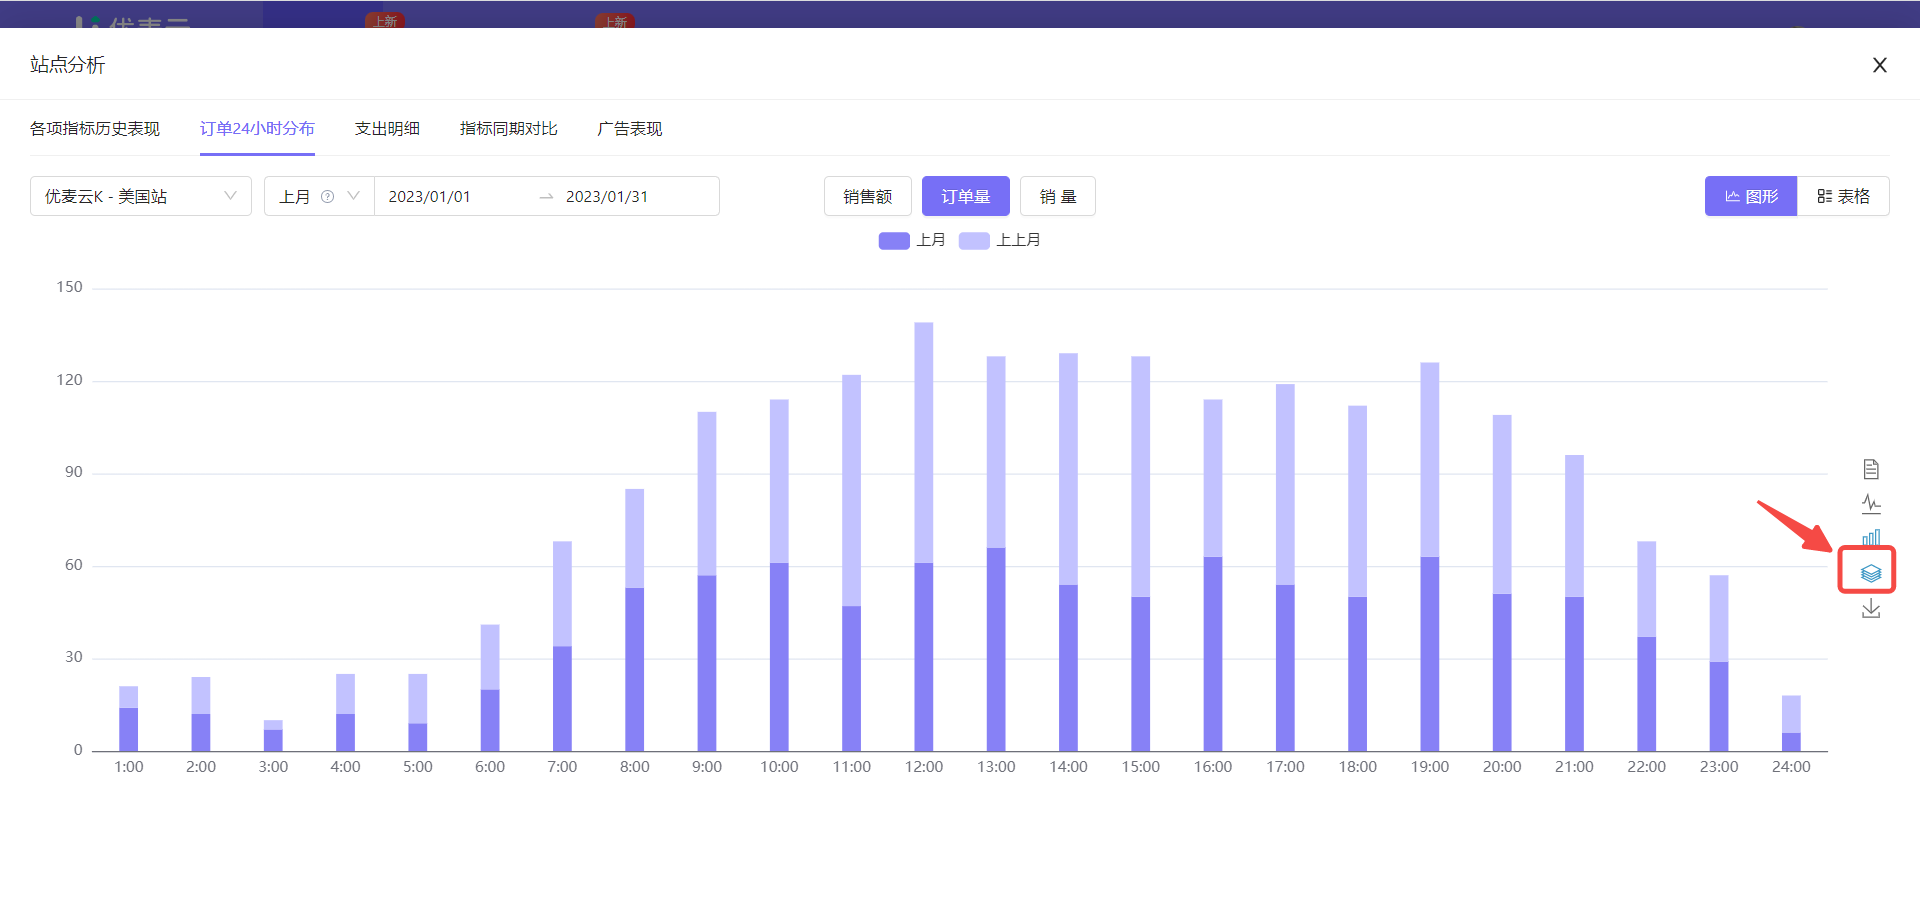
Stacked Bar Chart:
 +
+
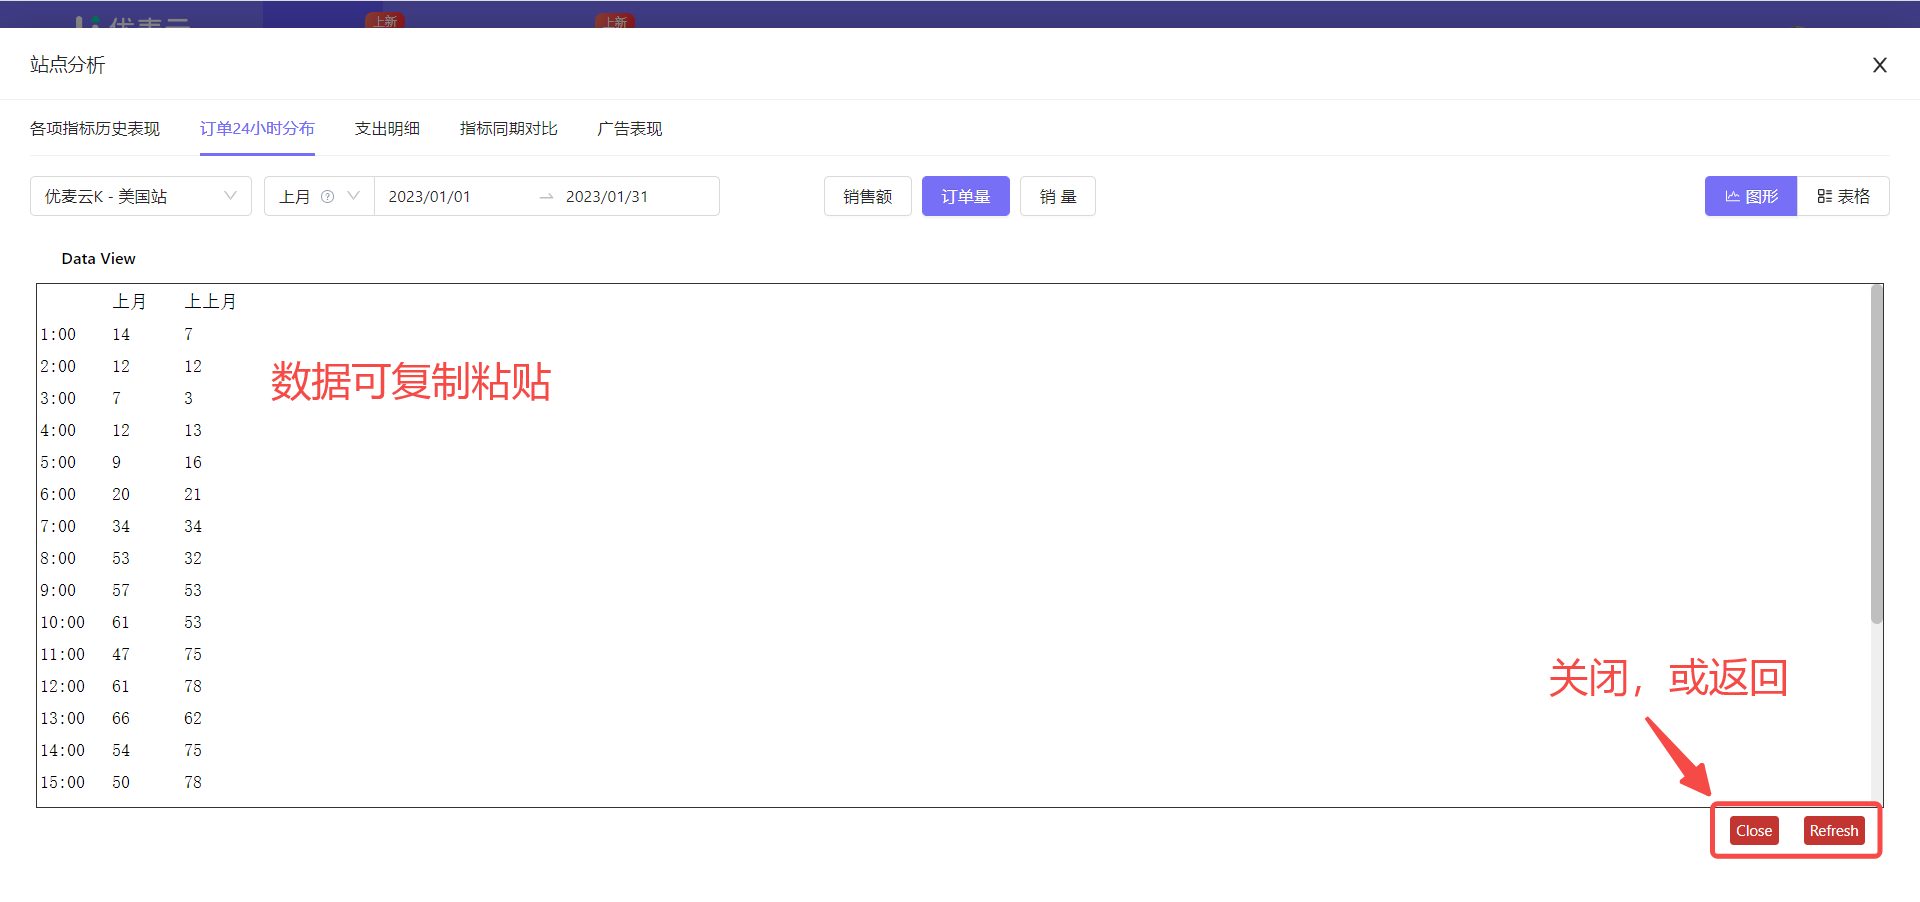
Copyable Table:
 +
+
When it is in chart display format, the chart supports exporting, exporting to image format, which is convenient for us to make reports.
Click the Export button to export with one click.
 +
+
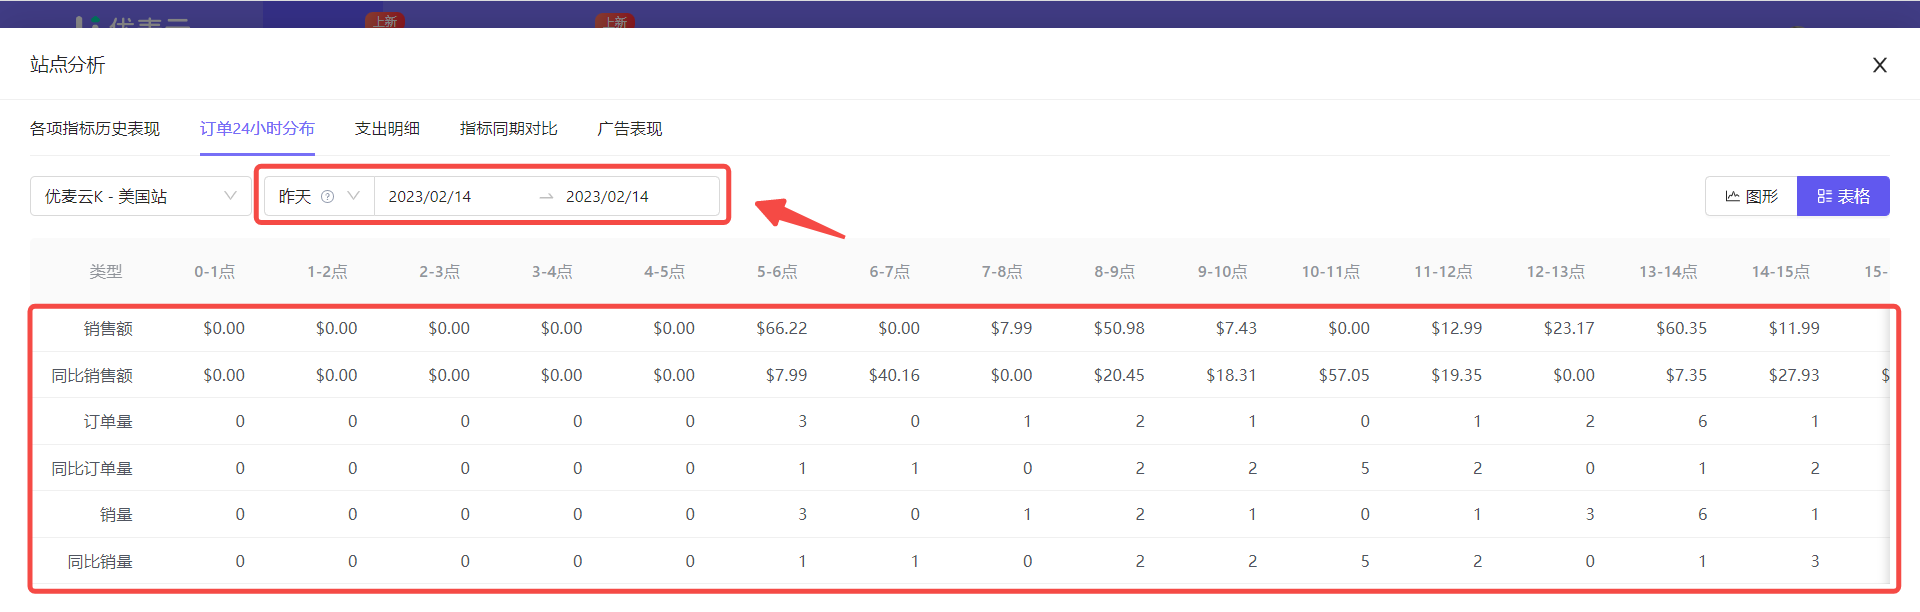
When we choose the [Table] display format,
It displays the 24-hour data of order volume, units sold, and sales revenue, as well as their period-over-period comparison data.
Note: Table data here does not support exporting!
 +
+
③ Order Area Distribution (Newly Launched)
Order area distribution displays the order area distribution of the current marketplace, as well as the area distribution data of refunds and exchanges. Through the order area distribution data, we can understand which areas the orders are from.
If the marketplace sells similar products, it is also equivalent to summarizing and analyzing the main order areas of this type of product. Combined with the [Keyword Ranking] and [Keyword Position Tracking] features, it helps us more accurately promote keywords and obtain more accurate orders.
At the same time, we can also efficiently analyze the return and exchange areas and reasons, helping us obtain first-hand buyer feedback, thereby optimizing products and improving profit margins.
 +
+
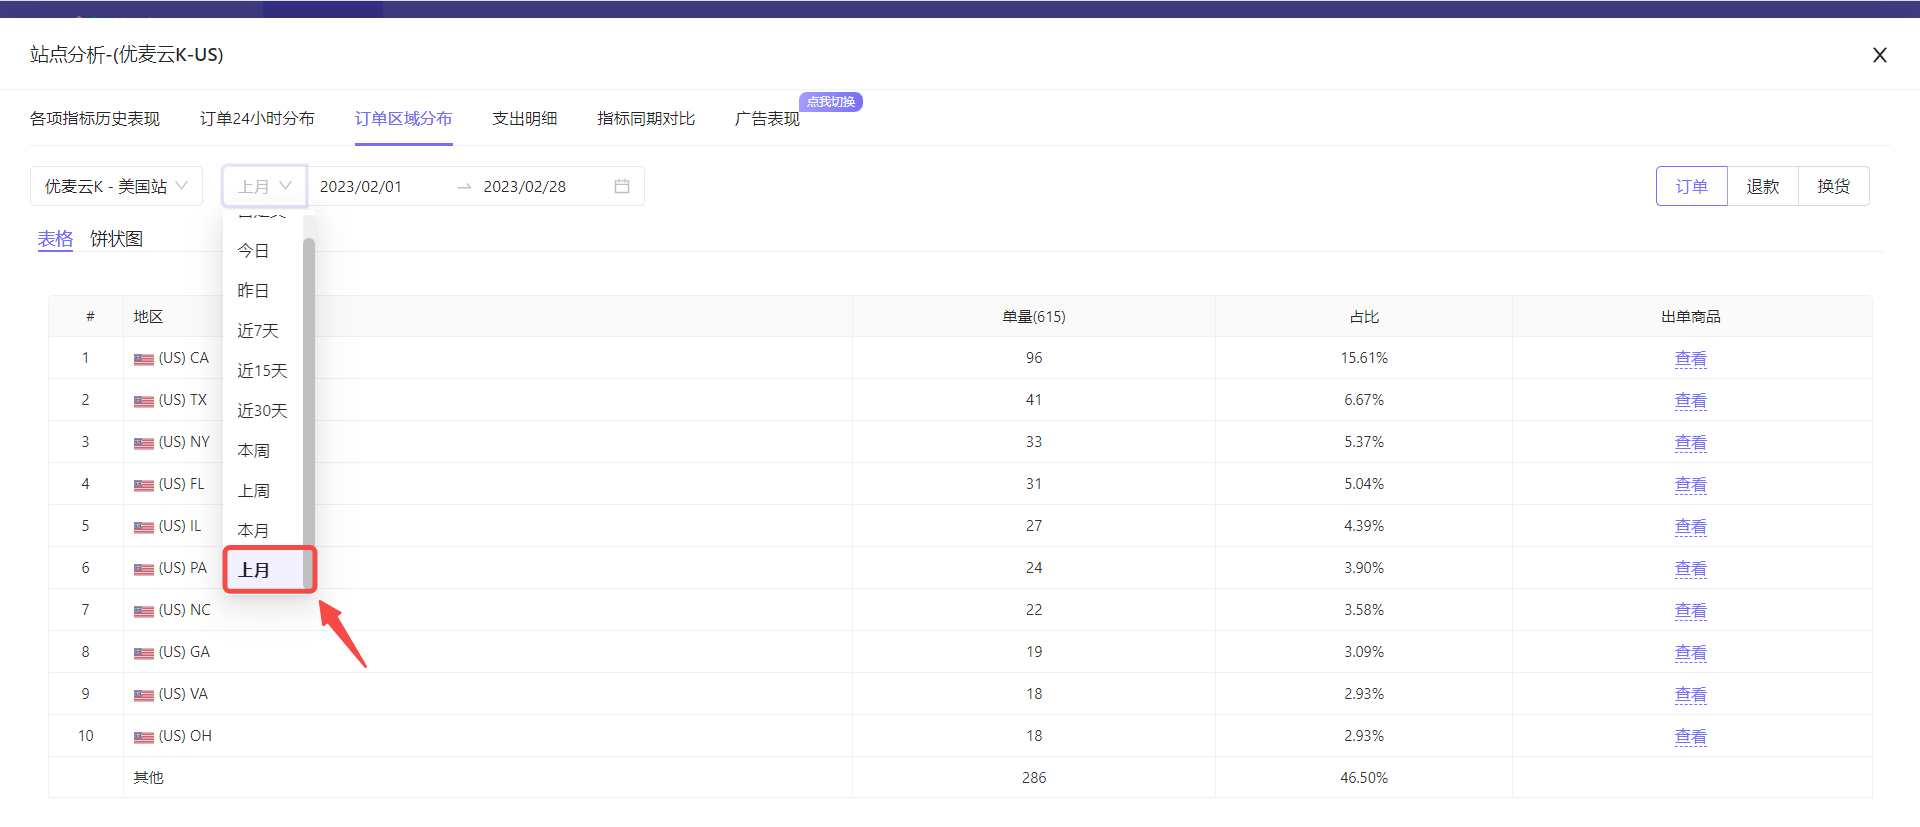
Take analyzing the order and return/exchange area distribution of SellerSpace K - US marketplace last month as an example.
First, select the data time: Last Month.
We can customize the data time range. However, it is recommended to choose a time period with a larger span for analysis.
Due to some pending orders, Amazon may return 0 data within a certain period, including order address data. At this time, there are more orders with unknown order areas, which is not convenient for analysis.
 +
+
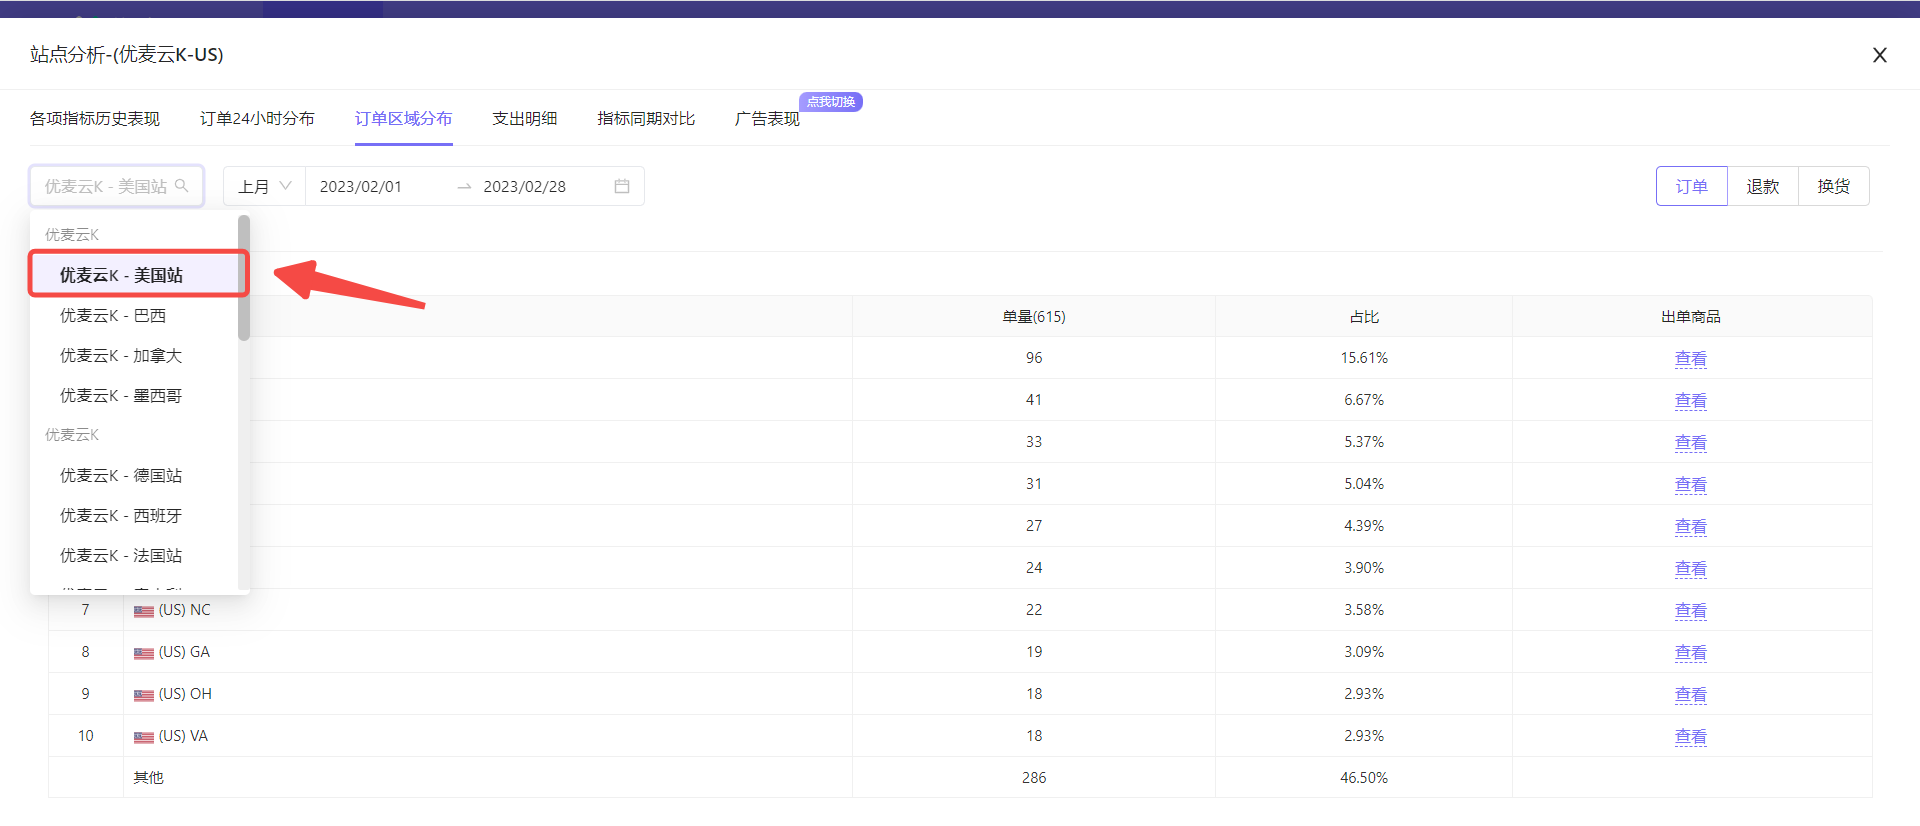
Then, select the marketplace: SellerSpace K - US Marketplace.
Click the marketplace selection button in the upper right corner to select with one click.
 +
+
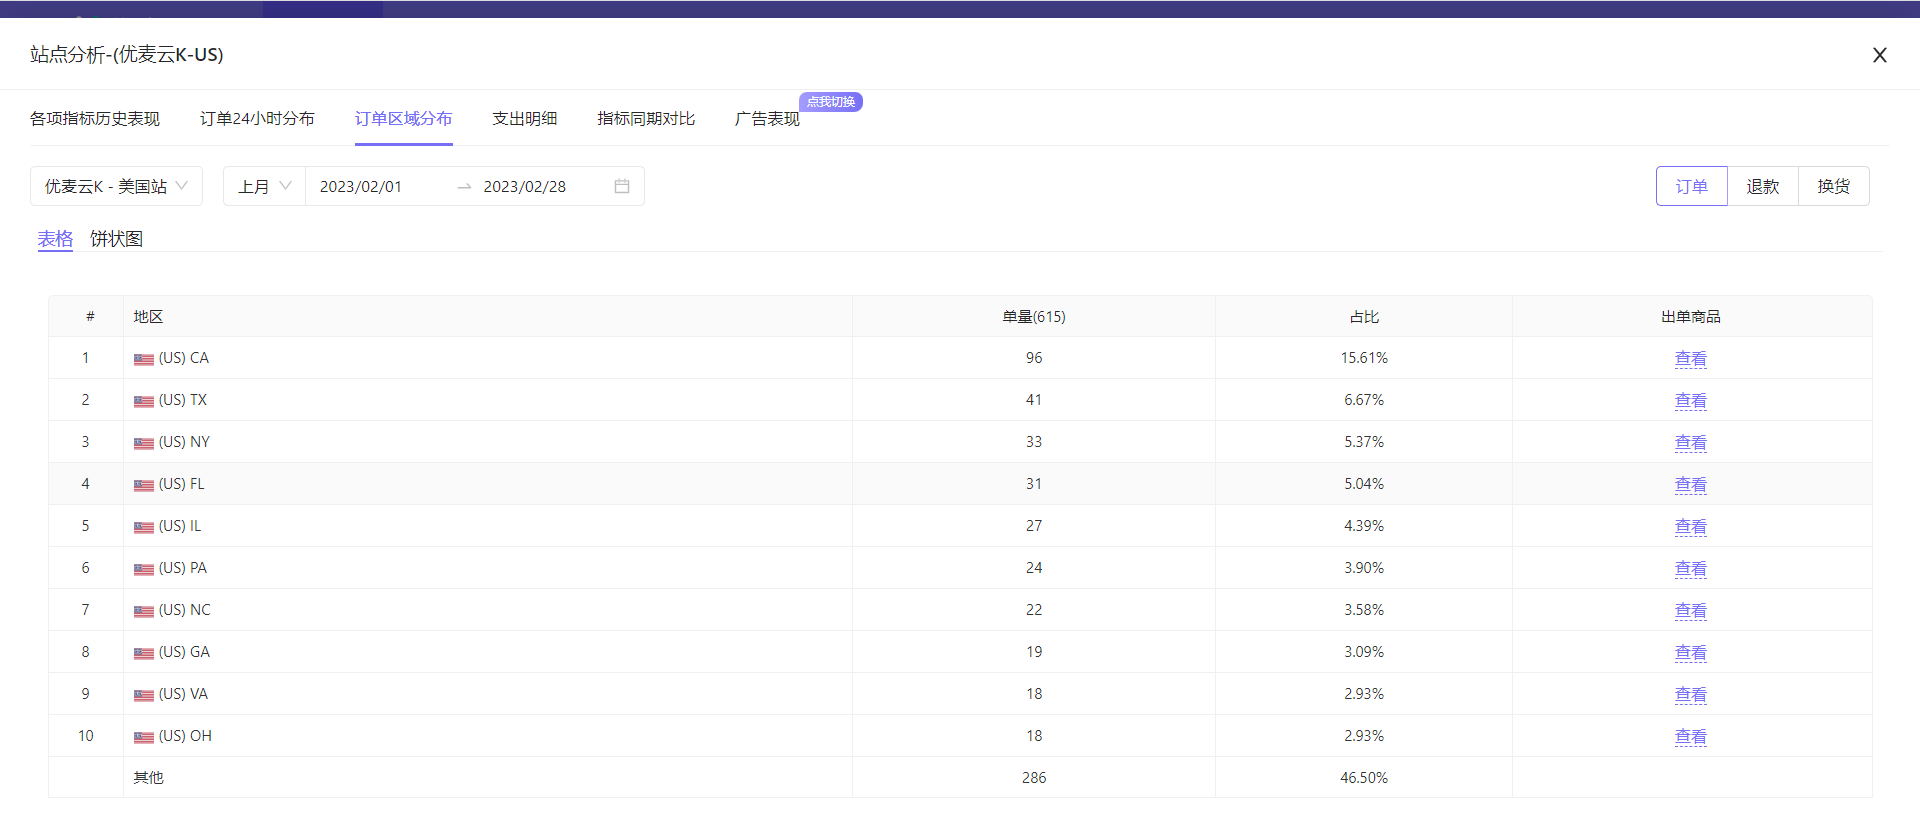
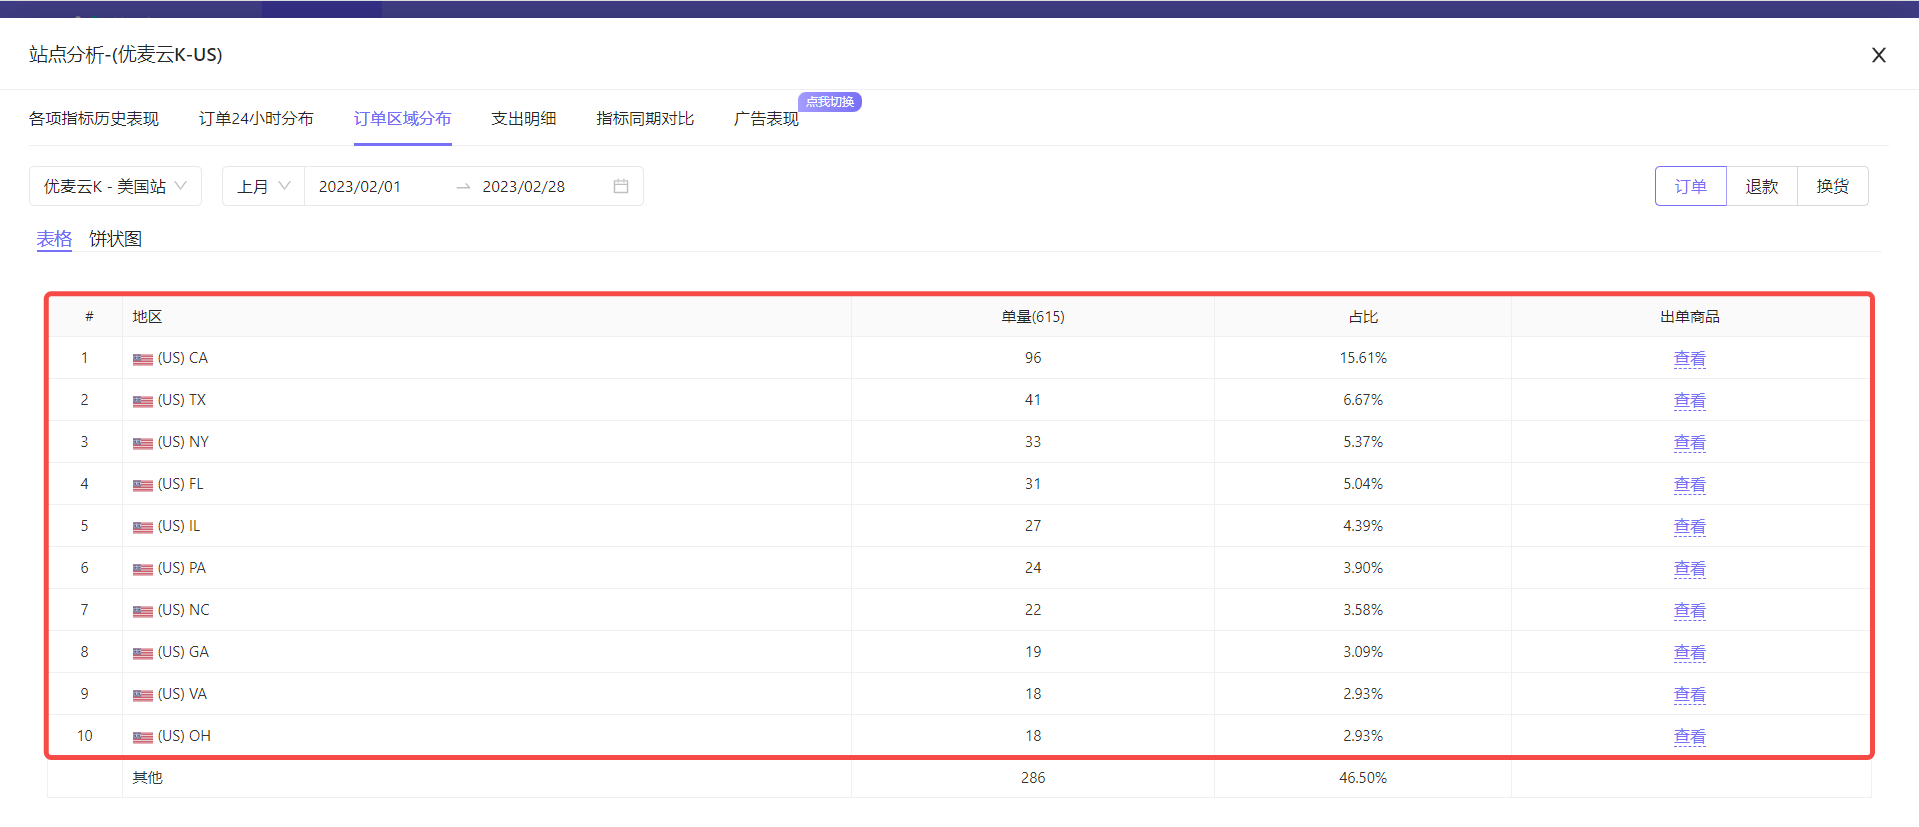
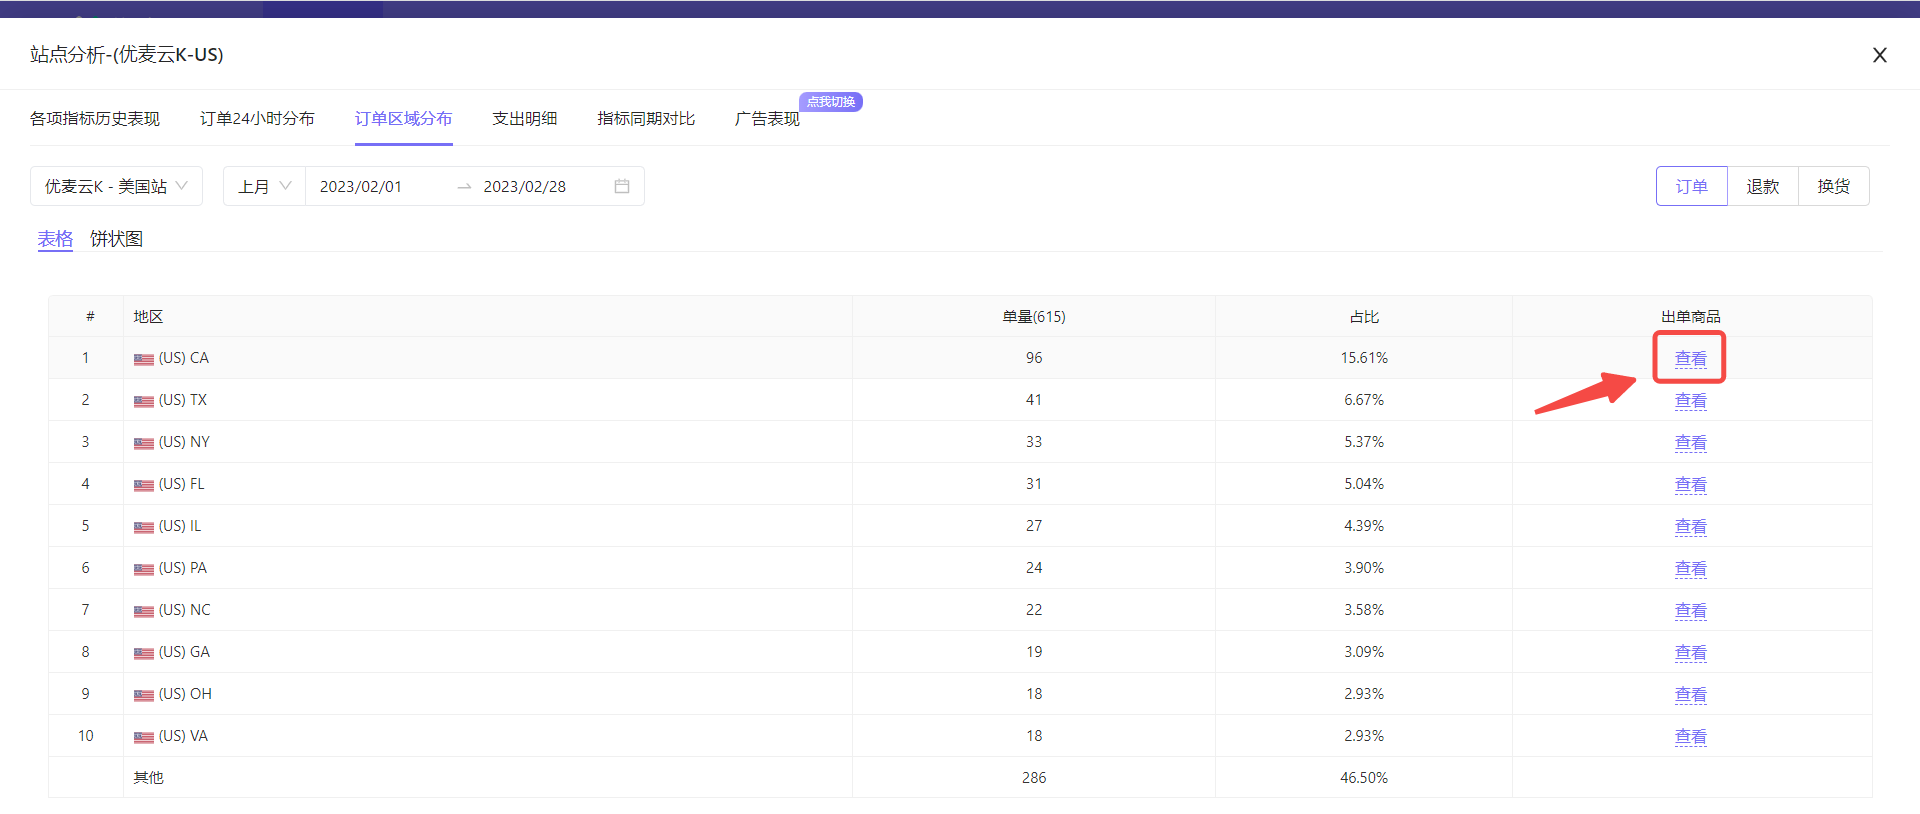
After selection, the system will automatically display the top ten order areas in terms of order volume in the orders of the marketplace last month in table format.
 +
+
Among them, in addition to specific areas, it may also include two data points: Unknown and Other:
- Unknown: Orders for which the address was not obtained, such as pending orders, often appear in recent time periods
- Other: Addresses with order volume outside the top ten are collectively classified as "Other"
Data for the last 15 days:
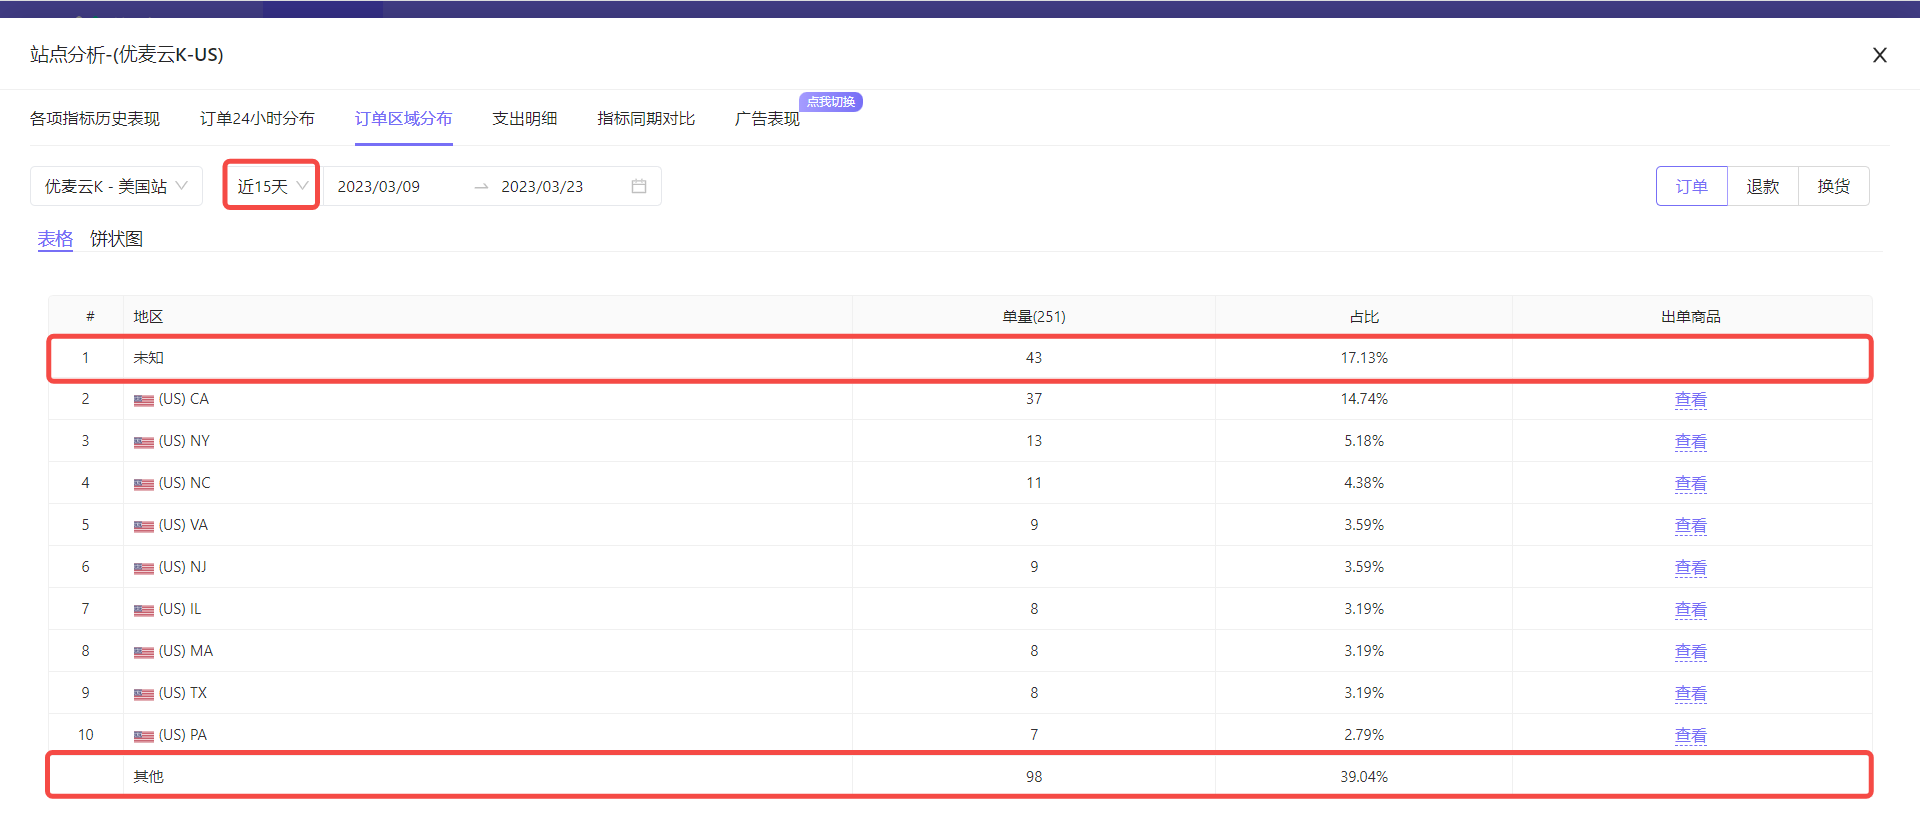 +
+
Data for last month:
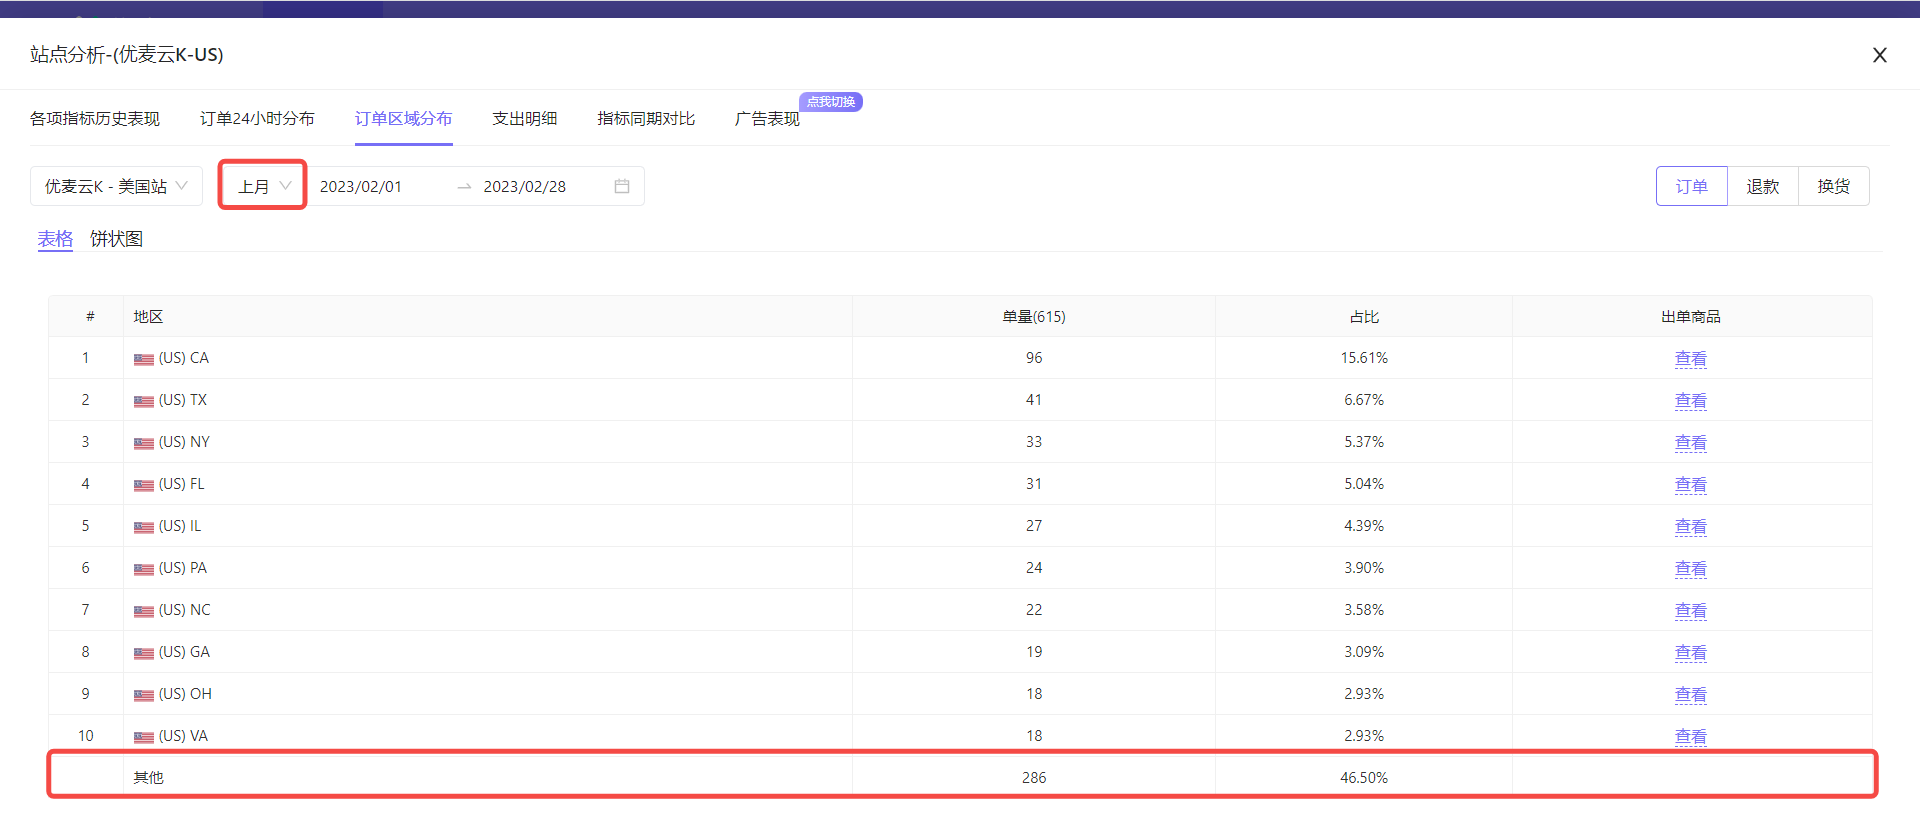 +
+
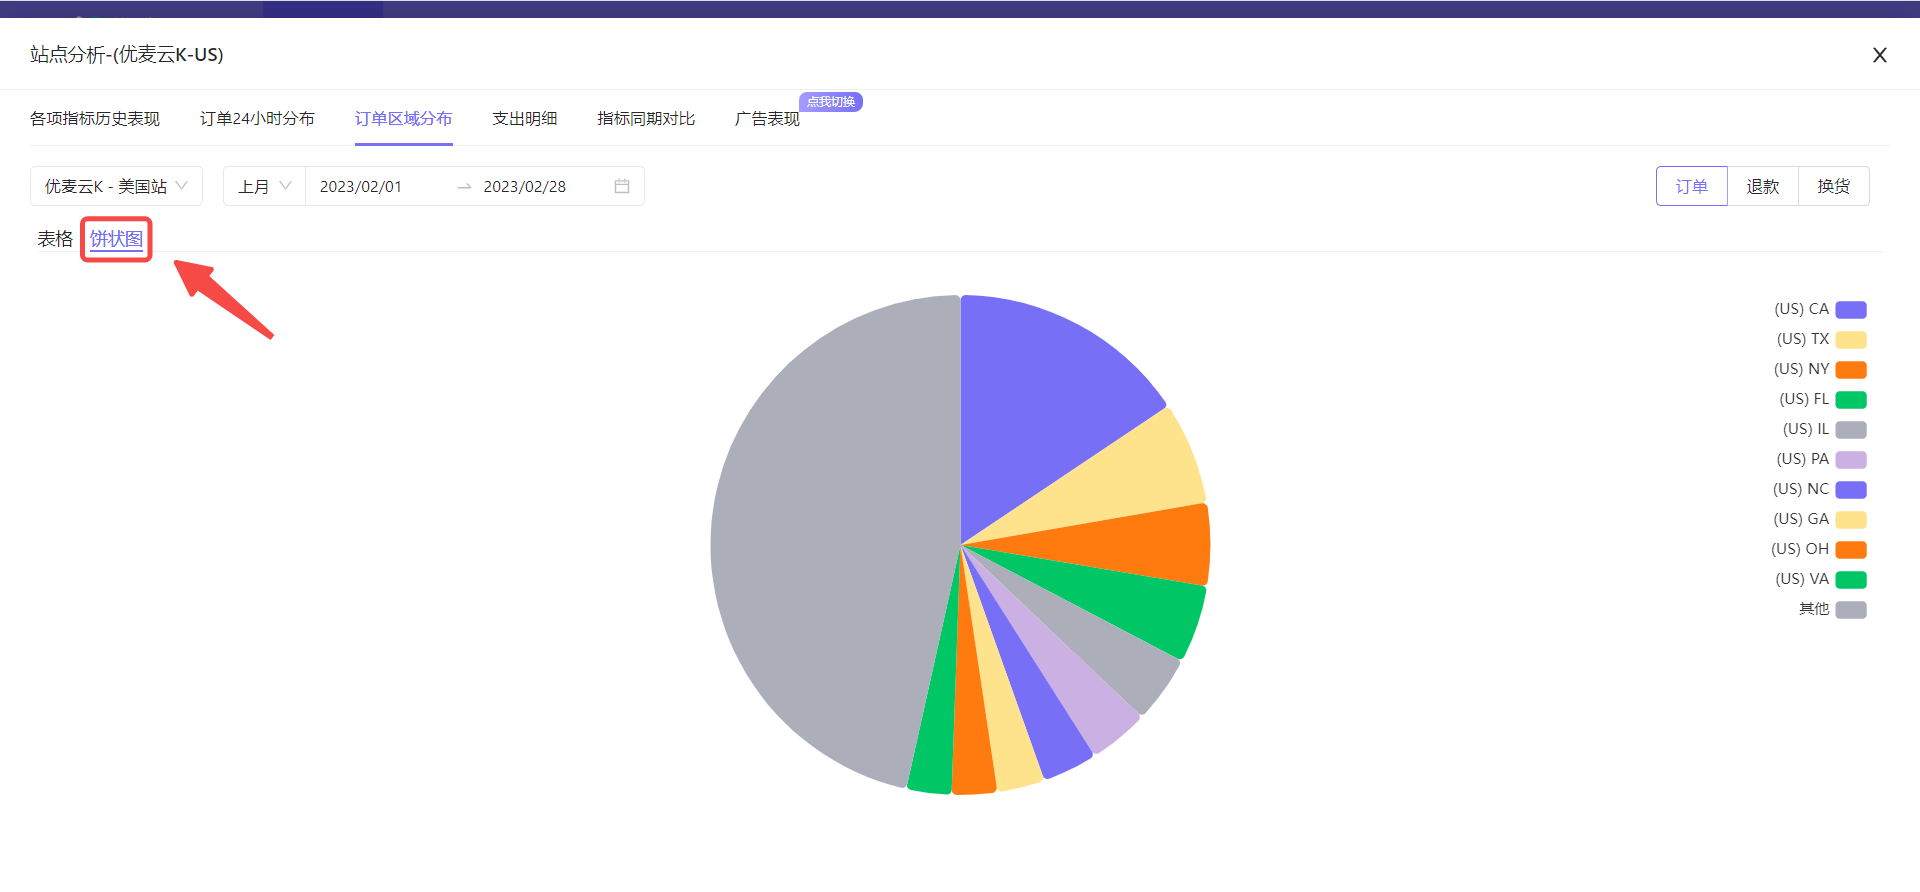
In addition to table format, we can also view the top ten area information in pie chart format.
Click the [Pie Chart] button to switch with one click.
 +
+
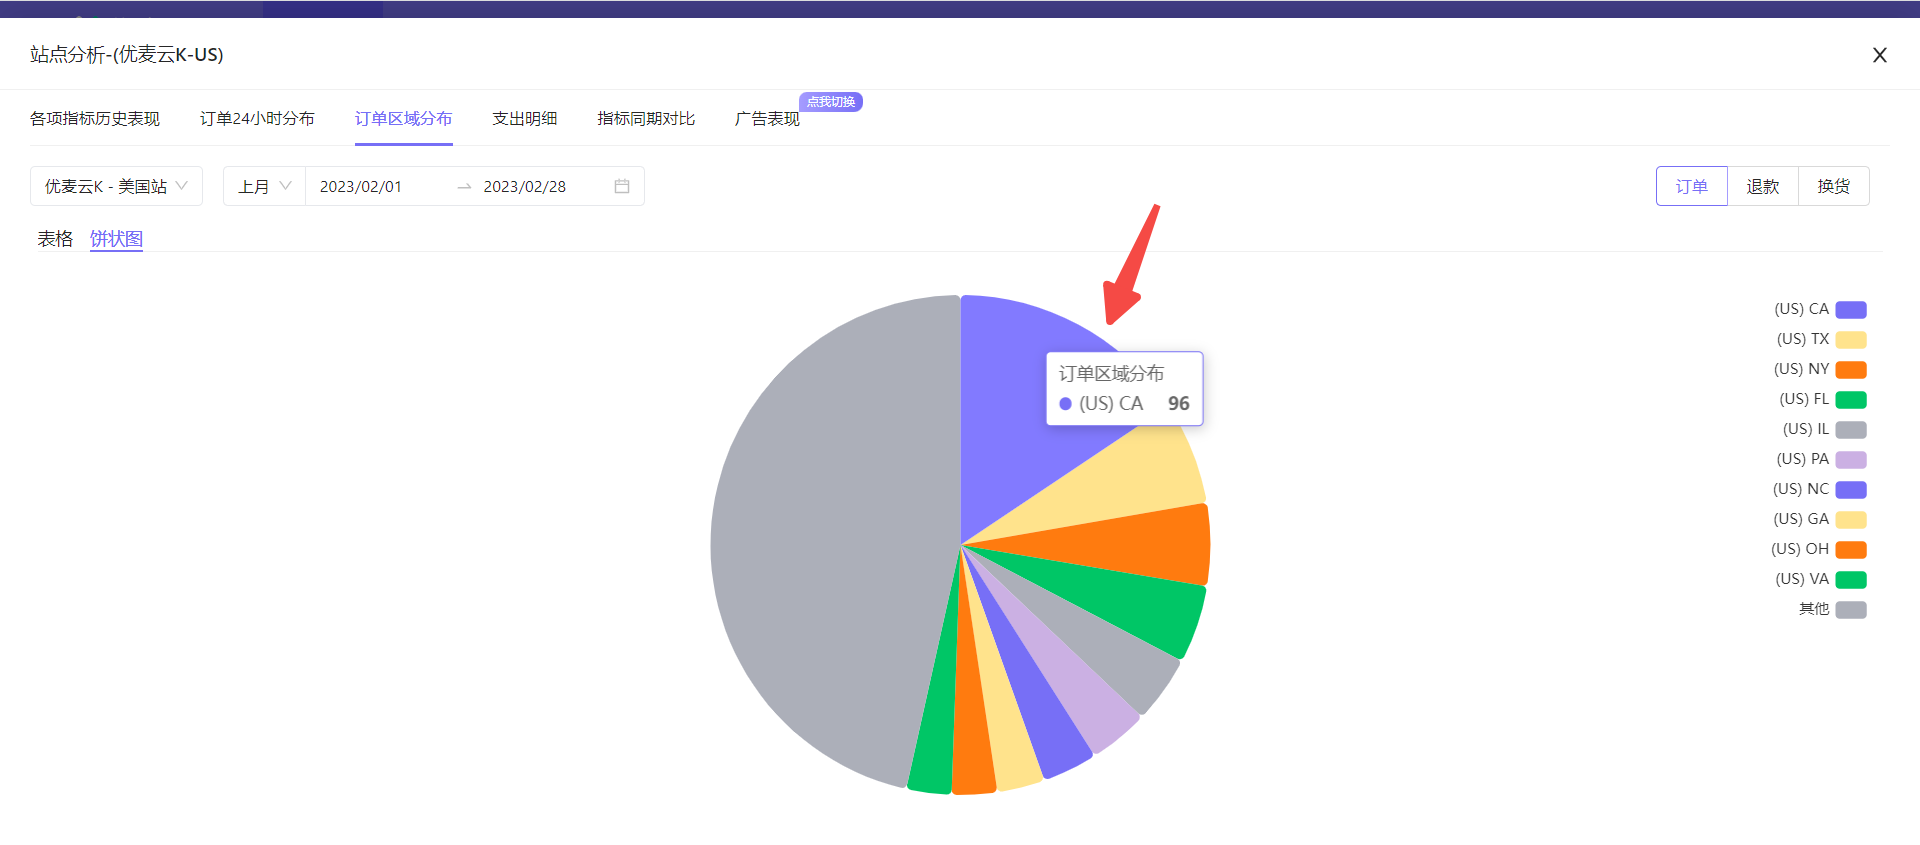
Hover the mouse over the corresponding pie slice to also view detailed data.
 +
+
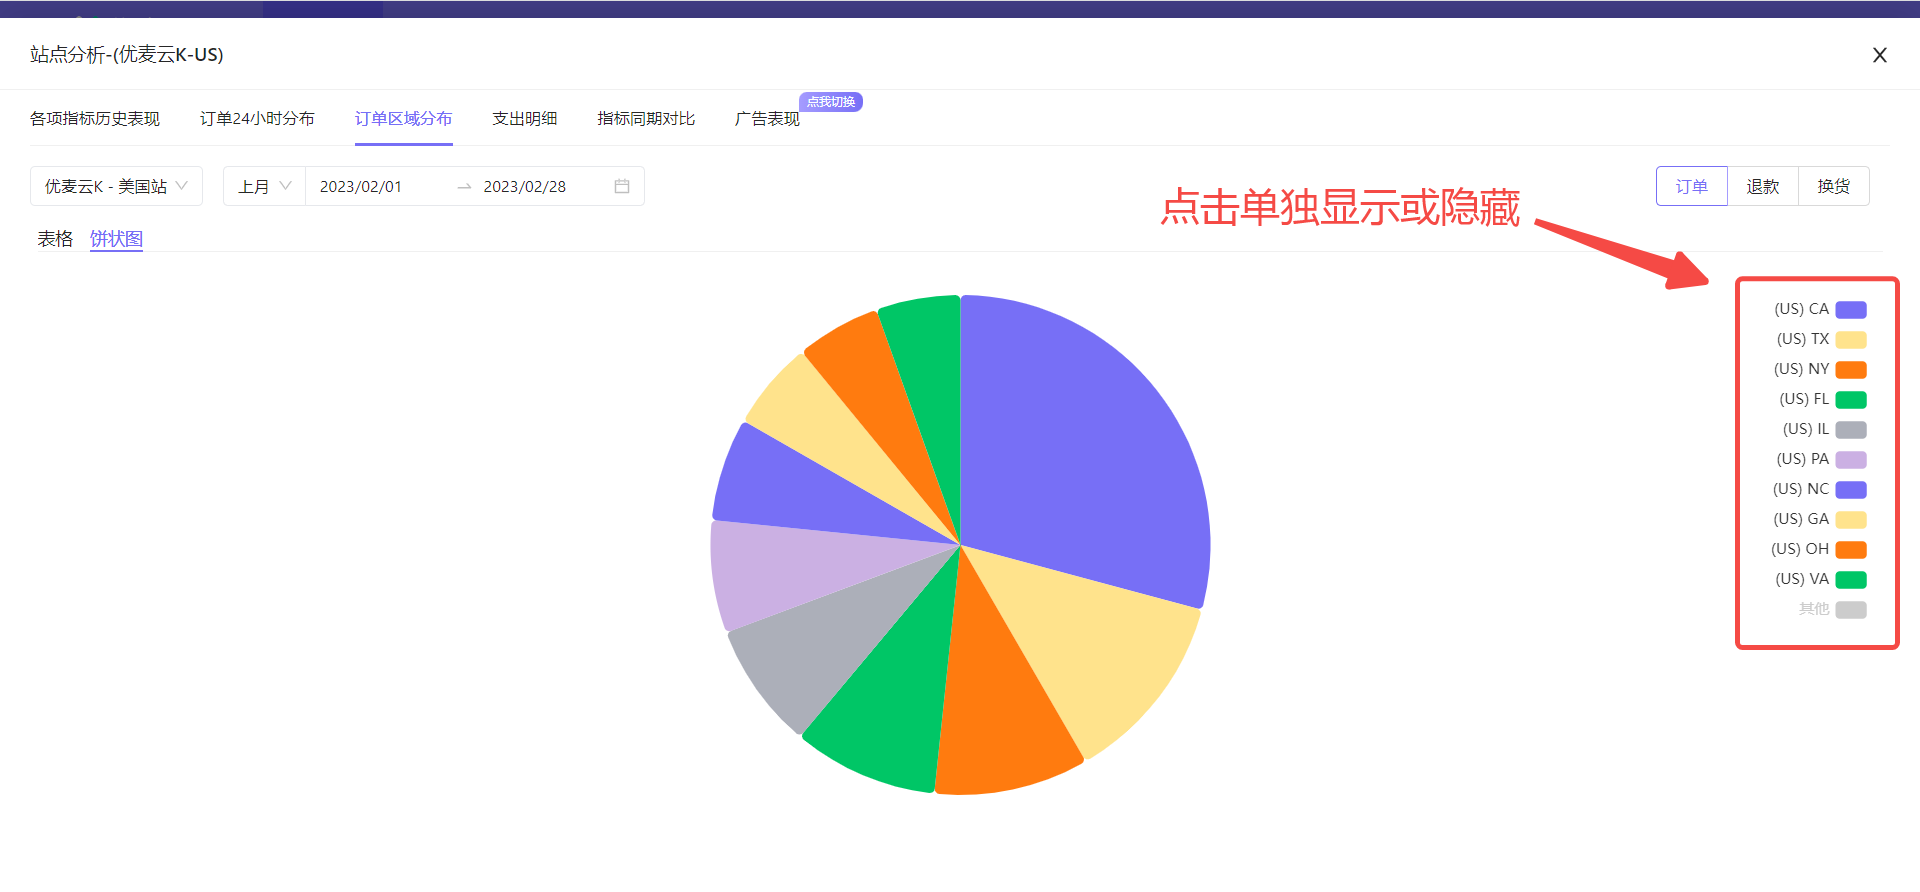
Click the chart slice on the right to display or hide the data separately.
 +
+
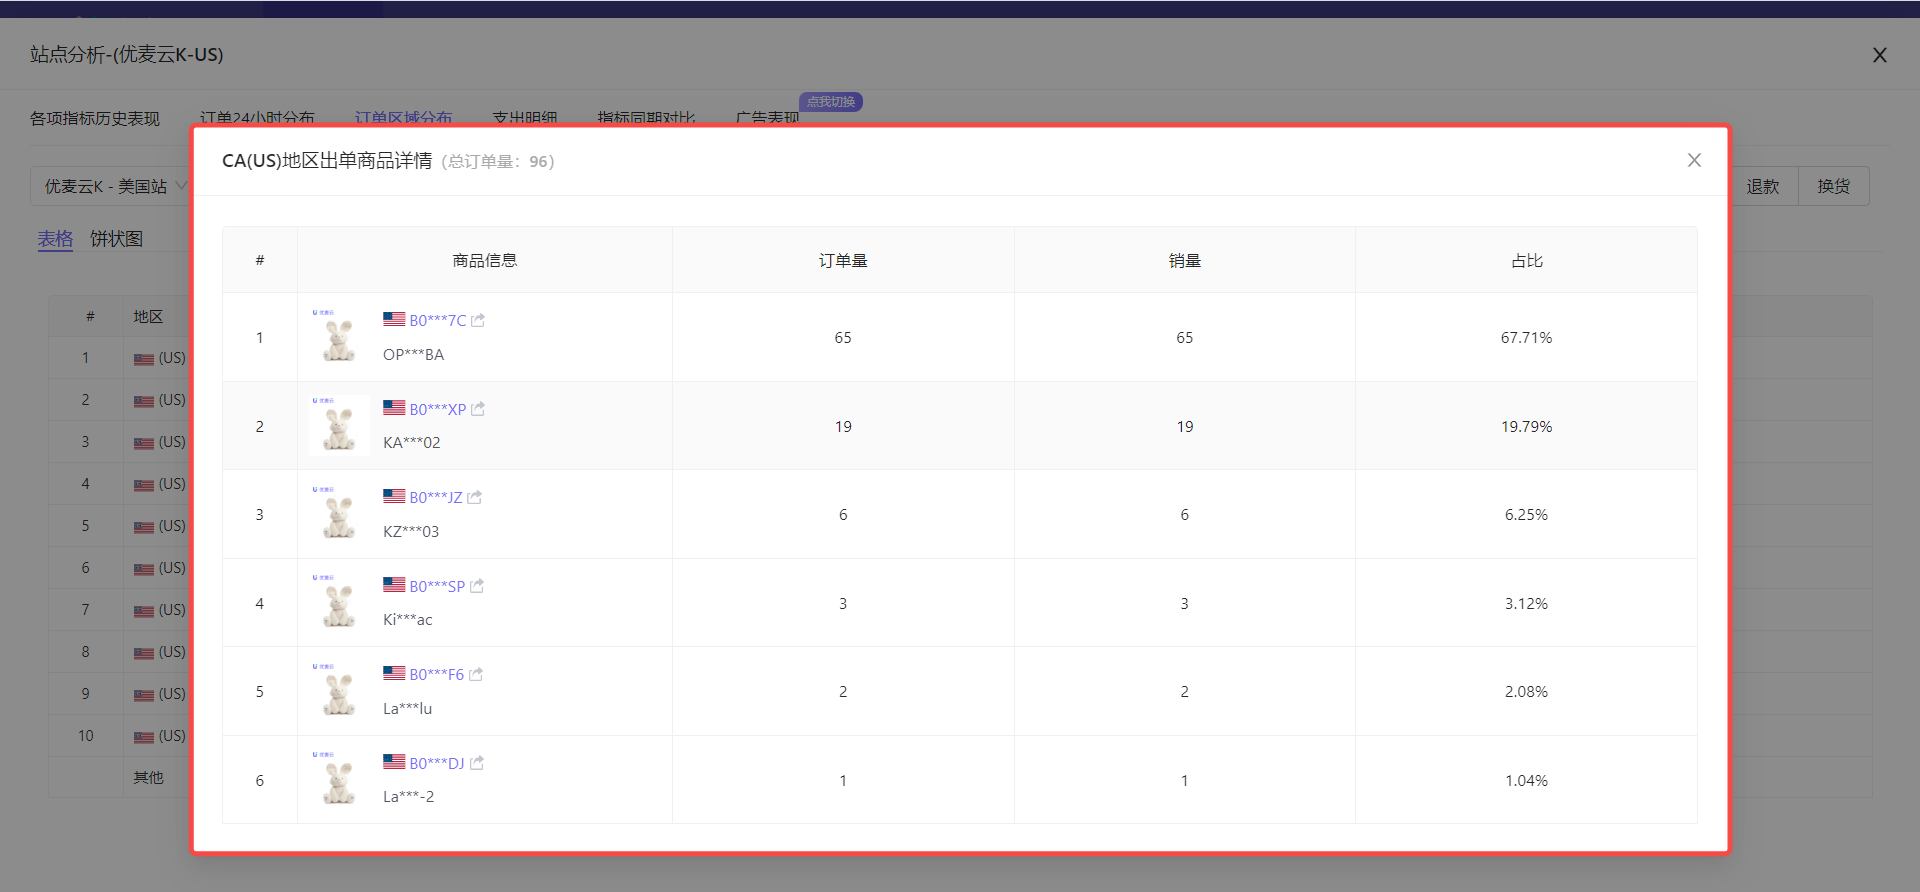
In addition to viewing the order distribution of all orders, you can also view the ordered products in the corresponding areas, and analyze the return and exchange area distribution and reasons.
View the ordered products in the top ten order areas:
Return to the table data mode, and click the [View] button on the right side of the corresponding area to view.
 +
+
Area Ordered Products:
 +
+
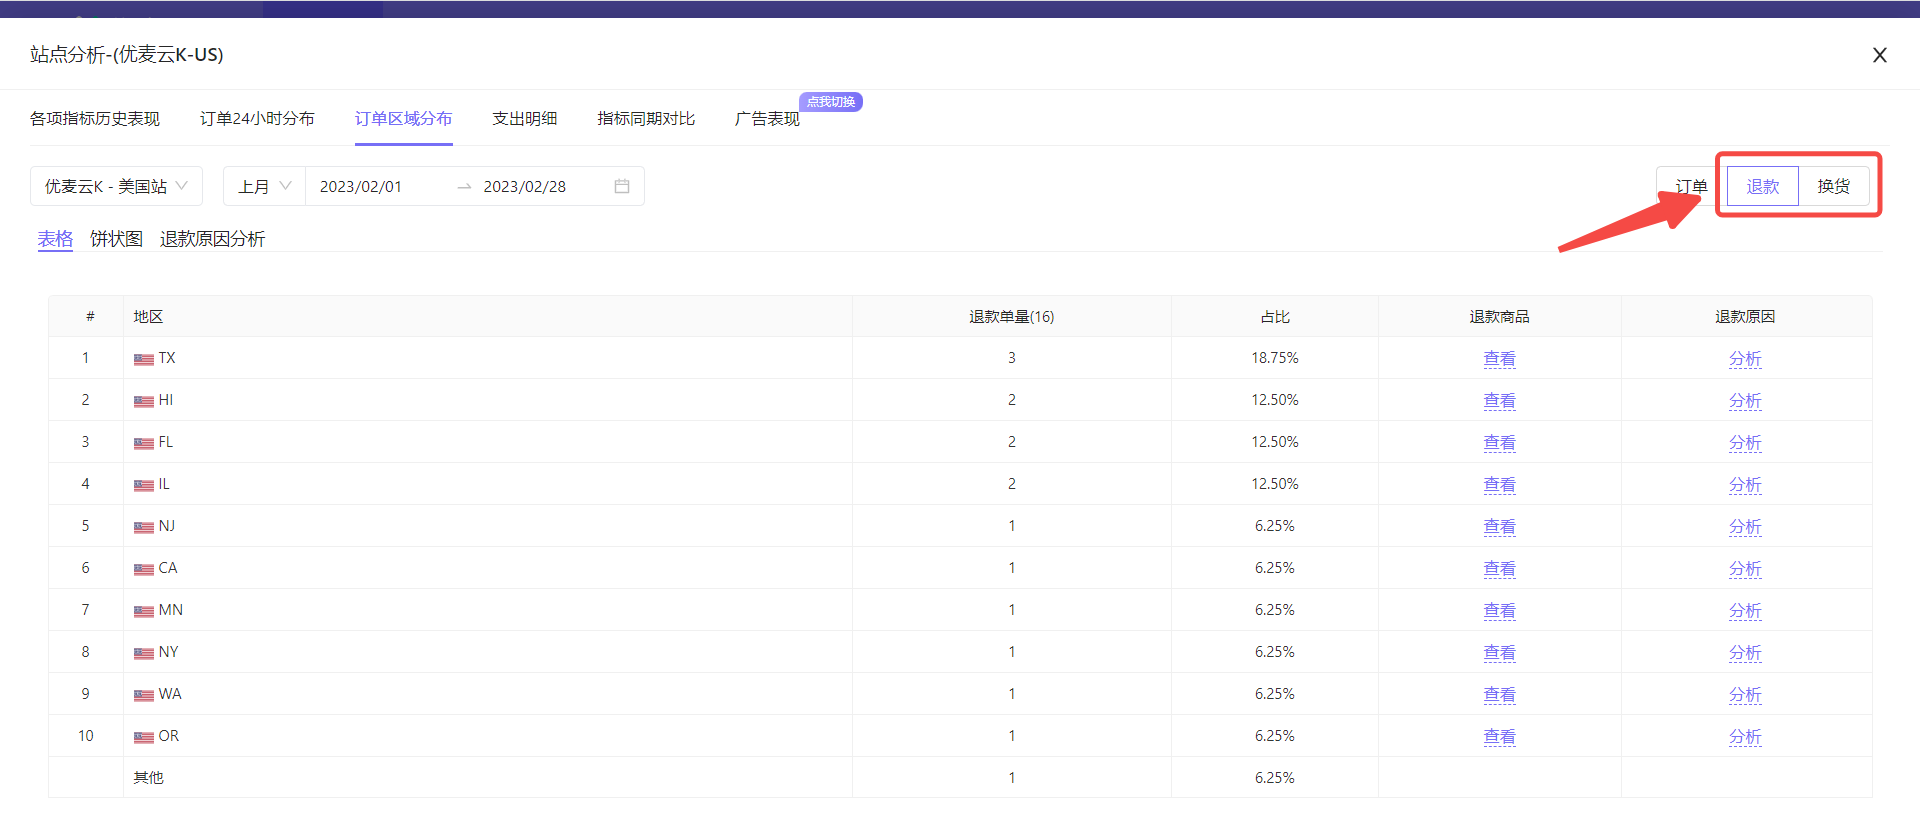
Return and Exchange Area and Reason Analysis Operation Method:
The viewing and analysis operations of return and exchange area distribution are consistent with order area distribution.
Click the data button in the upper right corner to switch with one click.
 +
+
In addition to area distribution analysis, we can also directly analyze refund and exchange reasons here. The method is consistent.
Special Note: If the products sold in the selected marketplace are of many different types, then the return and exchange reason analysis in the marketplace dimension is not very meaningful. It is recommended to go to the [Product Analysis] feature and analyze the return and exchange reasons from the product dimension. Product analysis also has the "Order Area Distribution" tool. Click here to view the graphic tutorial of product analysis
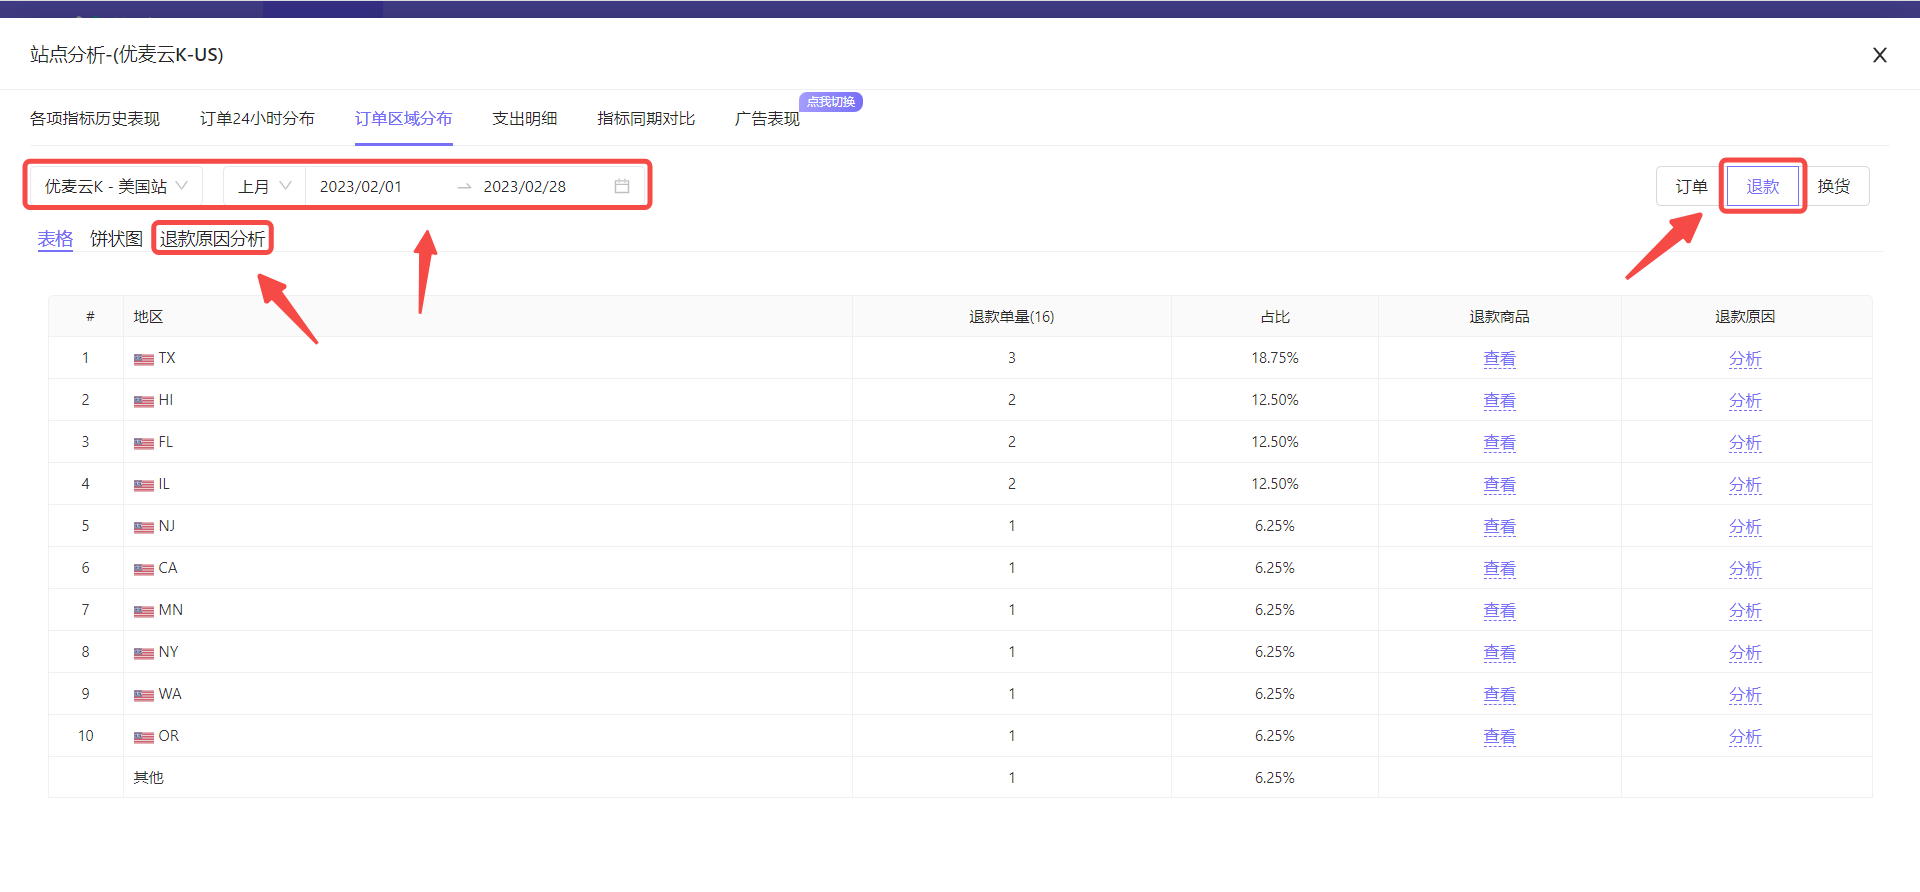
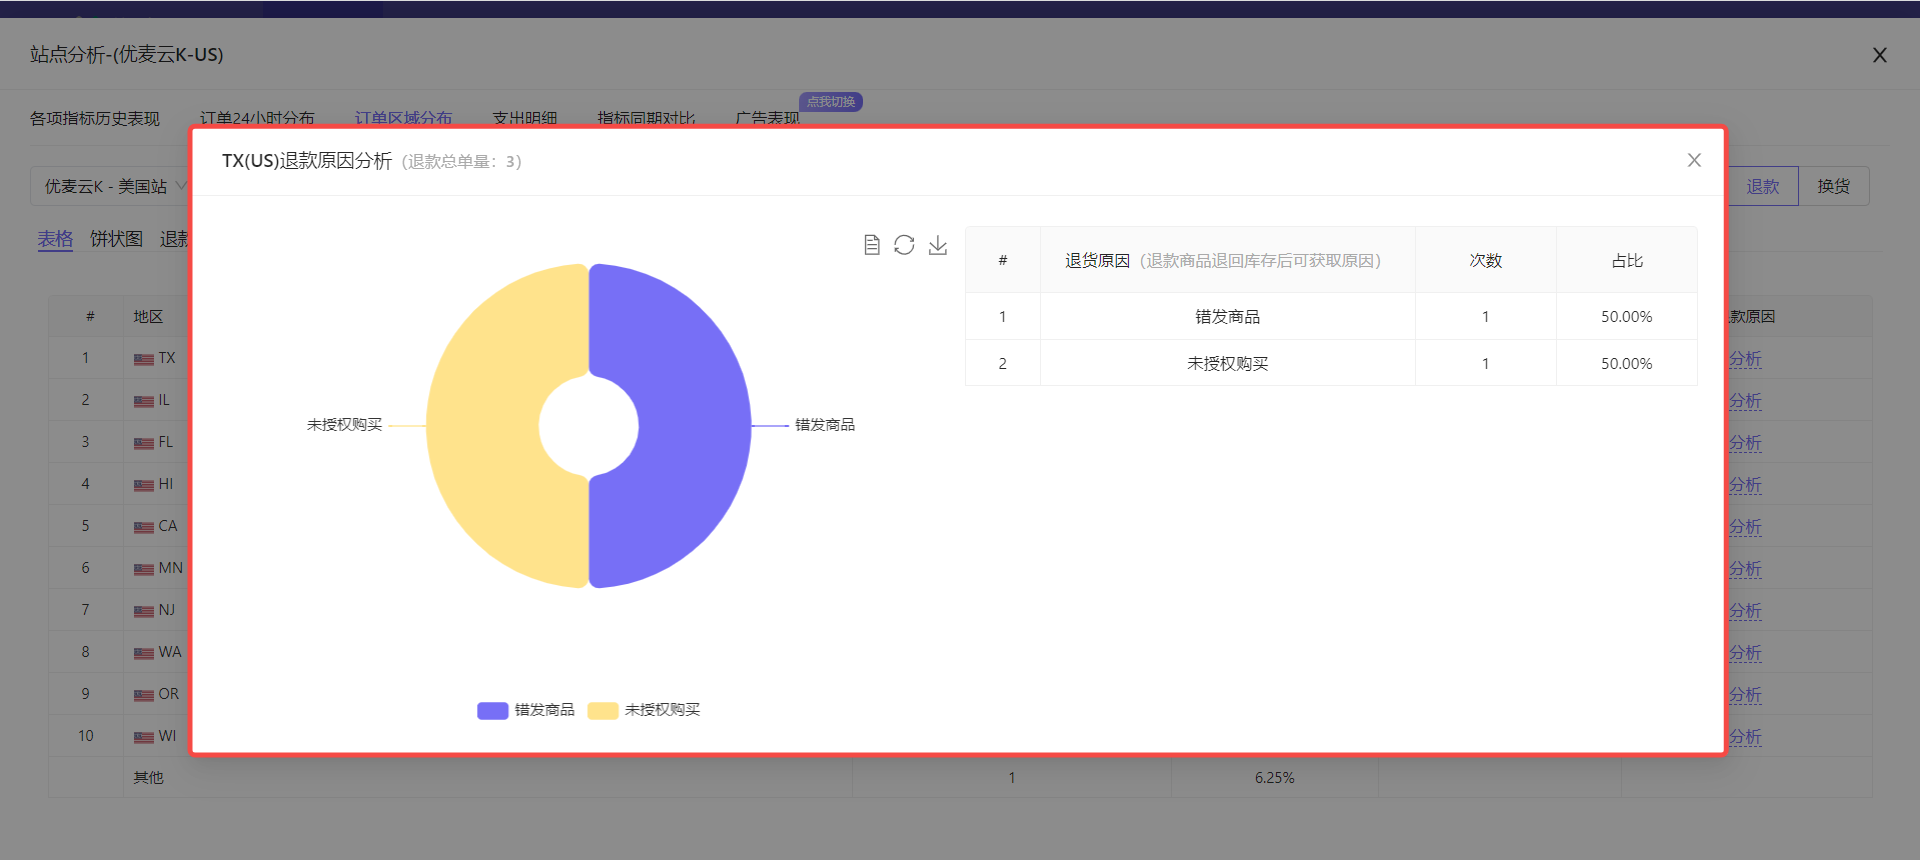
Take analyzing the refund reasons of SellerSpace K - US marketplace last month as an example.
Click to enter the [Refund] area distribution data, select the corresponding marketplace and time, and then click [Refund Reason Analysis] to enter the data analysis page.
 +
+
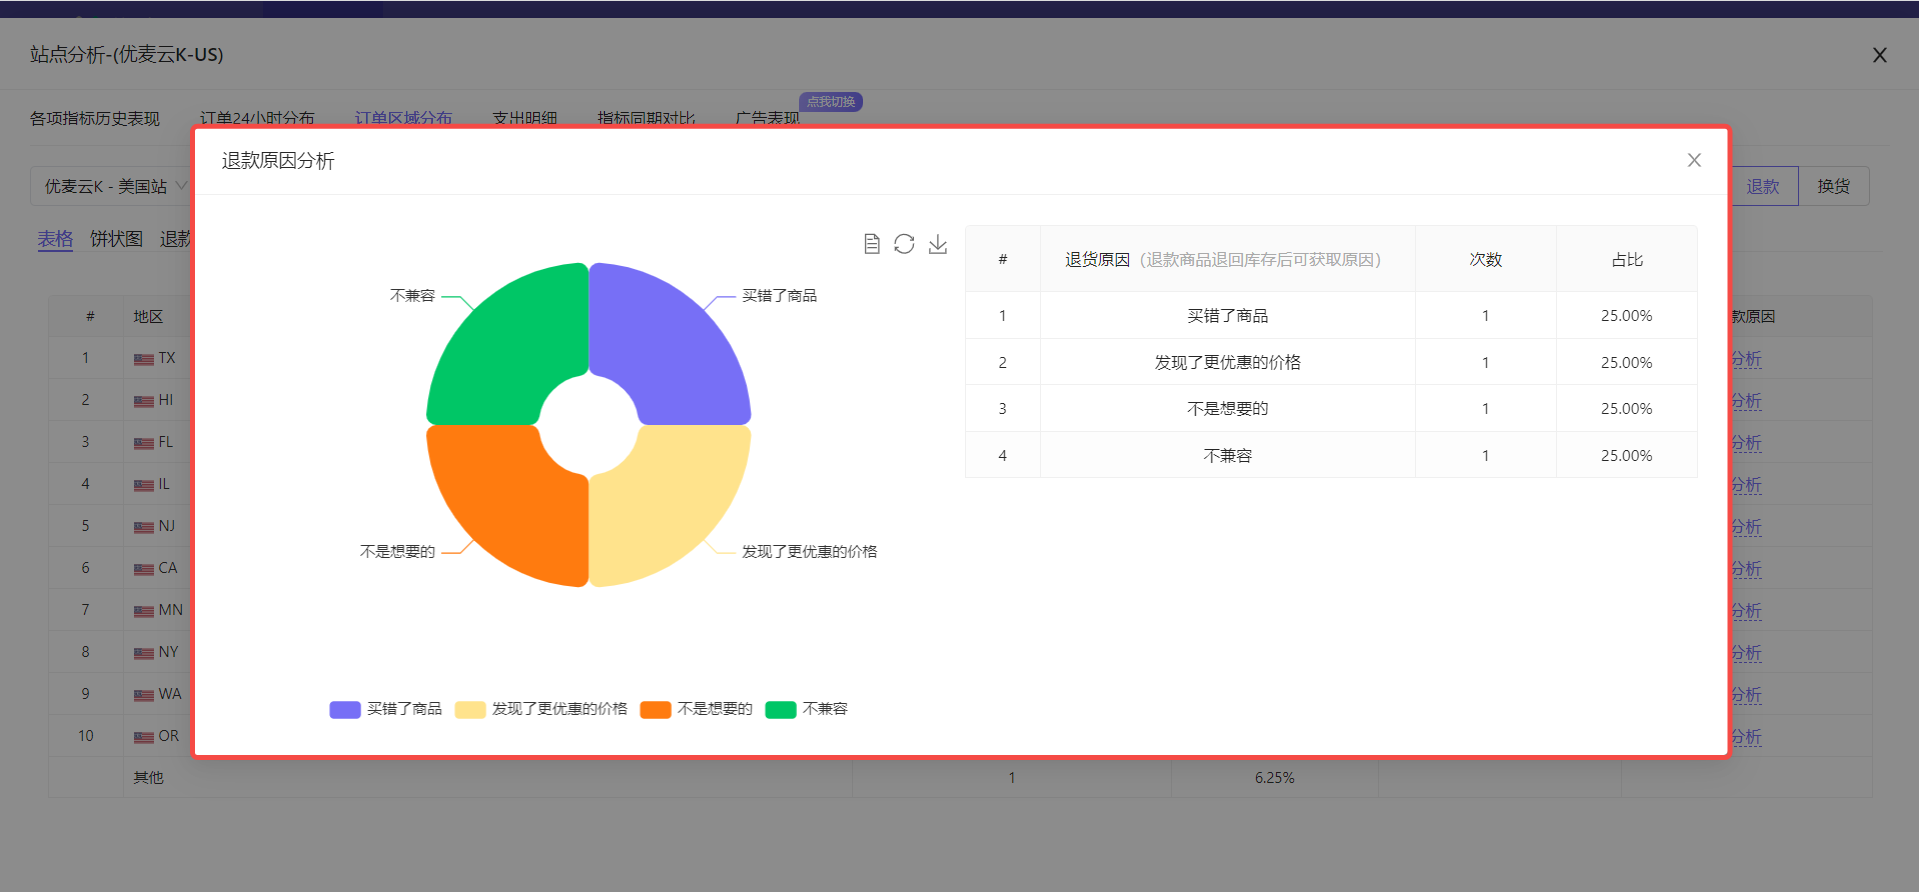
Enter the "Refund Reason Analysis" page,
We can see that the return volume of this marketplace last month is relatively small, and the return reasons are relatively balanced, and there is no concentration phenomenon. Among the existing return reasons, the two reasons "Ordered the wrong item" and "Not what I wanted" need to be paid attention to. You can first check whether our description is inconsistent with the goods, or whether the wrong goods were sent. If there are corresponding errors, make corresponding adjustments.
Later, we need to continuously observe whether these reasons will appear frequently, and make corresponding optimizations according to the actual situation.
 +
+
If there are many refund reasons, we can also click the chart slice below to display or hide the data separately.
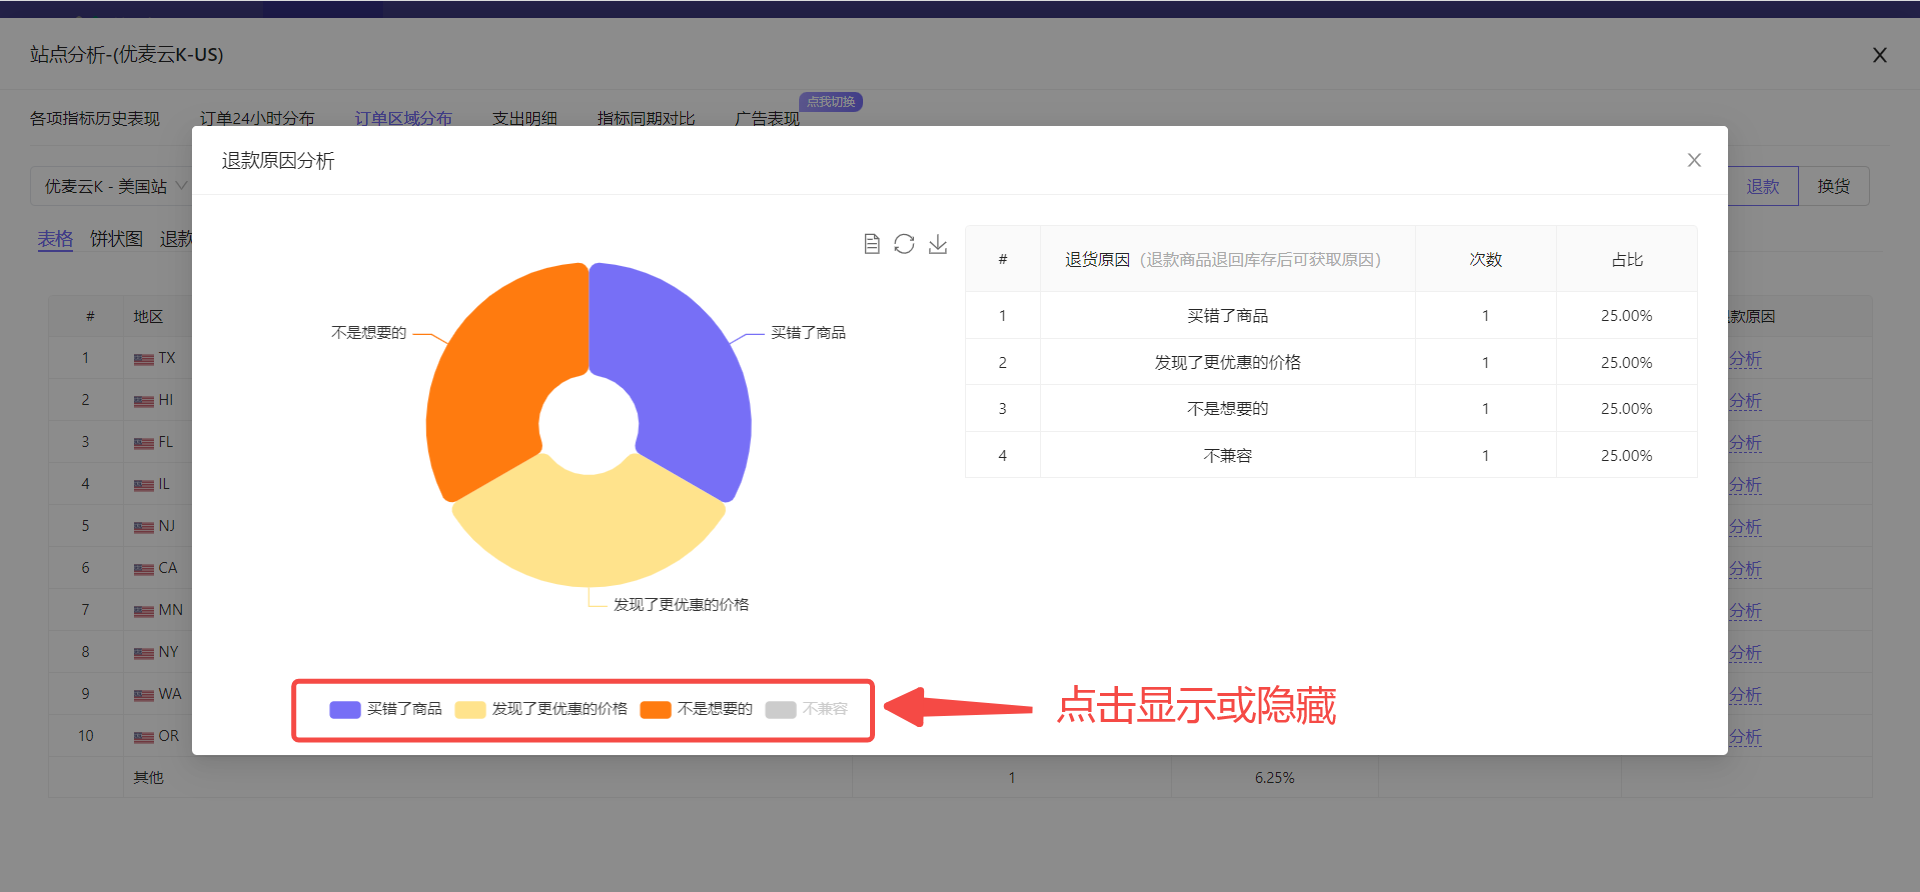 +
+
If there are many refund reasons, and there are many operations to display or hide separately, if you want to restore to the initial data display, you can click the restore button to restore with one click.
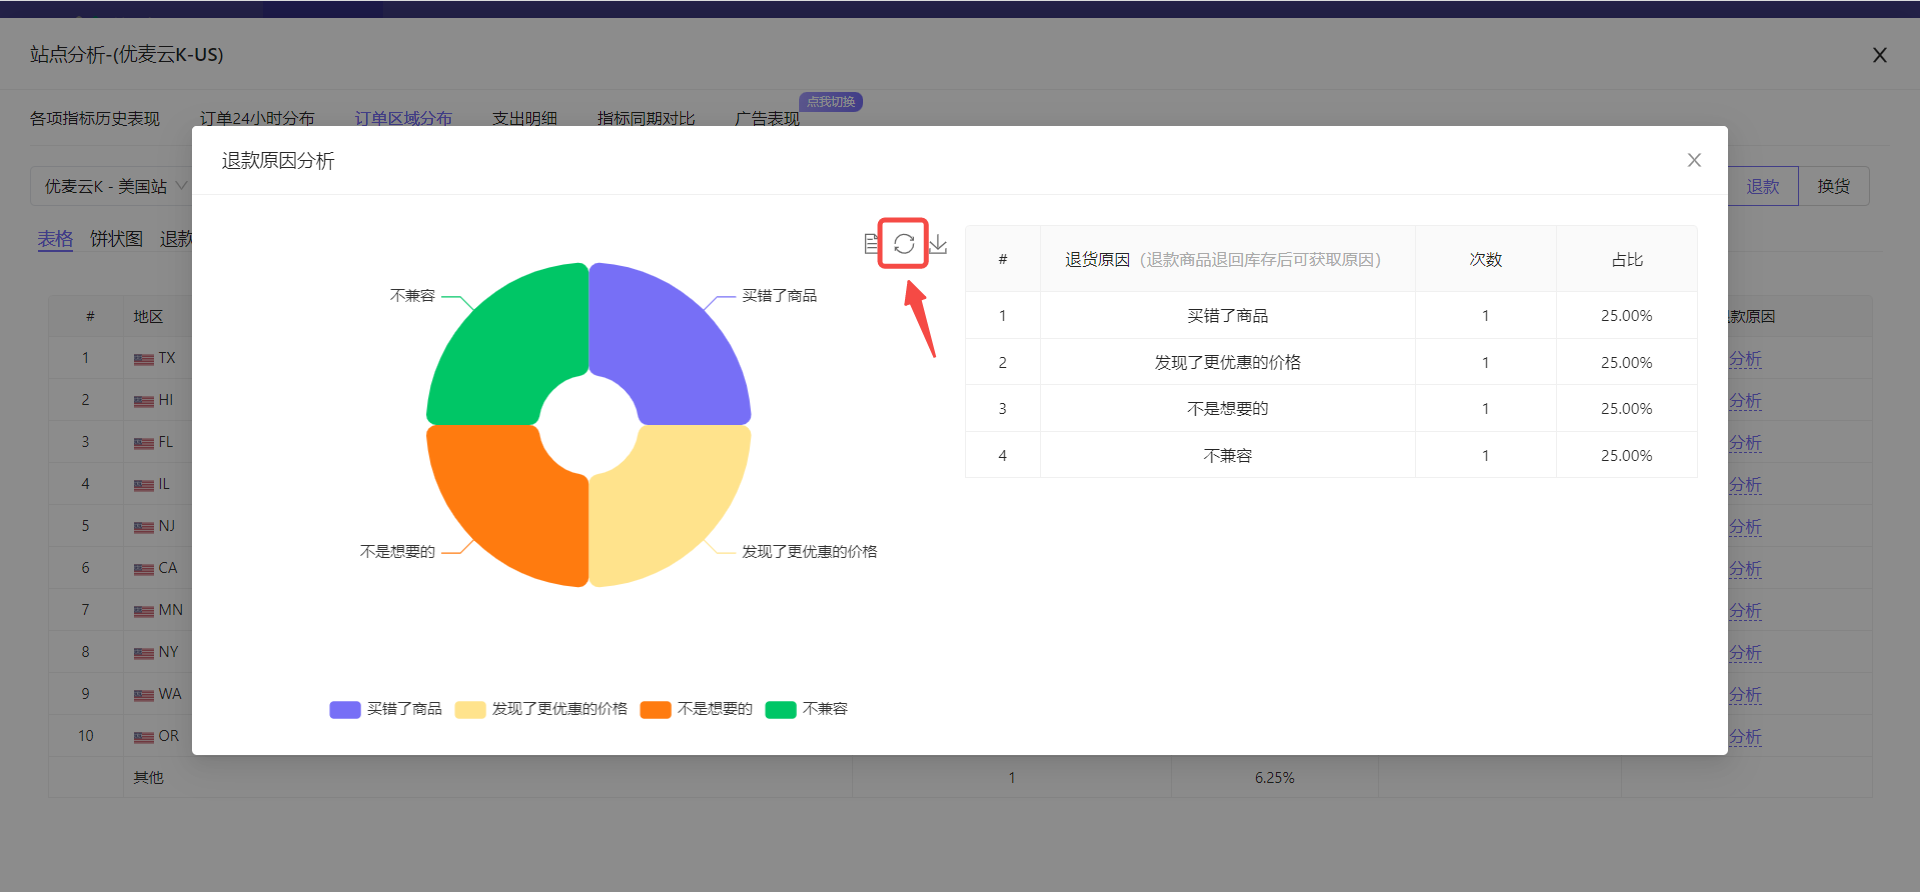 +
+
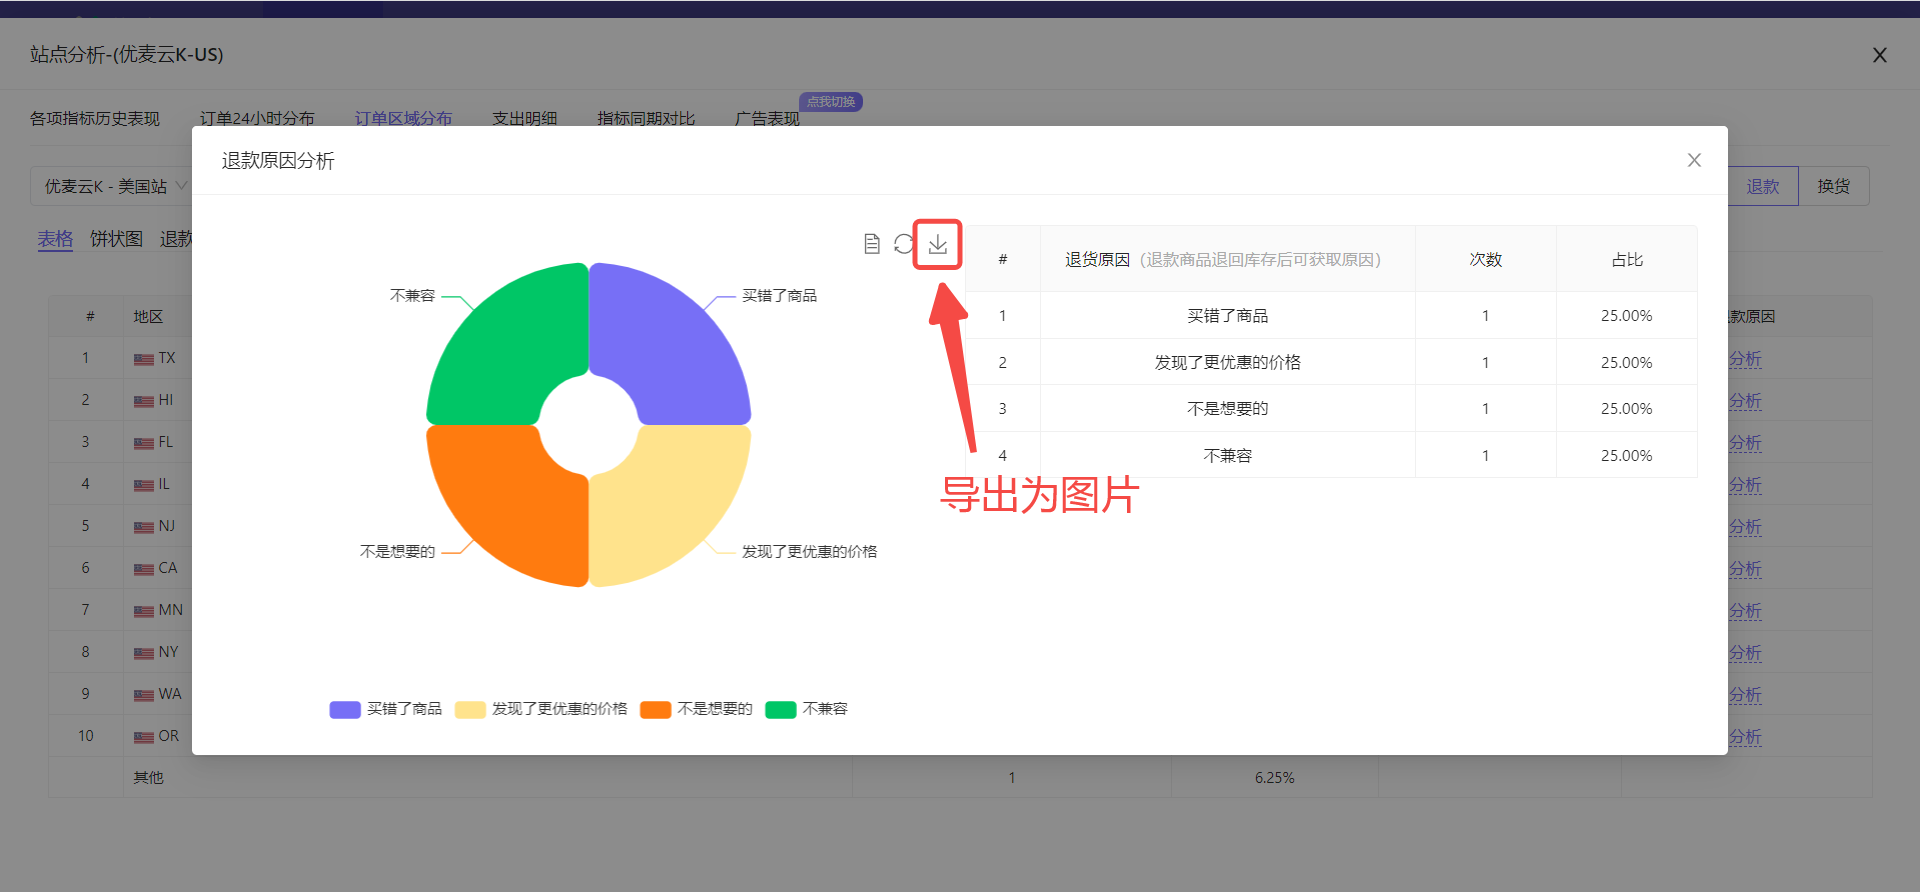
The current chart also supports exporting, exporting to an image, which is convenient for us to make reports.
Click the Export button to export with one click.
 +
+
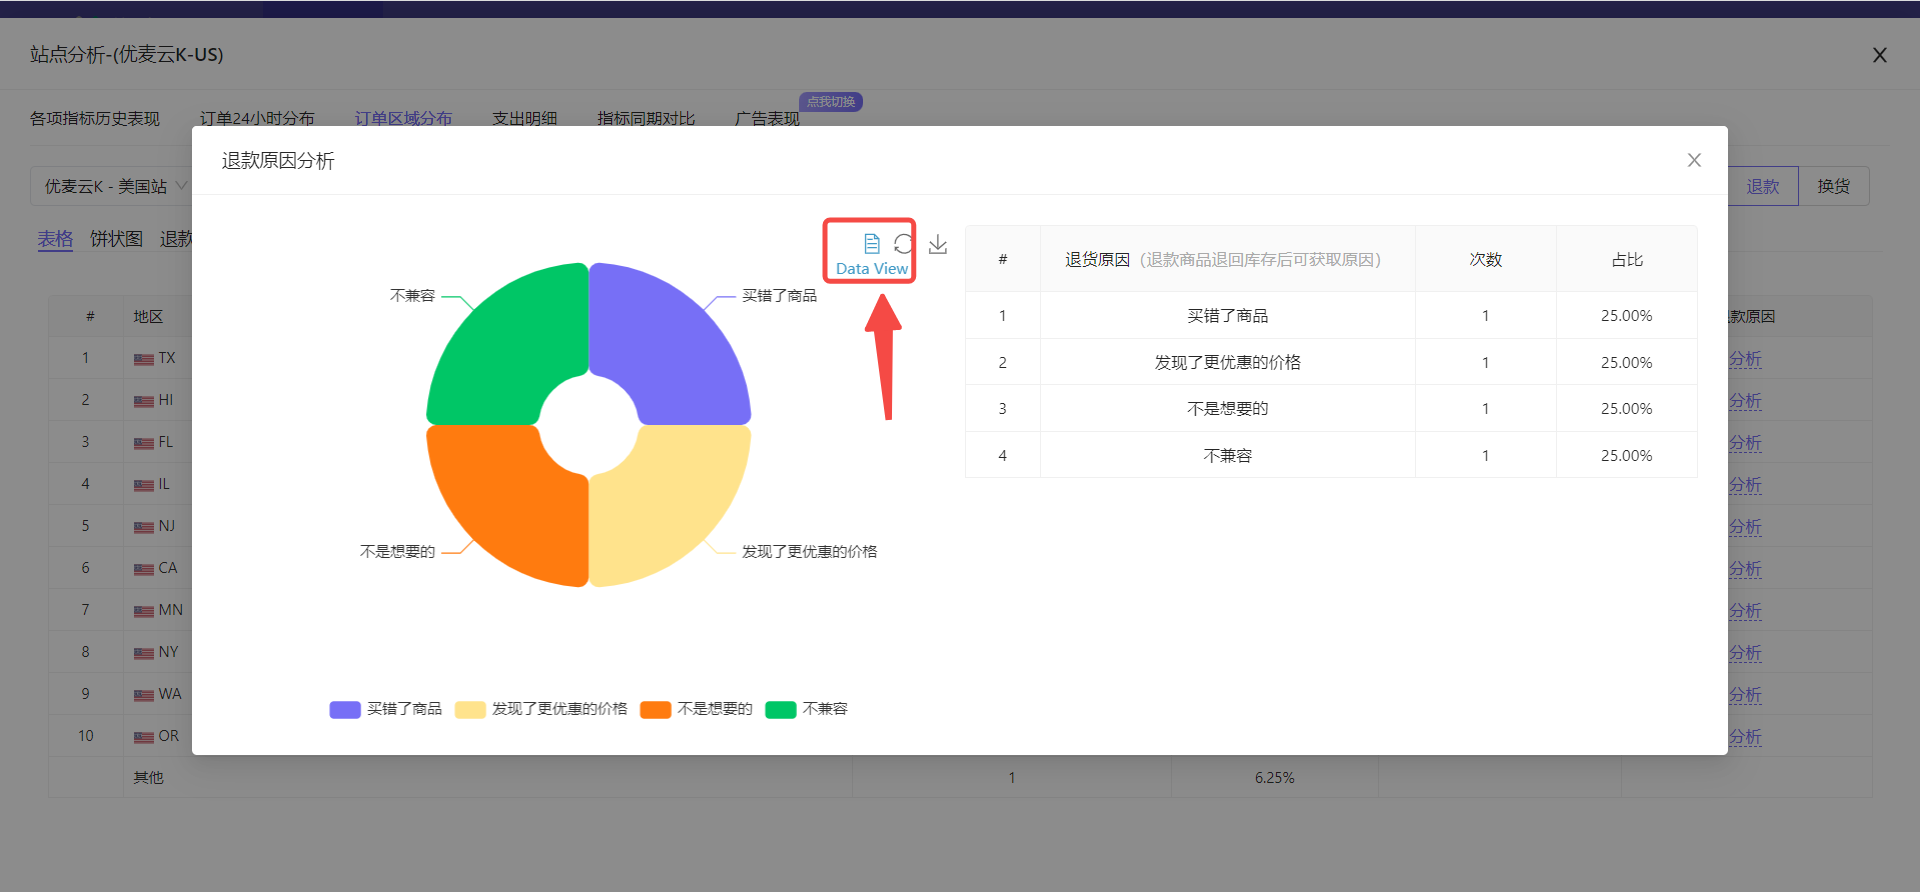
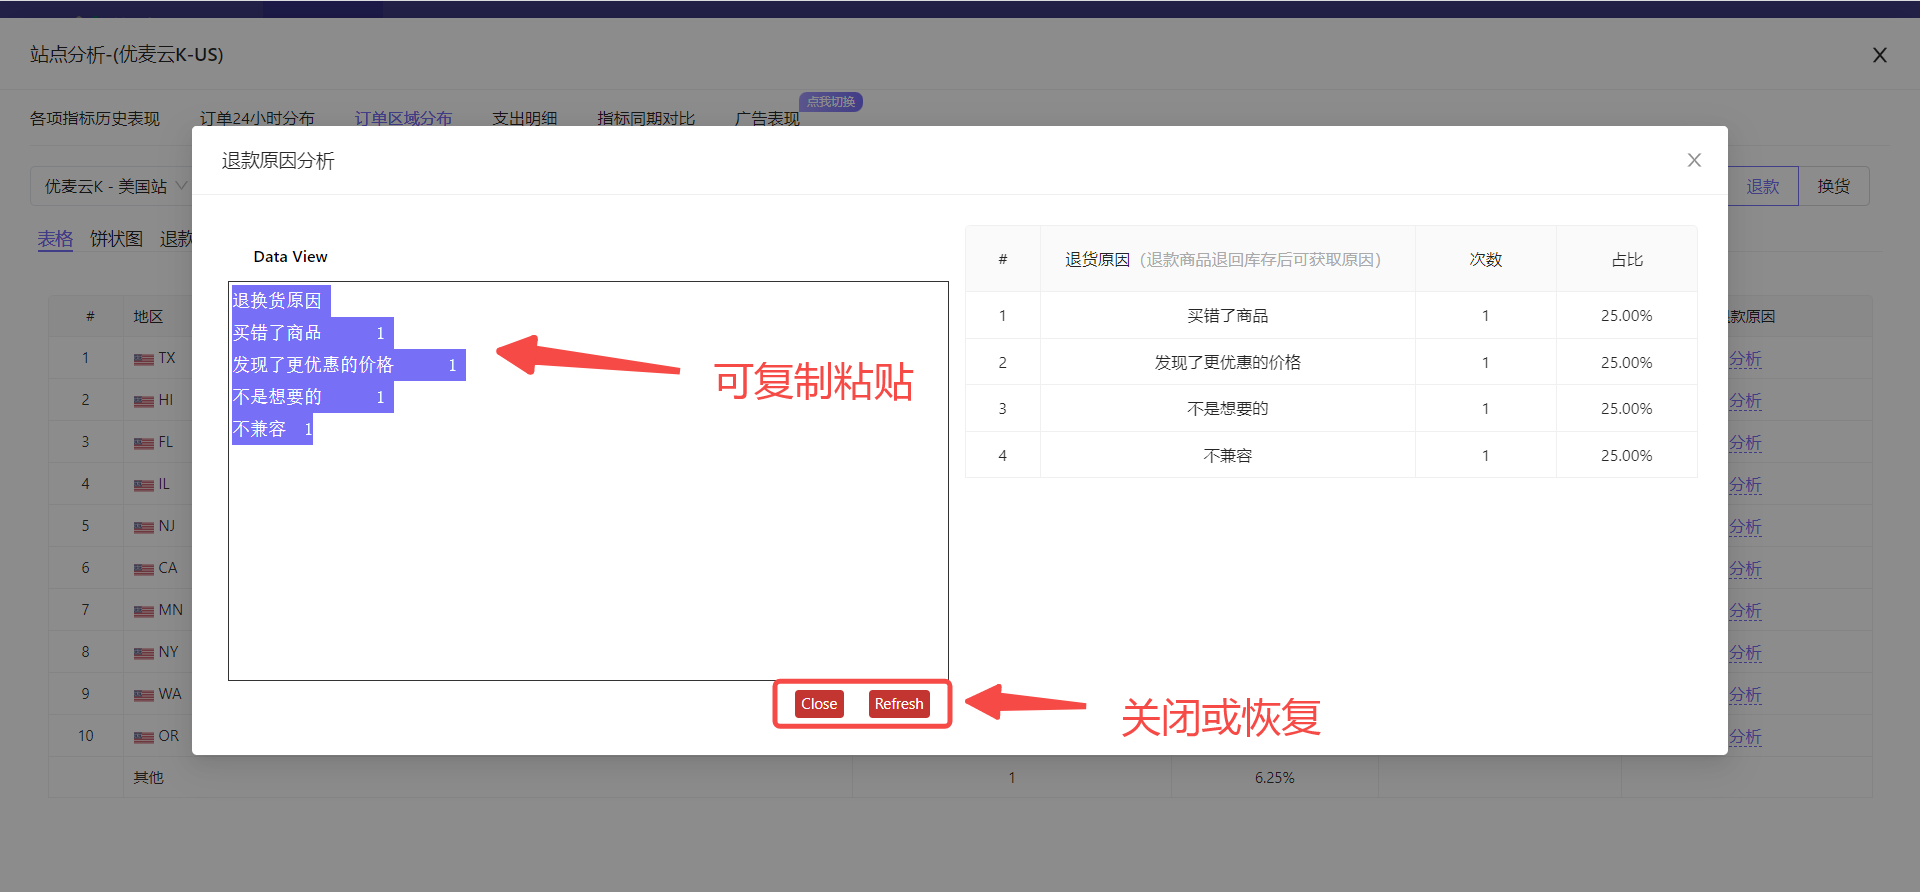
In addition to direct chart analysis, we can also switch to a pasteable and copyable table, copy the data out for archiving, or meet other copy and paste needs.
Click the chart button above to switch with one click.
 +
+
Directly copy and paste:
 +
+
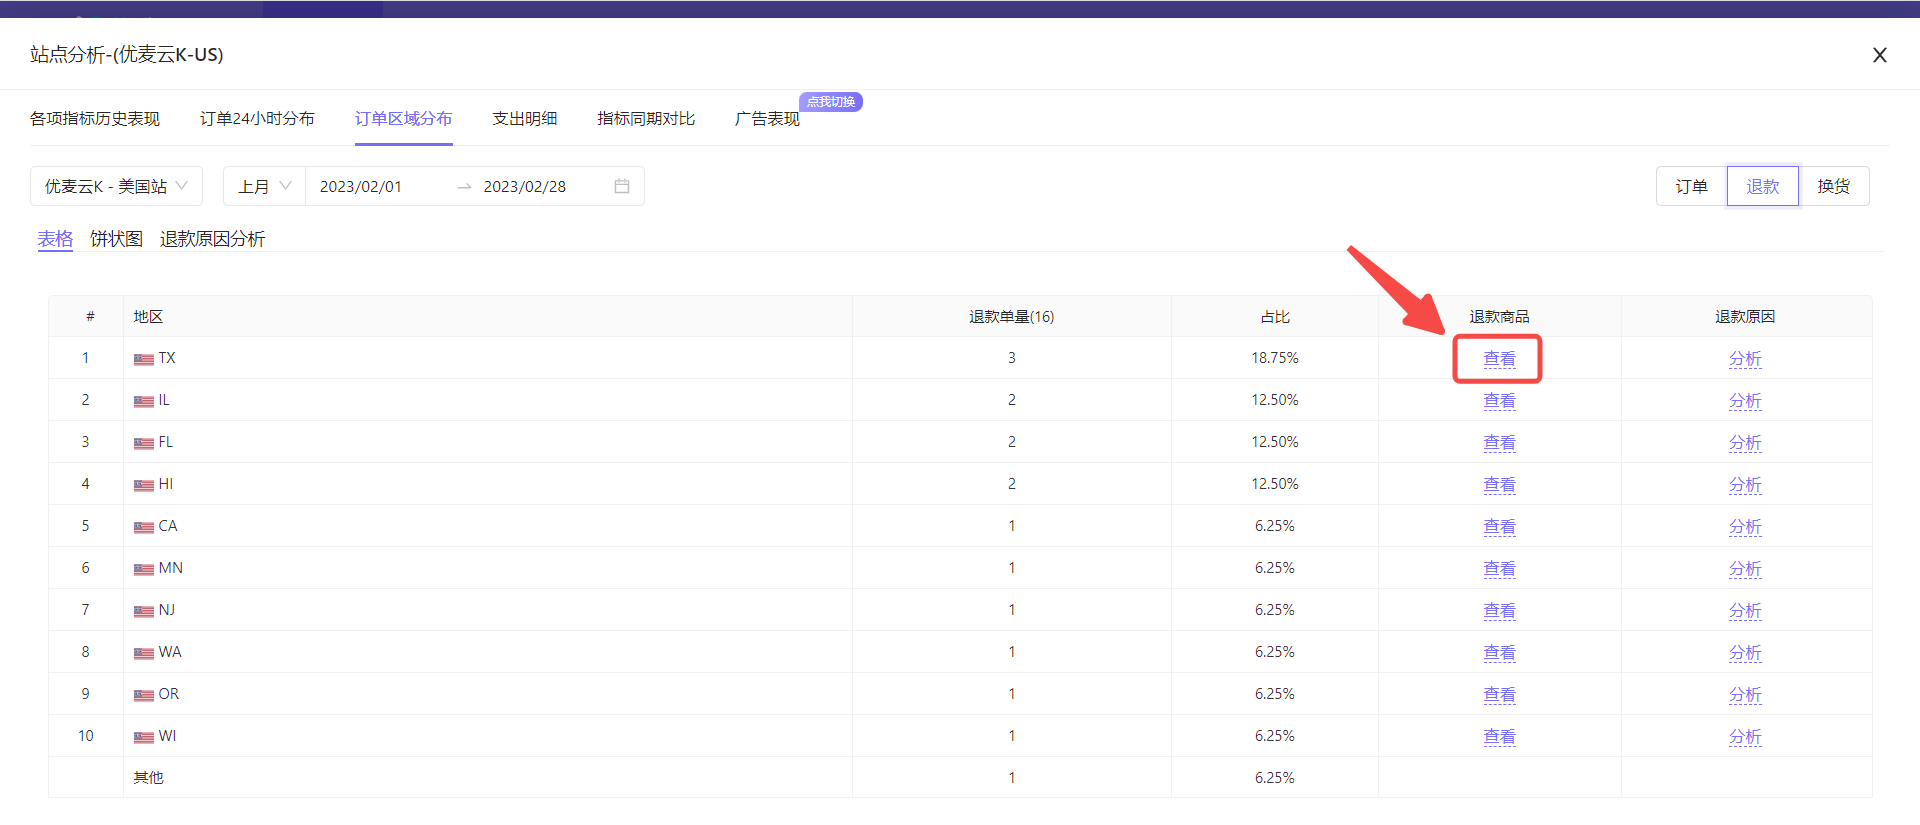
In addition to analyzing the return and exchange reasons of the entire marketplace, we can also separately analyze the refund products and reasons in the top ten return areas. (The operation of exchange is consistent with it)
Enter the refund area distribution data page, and click the [View] button on the right side of the area to be analyzed to view the refund products in that area.
 +
+
A list of refund products in the area:
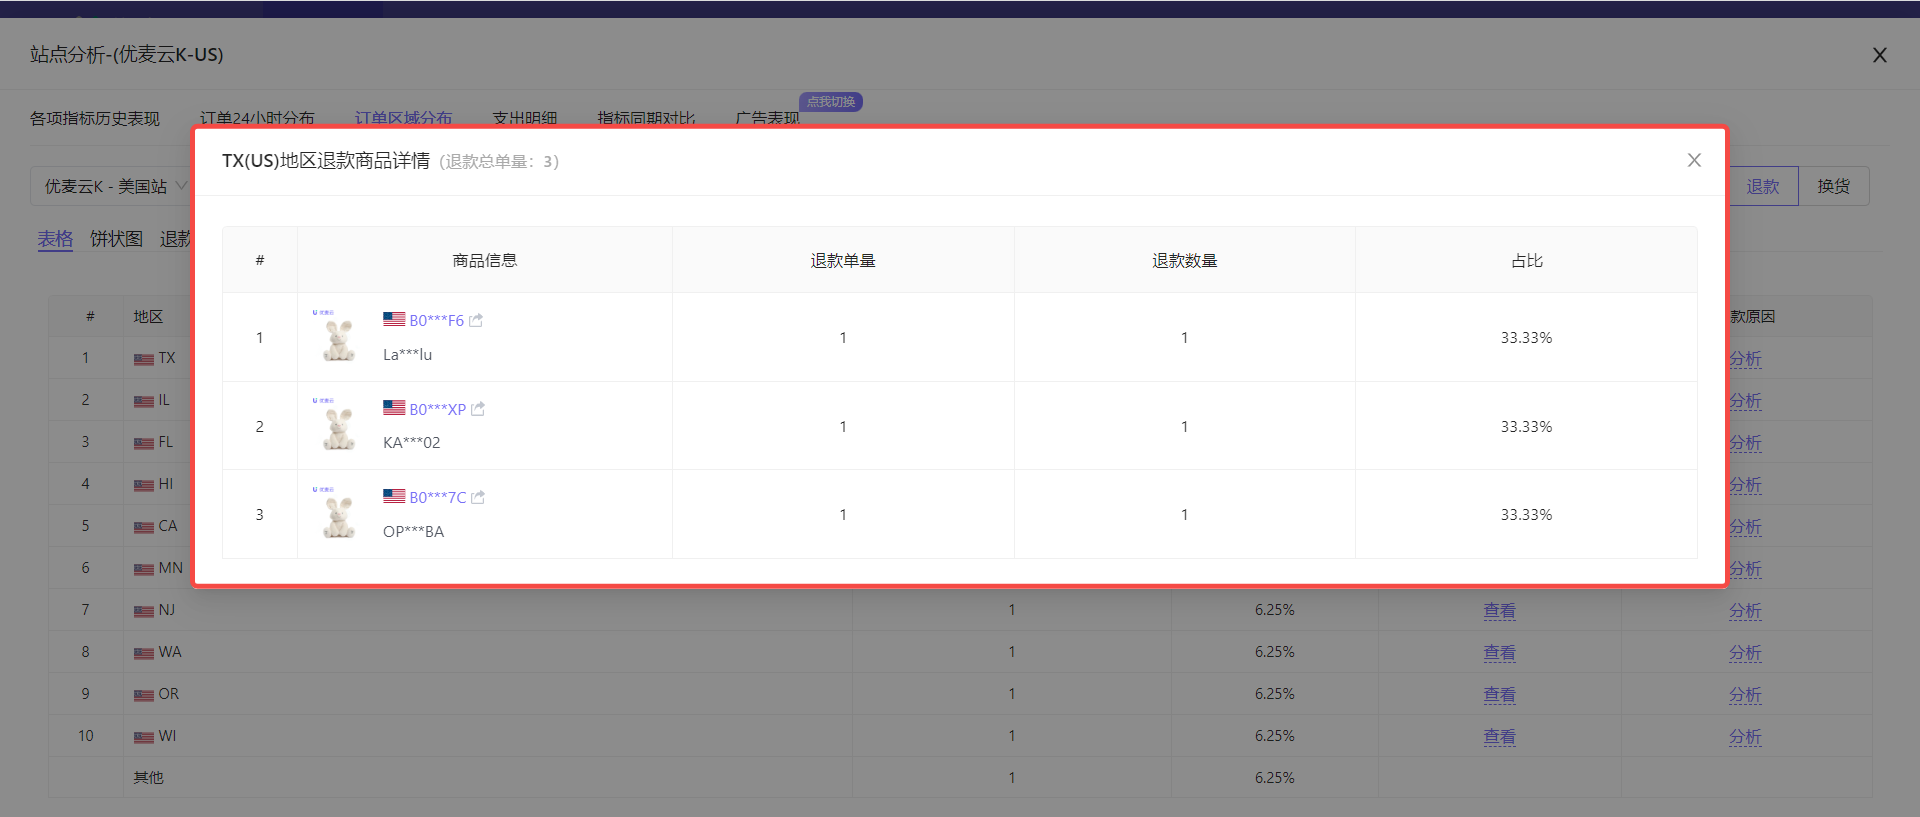 +
+
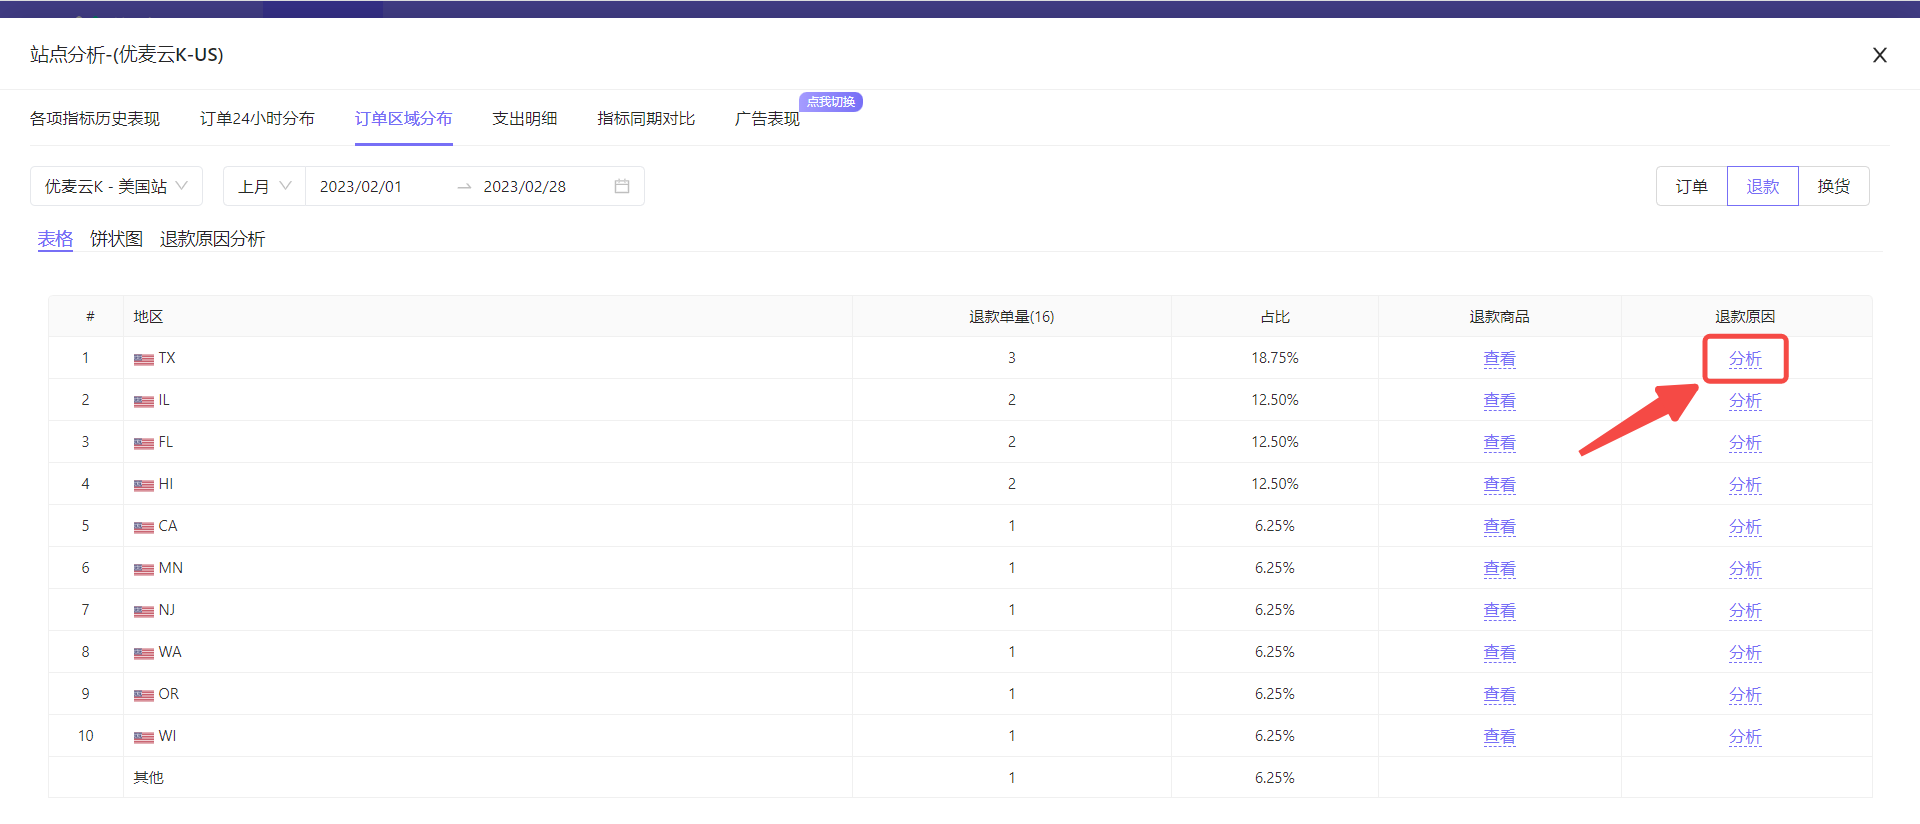
Click the [Analyze] button to enter the analysis of the refund reasons in the area.
 +
+
The analysis method is consistent with the return and exchange reason analysis of the entire product.
 +
+
④ Expense Details
Expense details display various types of total expenses of the current marketplace, as well as the data ratio of each type, helping us review operating expenses.
We can quickly identify the main expense focus, whether the target expense meets the standard, and whether there are any abnormalities in marketplace expenses by analyzing marketplace expense details.
 +
+
Take reviewing the marketplace expenses of SellerSpace K - US marketplace last month as an example,
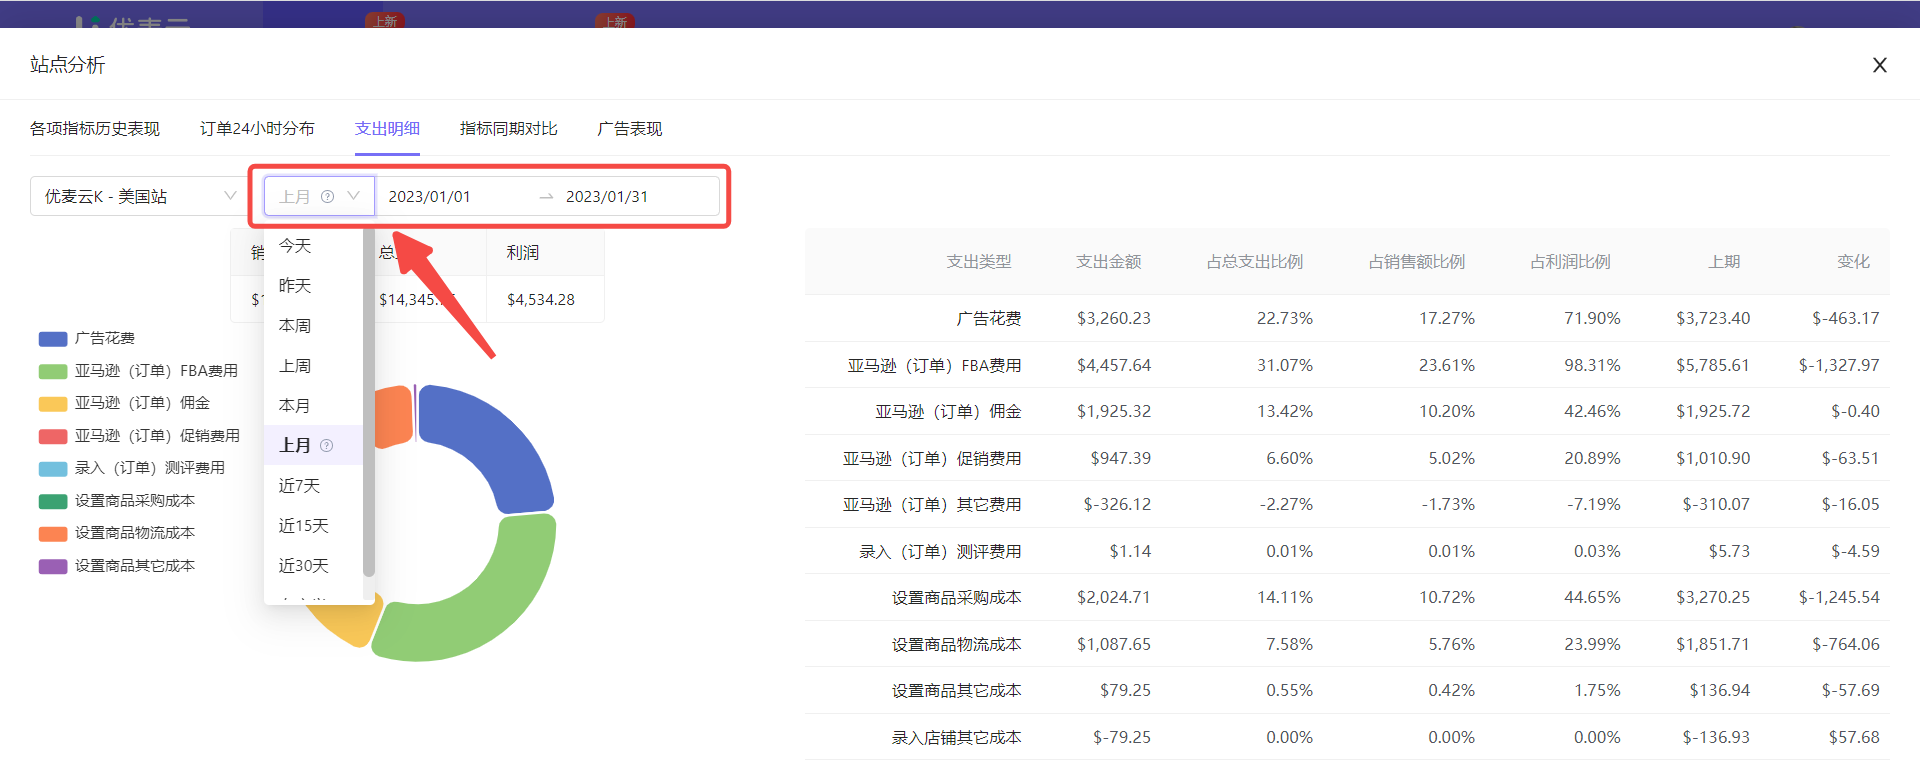
First, select the data time: Last Month.
Similarly, we can customize the data time range of expense details.
However, it should be noted that due to some pending orders, Amazon may return 0 data within a certain period. At this time, we may adopt a budget. Therefore, if the recent time range is selected, Amazon FBA fees, commissions, and other fees may be 0 or distorted. Therefore, it is recommended to choose a time period with a larger span for analysis.
Click here to learn about "SellerSpace Order Budget"
Click Time in the upper left corner and select the data time range: Last Month.
 +
+
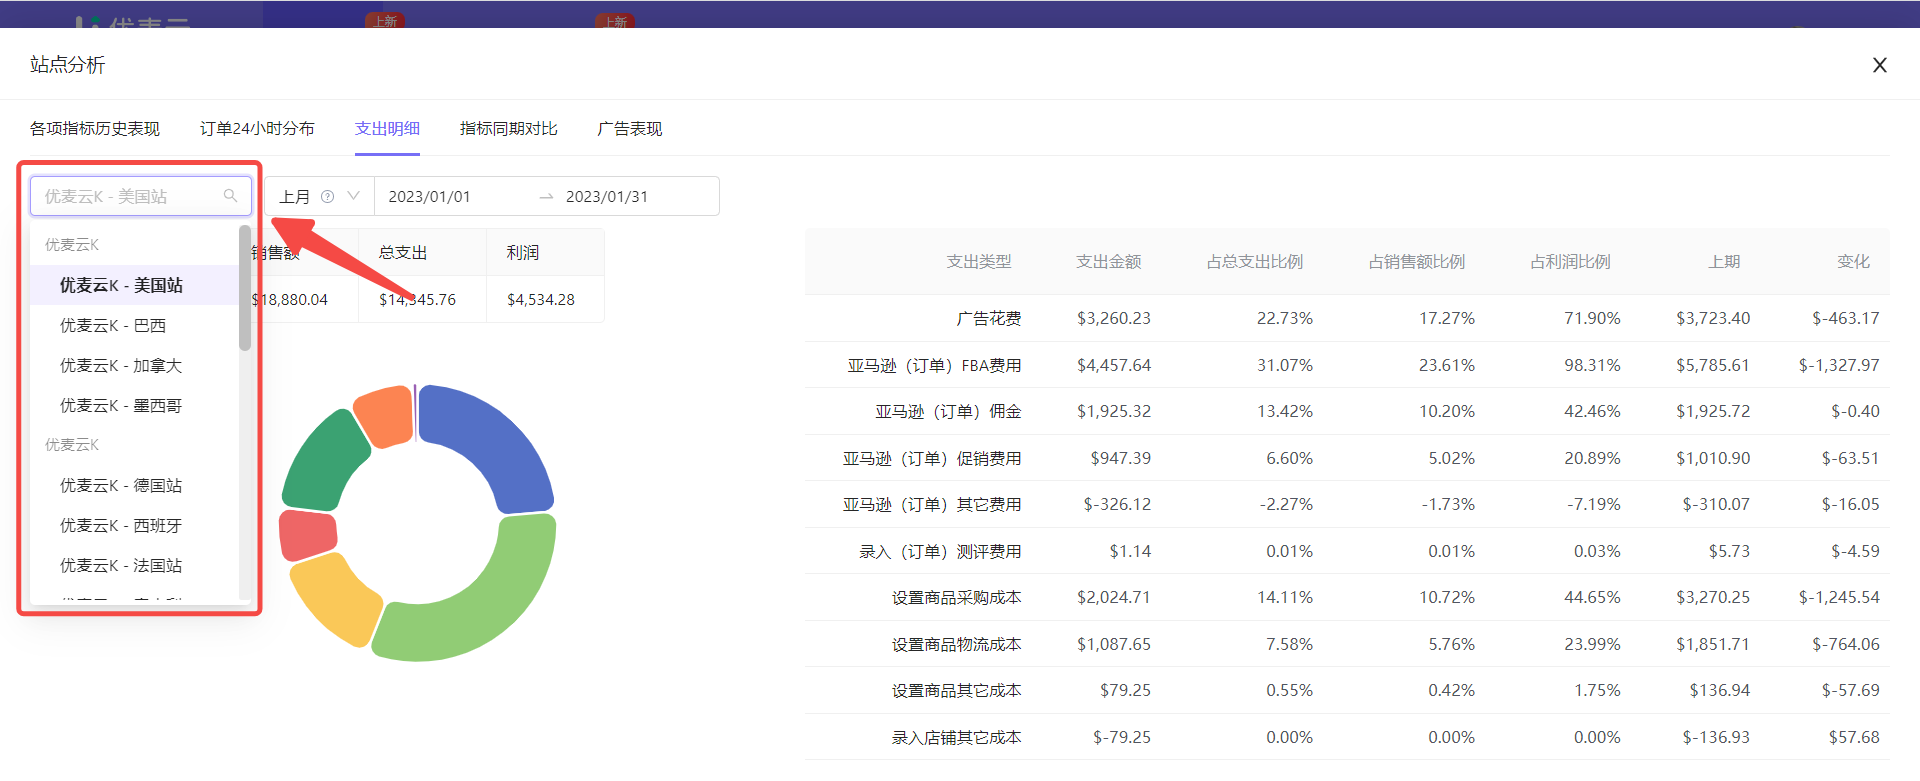
Then, select the marketplace: SellerSpace K - US Marketplace.
We can directly view the expense details of different marketplaces, so we need to set the marketplace to be analyzed.
Click the marketplace name in the upper left corner to directly switch the marketplace: SellerSpace K - US Marketplace.
 +
+
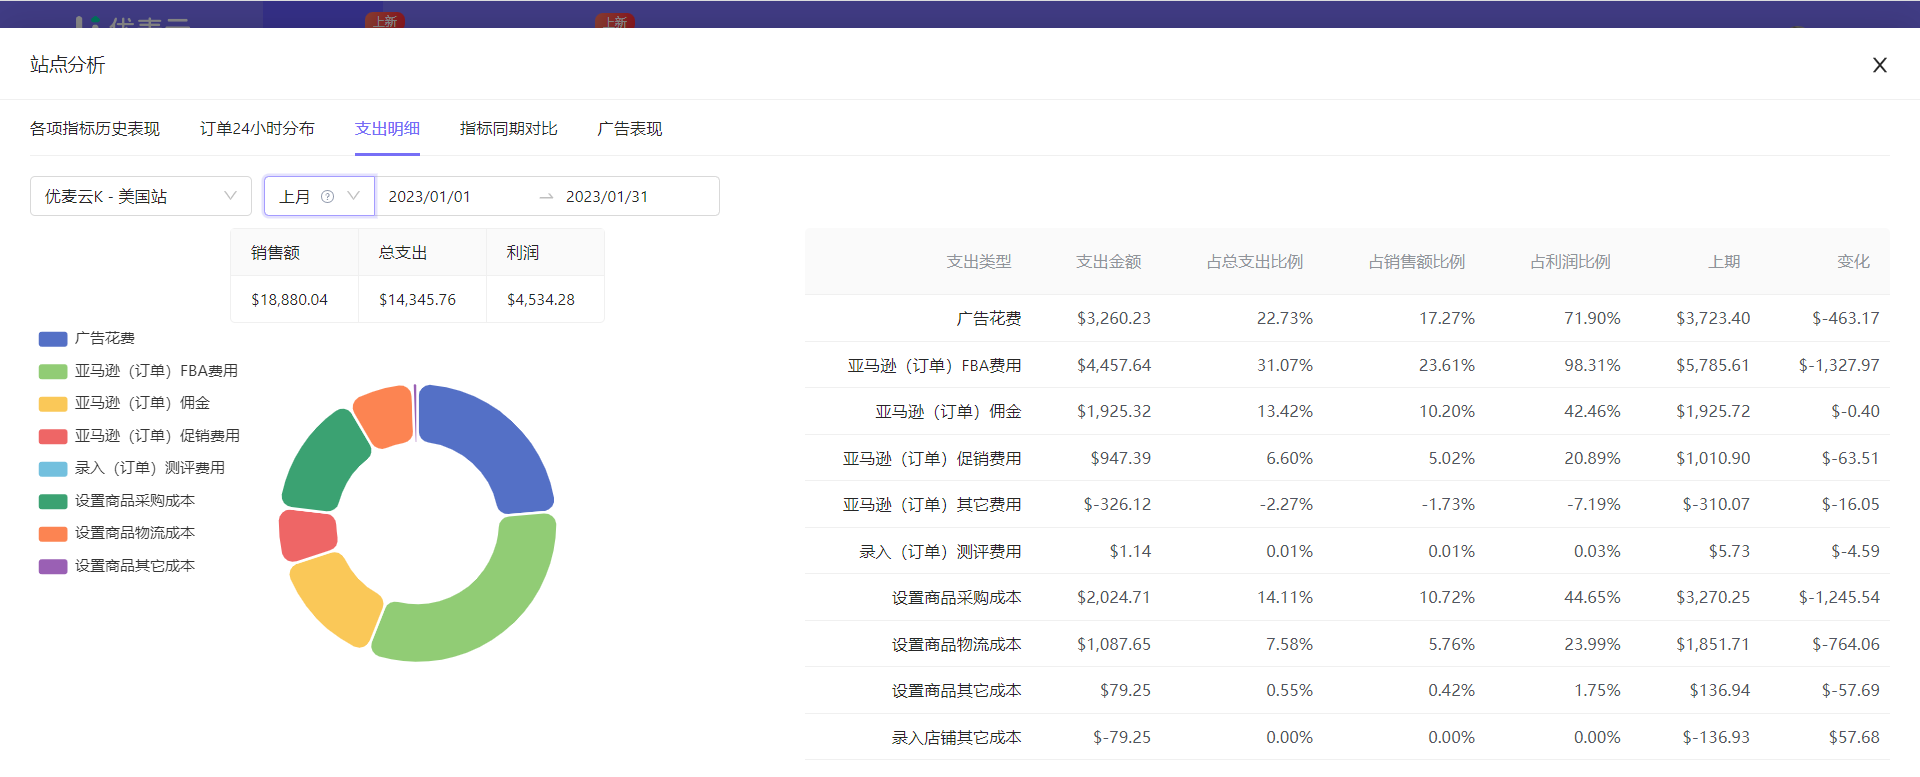
After the time and marketplace are set, the data below will be automatically switched. Including: Total Sales Revenue, Total Expenses, Total Profit, Expense Details, and Pie Chart of Each Expense Type.
 +
+
Among them, hover the mouse over each color block to also view detailed data.
 +
+
At this time, we can directly analyze the expense details of SellerSpace K - US marketplace last month.
For example:
It can be seen from the above data that the overall profit of this marketplace is relatively low, and the proportion of advertising expenses is relatively high. We can speculate that there may be unreasonable aspects in the current advertising placement. Is it because new products are being promoted, and traffic is mainly obtained through advertising, or is there a problem with our advertising strategy that needs to be improved, etc.? Specific analysis is needed according to the specific situation.
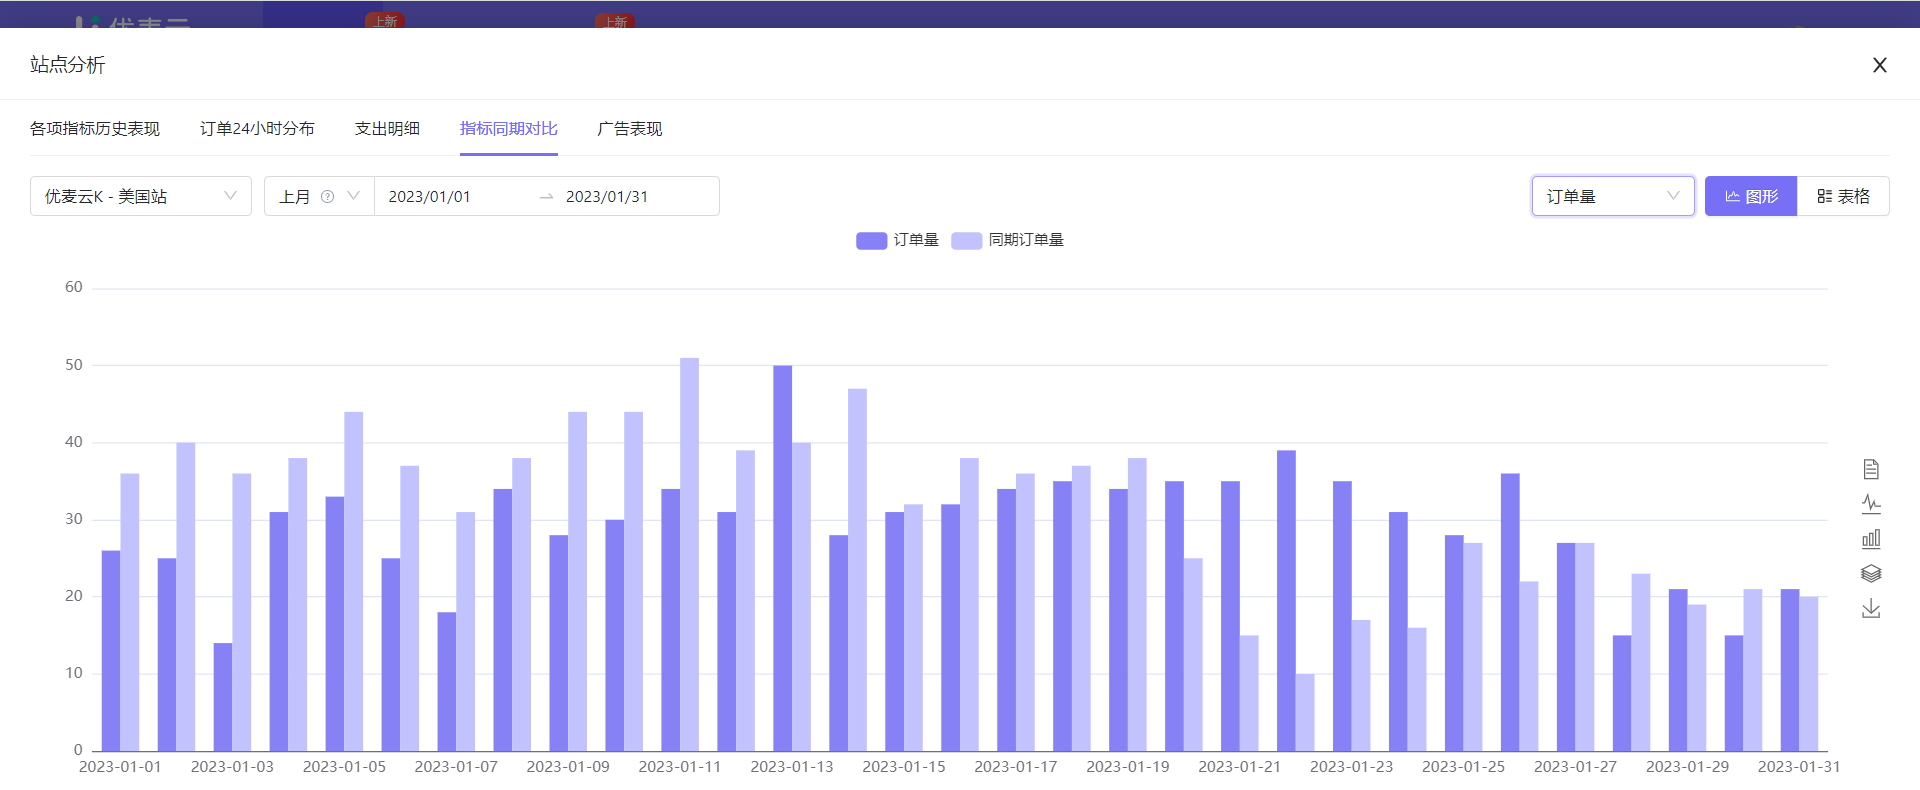
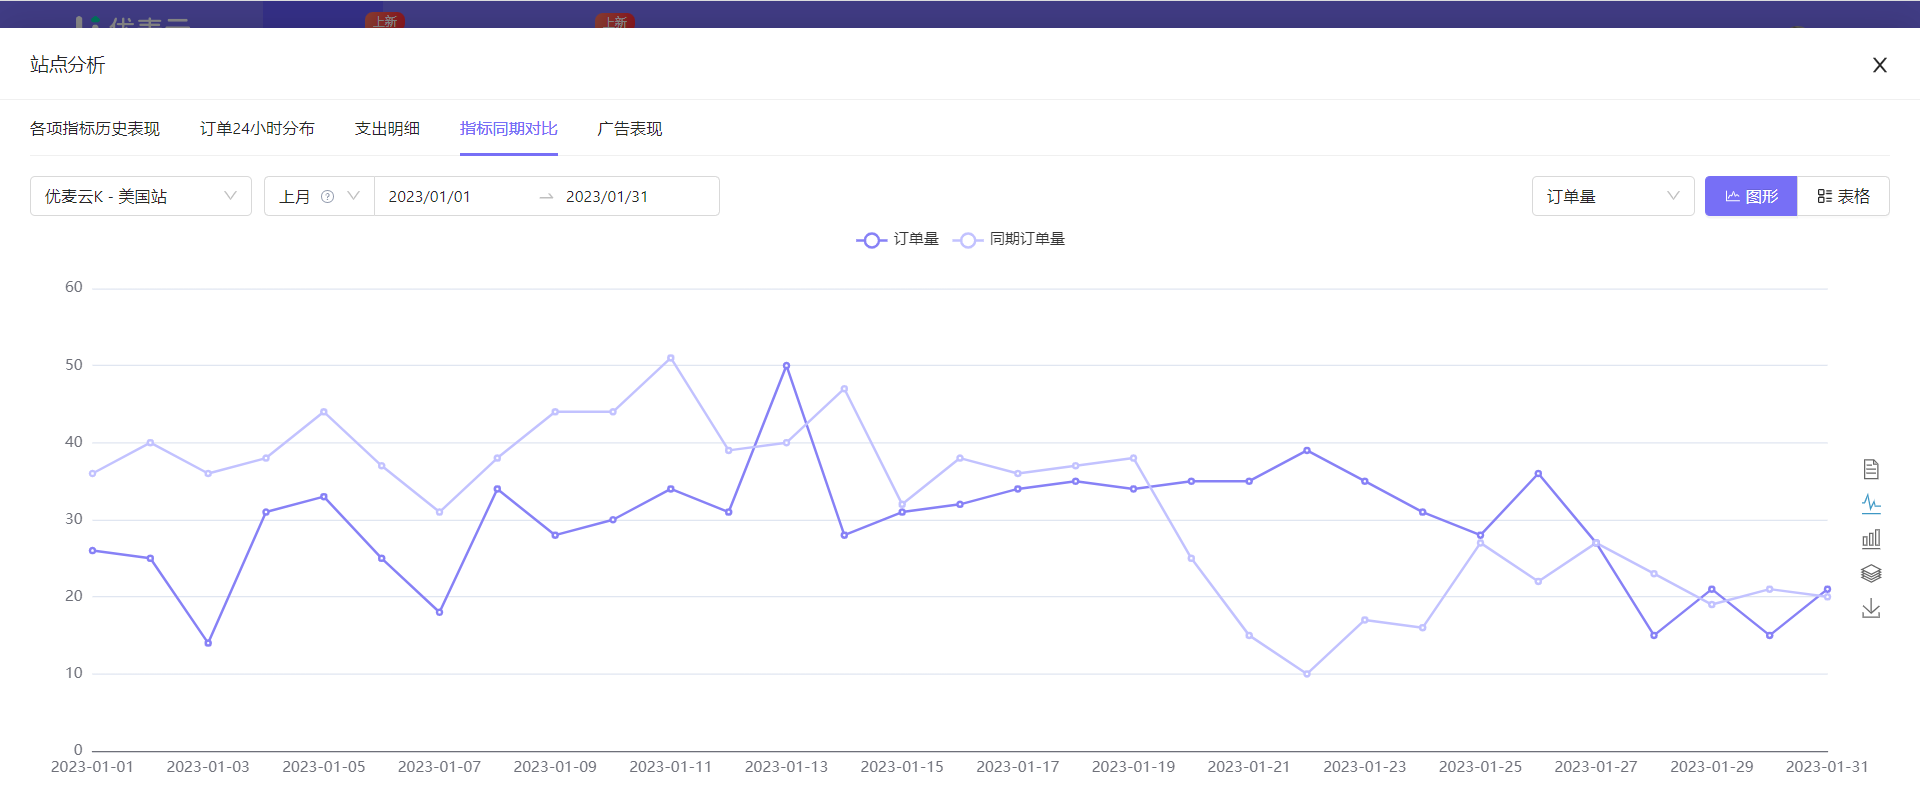
⑤ Period-over-Period Metric Comparison
Period-over-period metric comparison can help us analyze the changes in various sales metrics of the marketplace, analyze whether the optimization operation is correct, and whether there are any abnormalities in daily operations, helping us quickly identify loopholes and optimize in time.
 +
+
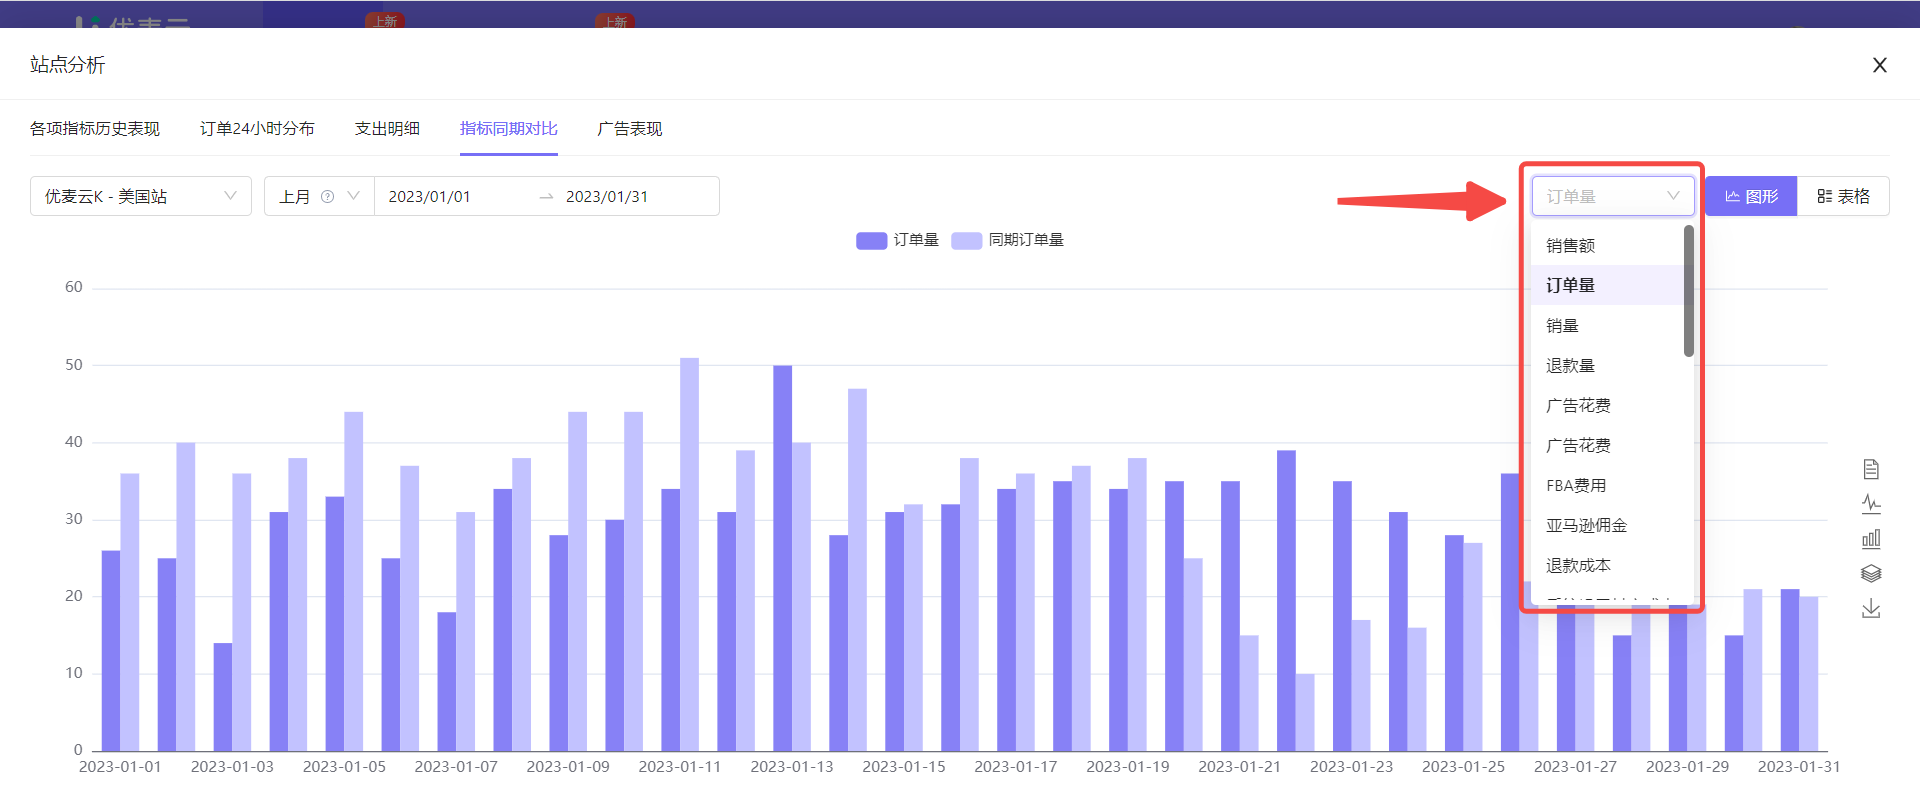
Take analyzing the order volume changes of SellerSpace K - US marketplace last month in line chart format as an example,
Click the metric selection bar in the upper right corner and select the metric to be analyzed [Order Volume],
 +
+
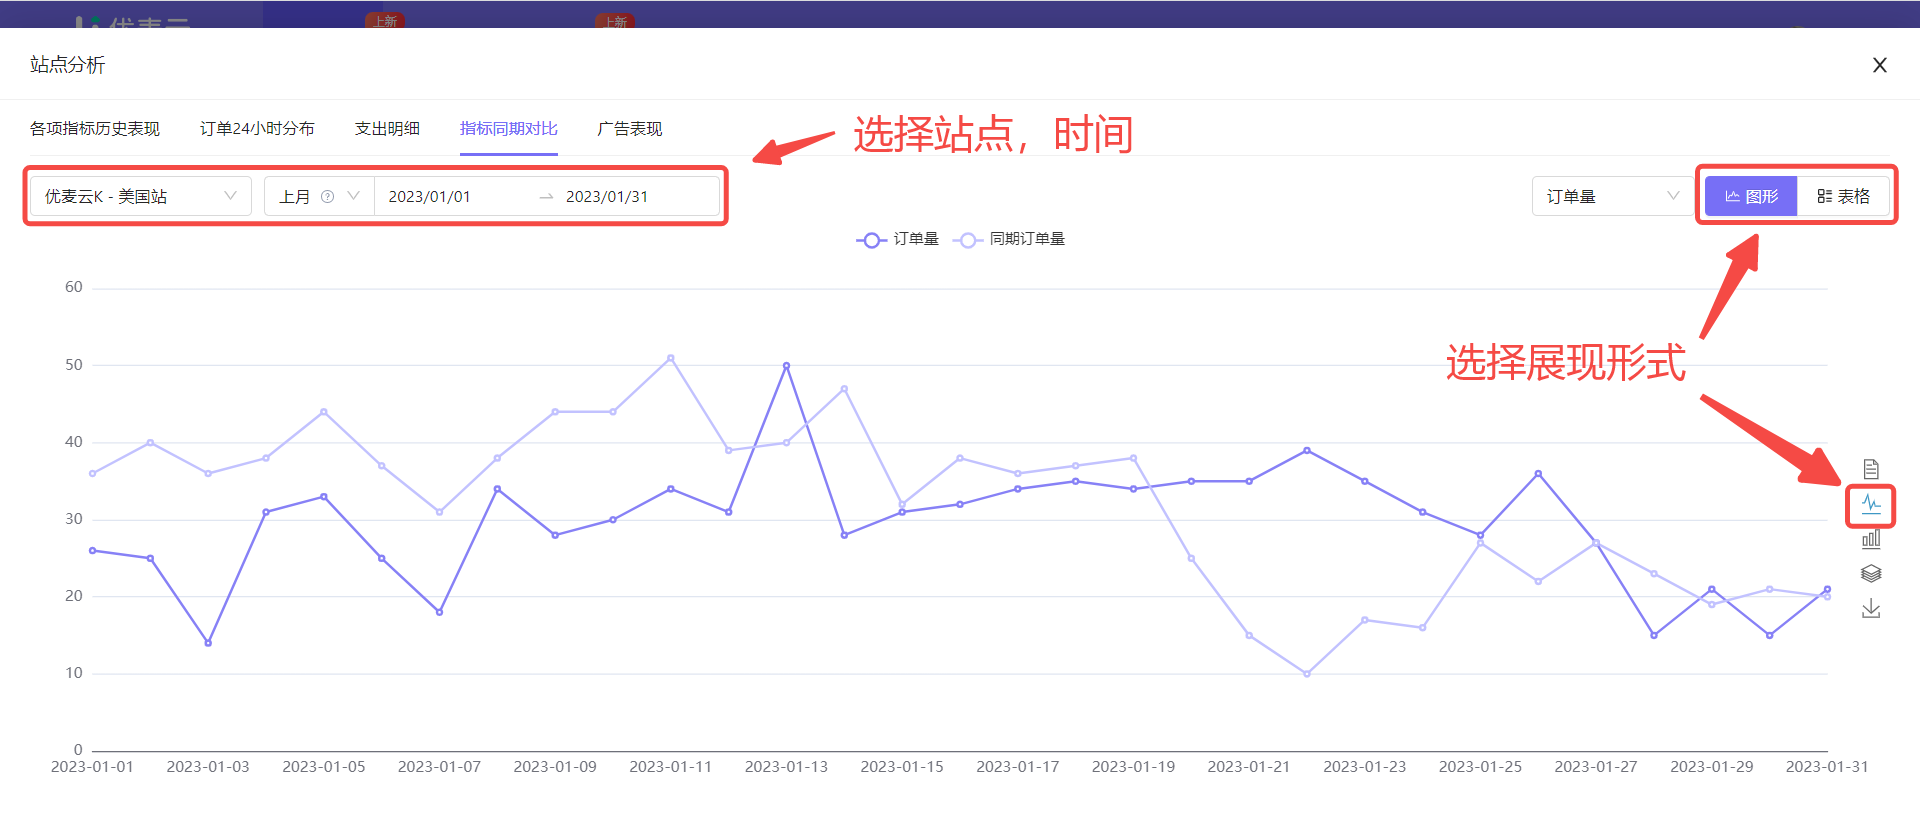
After selecting the metric, we continue to select the marketplace to be analyzed, time, and data display format.
The above three operations are basically the same as [24-Hour Order Distribution].
We directly select SellerSpace K - US marketplace, last month, and line chart.
 +
+
Through the above operations, we get the target data.
 +
+
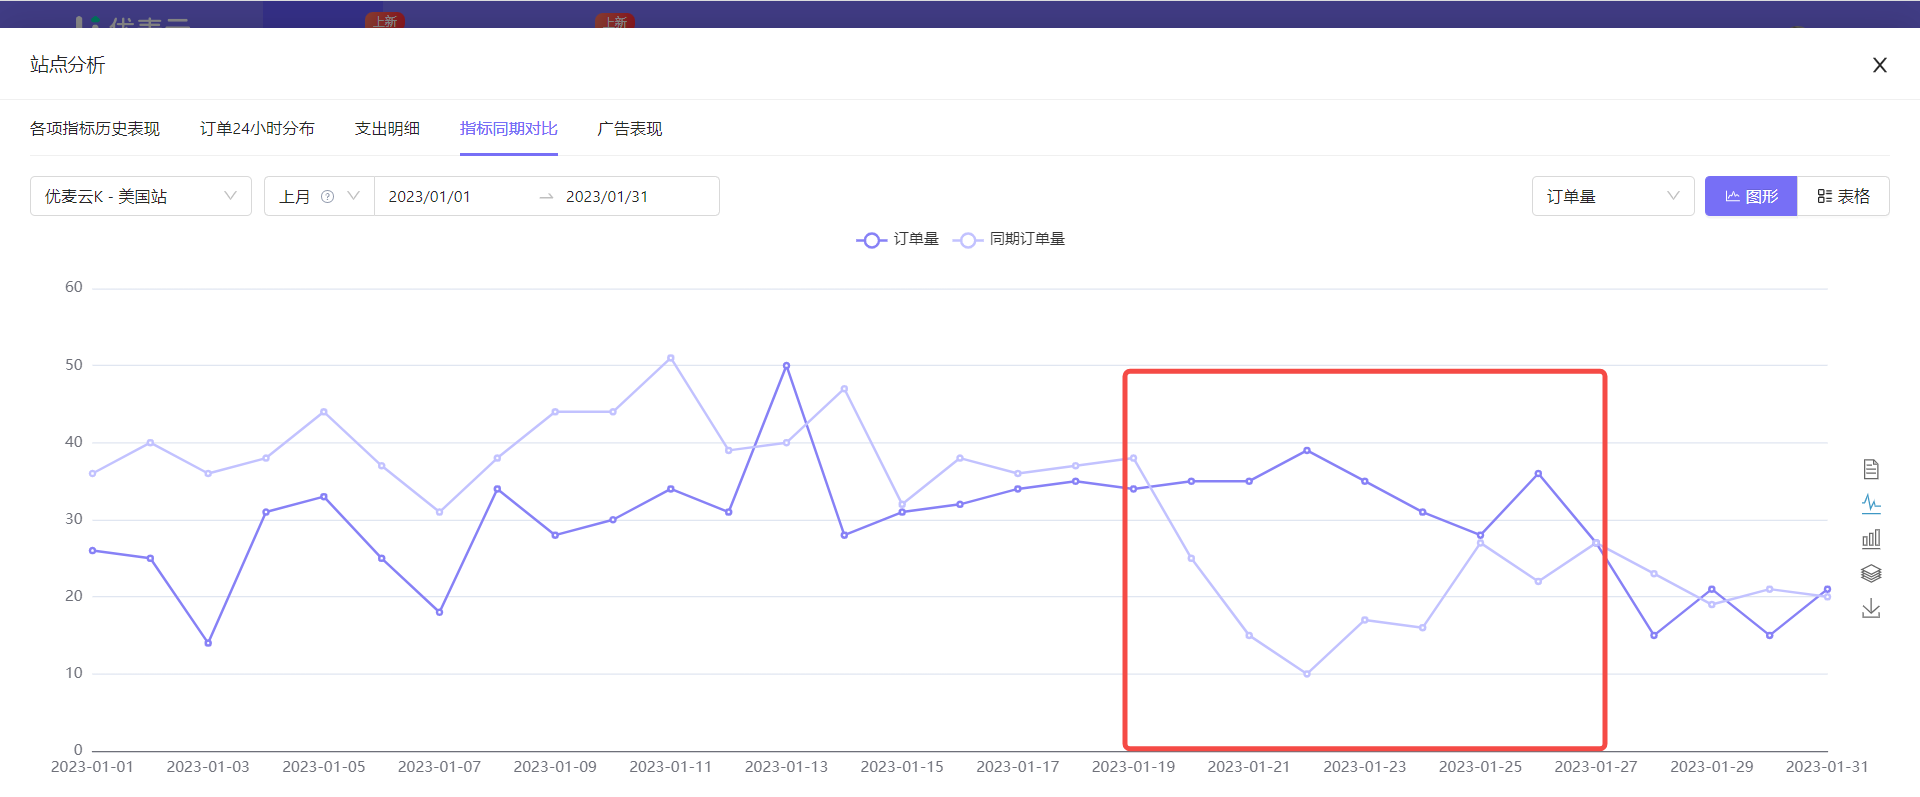
At this time, we can analyze through the line chart.
For example, through the chart data, we found that from January 19, 2023 to January 27, 2023, for a continuous period of time, only this week, the order volume of SellerSpace K - US marketplace has always exceeded the previous month. What could be the reason?
At this time, we can speculate that it may be that we have made some optimization adjustments that have had an effect, but have not been maintained; or participated in flash sales, such as 7-day flash sales, which happened to be that week, allowing sales to rise, etc. We will make corresponding adjustments and optimizations based on different analysis results in the future.
 +
+
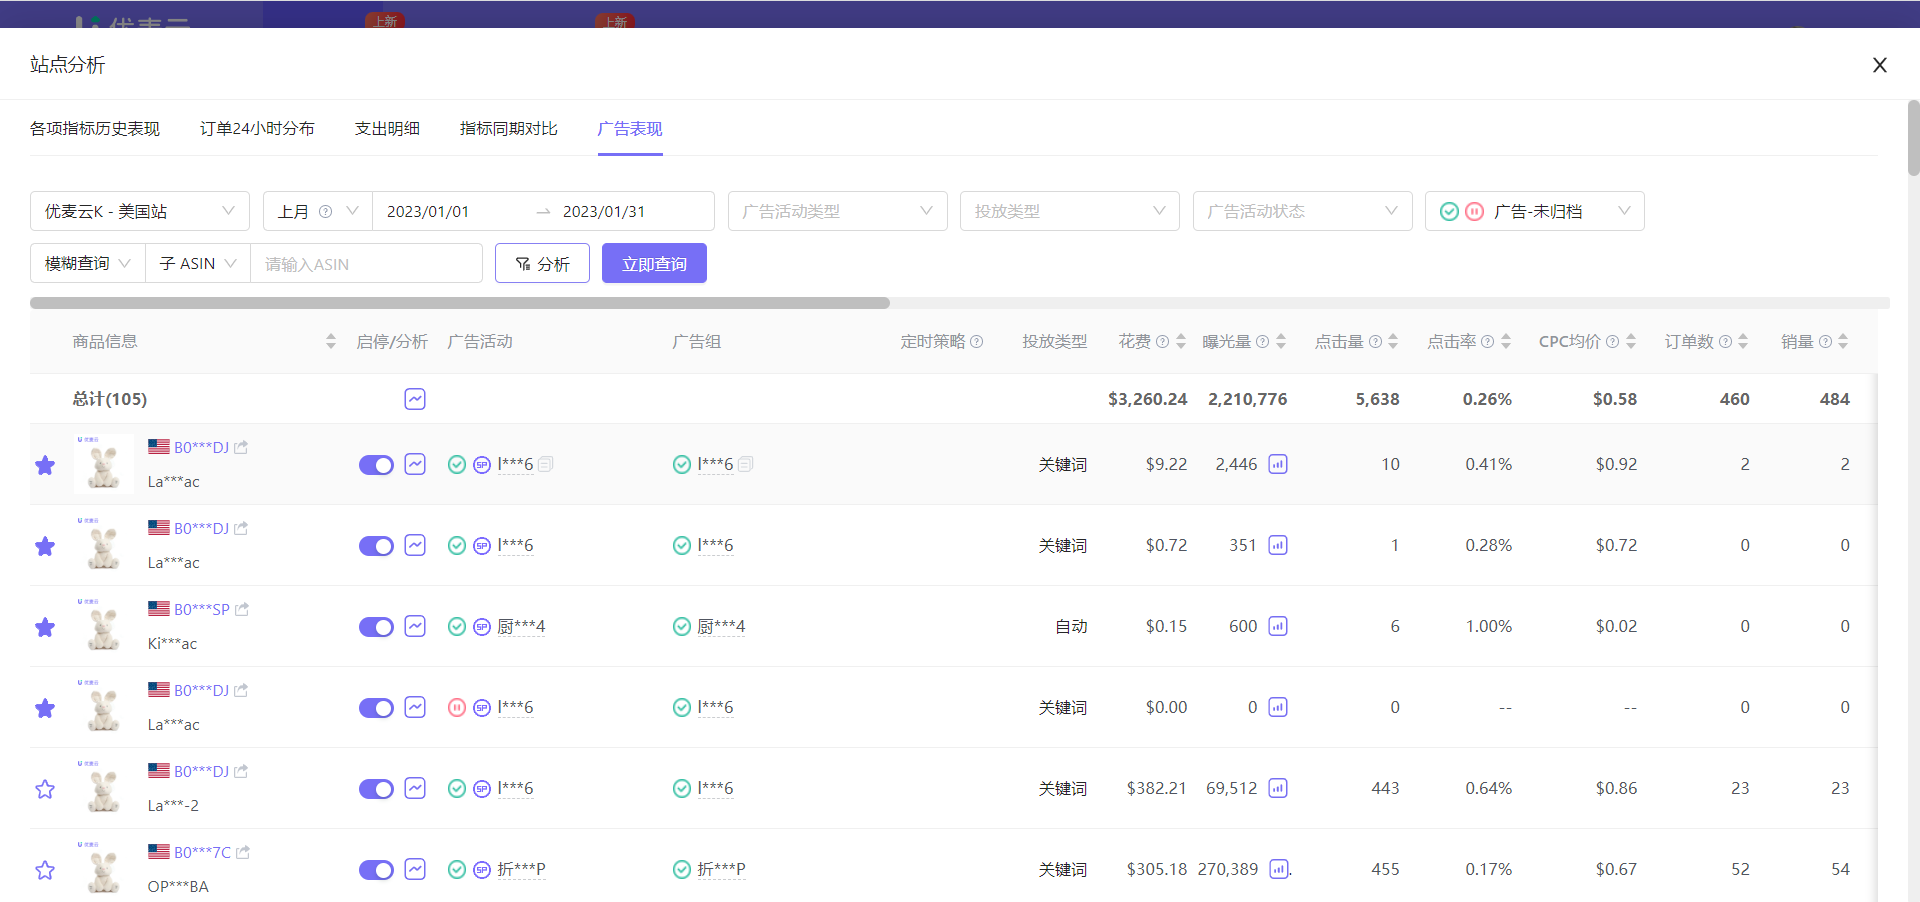
⑥ Advertising Performance
The advertising performance data of Marketplace Analysis displays the placement data of all promoted products under the selected marketplace and time. We can directly view and analyze the advertising performance of the marketplace here, which is convenient and quick.
All analysis operation methods here are consistent with "Advertising Management -> Promoted Products".
Click here to learn about "Promoted Products - Help"
One point to add here: The advertising performance of promoted products does not include Sponsored Brands (SB) ads.
Why not include Sponsored Brands (SB) ads?
Because what is displayed here is promoted product advertising, which is product-dimension advertising performance, while brand advertising is brand dimension, that is, marketplace-dimension advertising performance. The dimensions are different, and brand advertising data cannot be allocated to a single product, so it is not included.
 +
+
2. Compare and Analyze Marketplace Data
You can compare single metrics of different marketplaces separately to help sellers operating multiple marketplaces understand the sales and profitability of each marketplace. You can increase investment in marketplaces with high profit margins and optimize or adjust investment in marketplaces with low profit margins or losses.
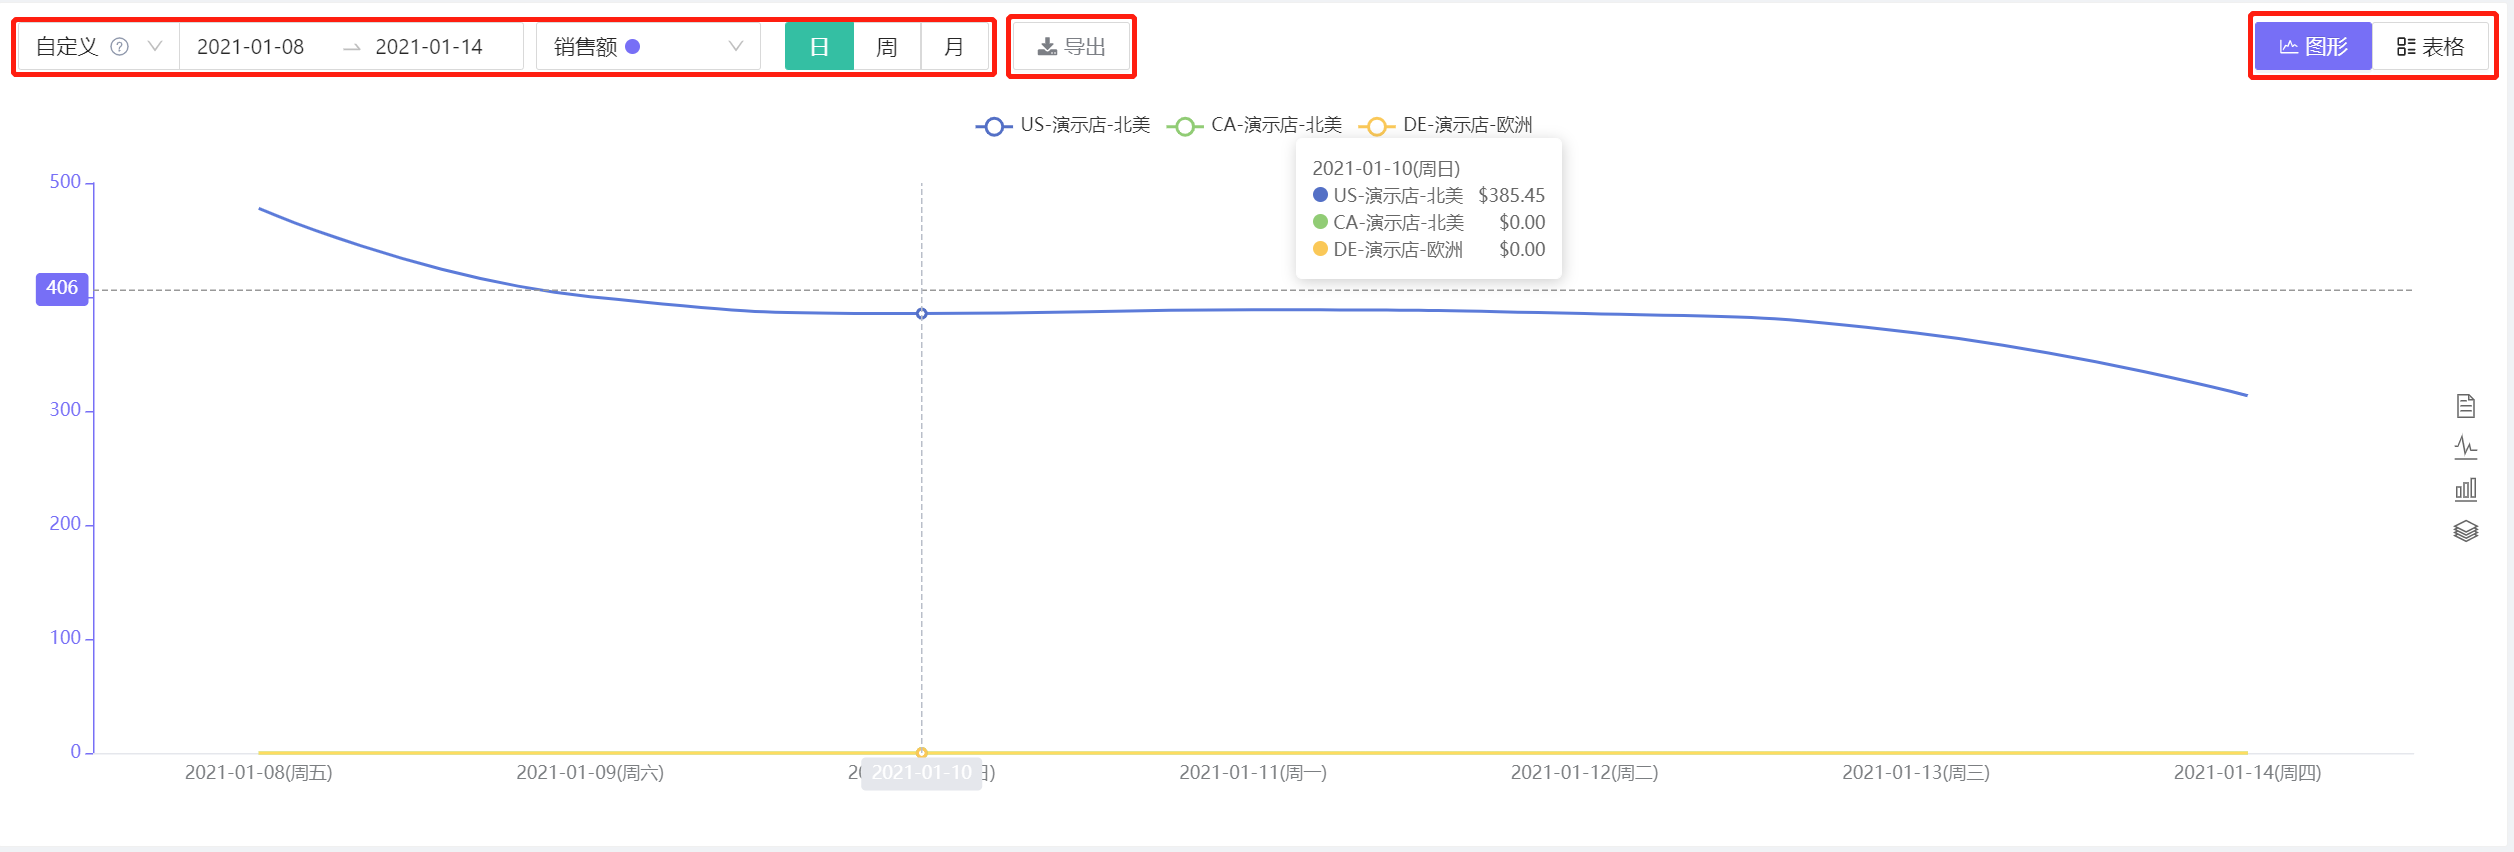
2.1 Filter Query Conditions
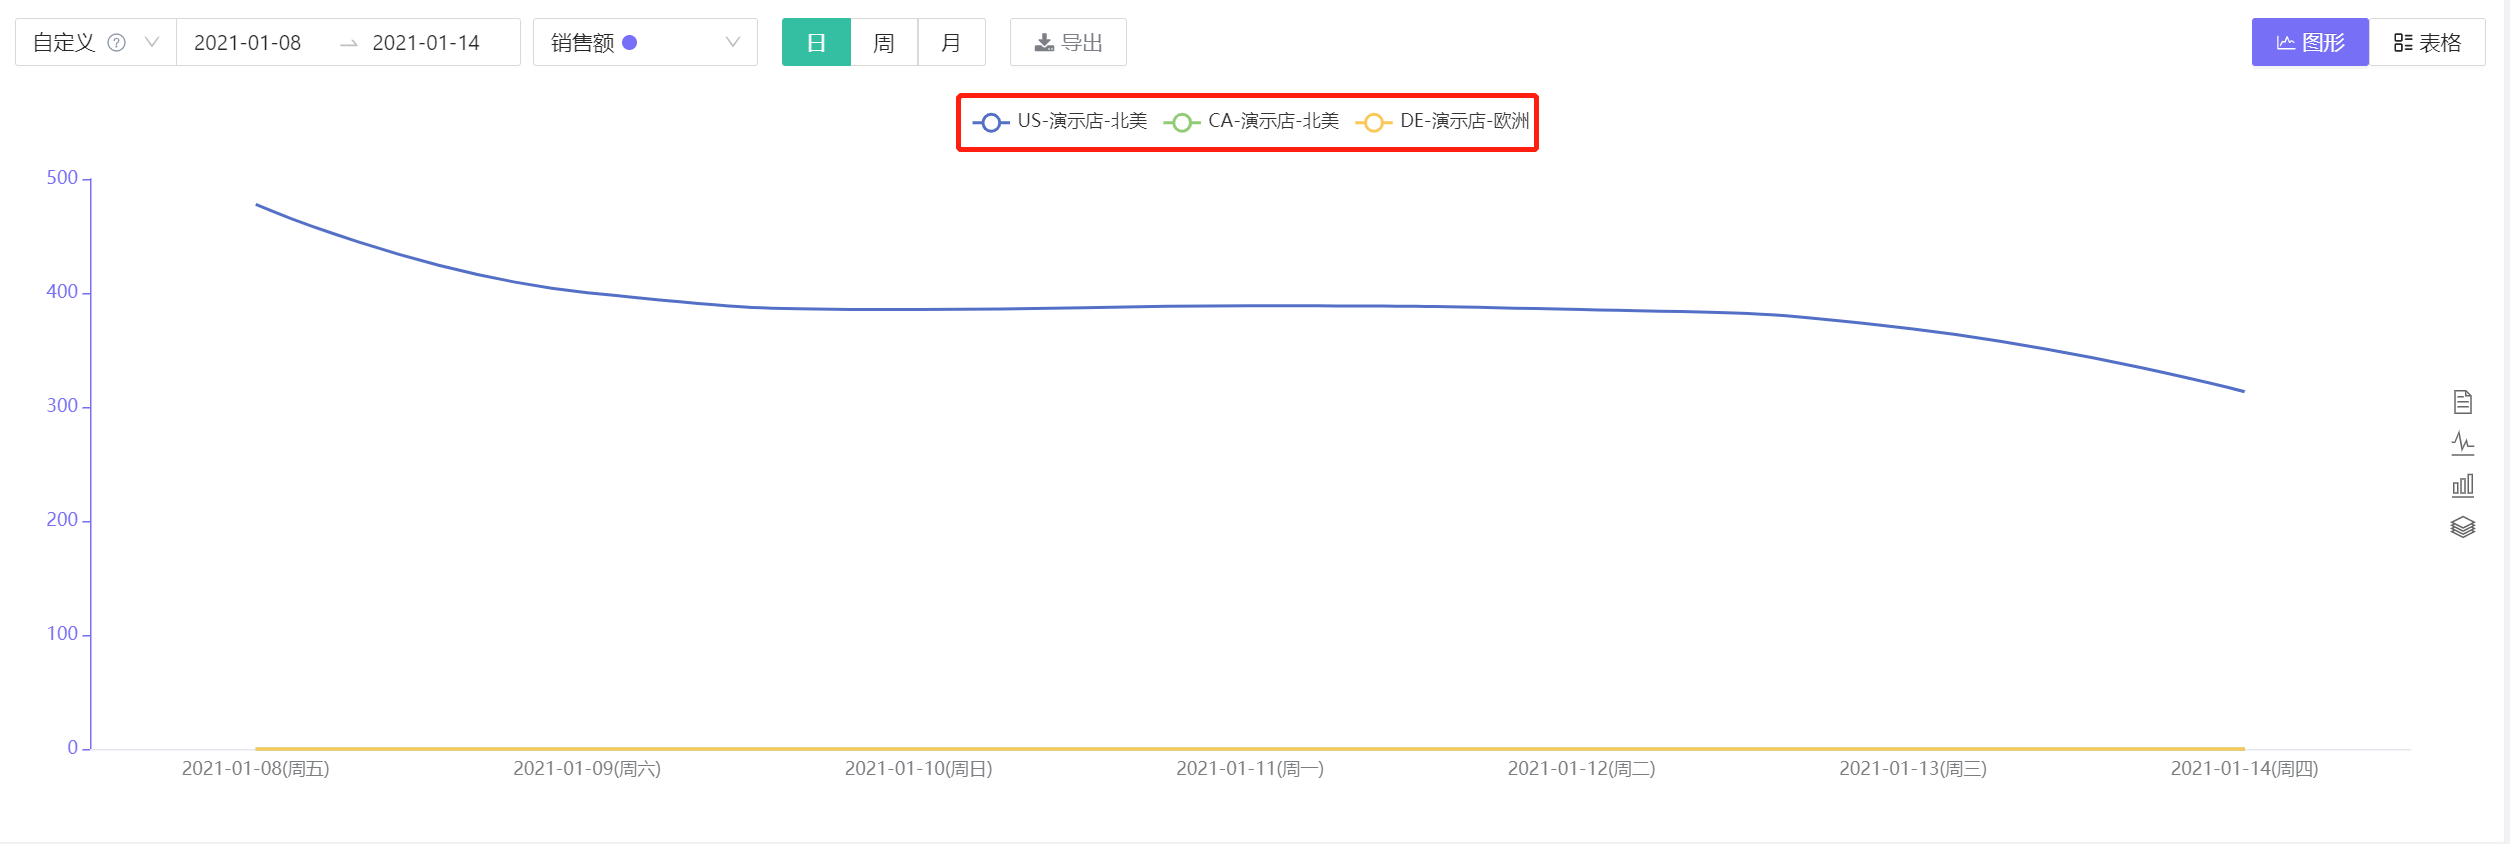
You can choose or customize the time range, compare and analyze data items (single selection), display method: hour/day/week/month; data display method: graph/table to compare and analyze the operational status of each marketplace. Exporting is also supported.
Comparable and analyzable data: Sales, Profit, Expense, Advertising data.
 +
+
2.2 Click the marketplace name above the chart to choose to show/hide the marketplace.
 +
+
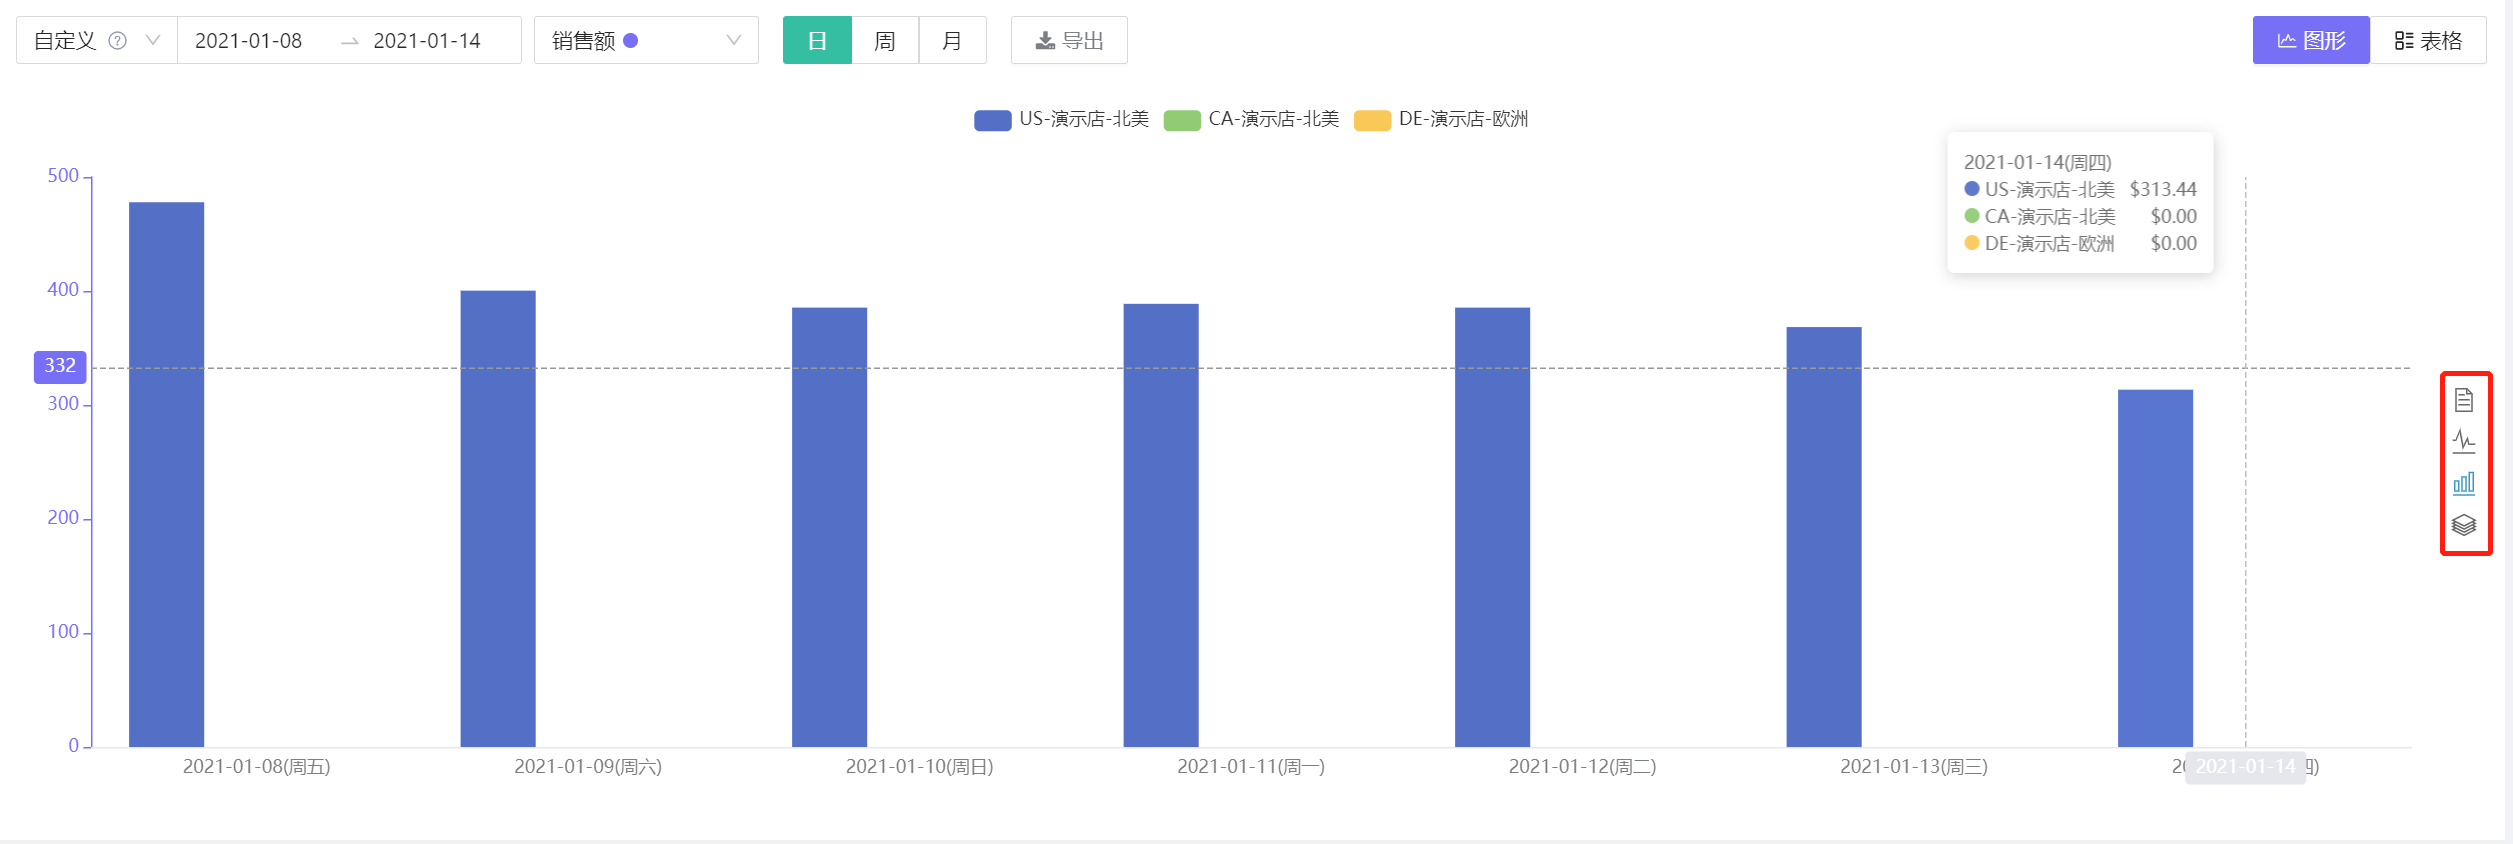
2.3 Graphs support two forms: curve and bar. You can click the small icon on the right to switch.
 +
+